

The DOI matches its Crossref record; 11 of the 11 references it cites were found in a registry or an index.
miR-129-5p as a biomarker for pathology and cognitive decline in Alzheimer’s disease
Published version of a preprint
Abstract
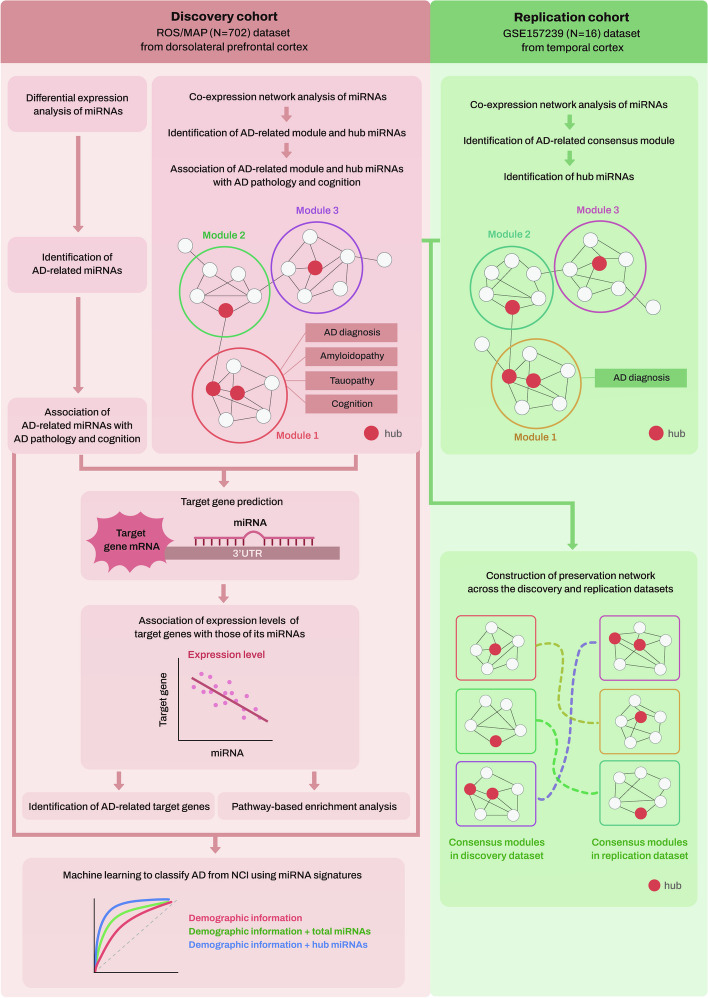
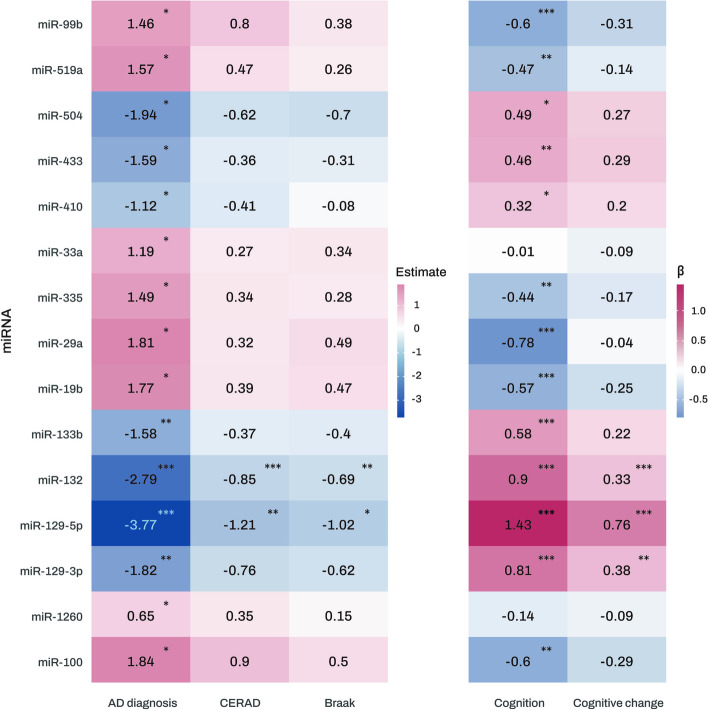
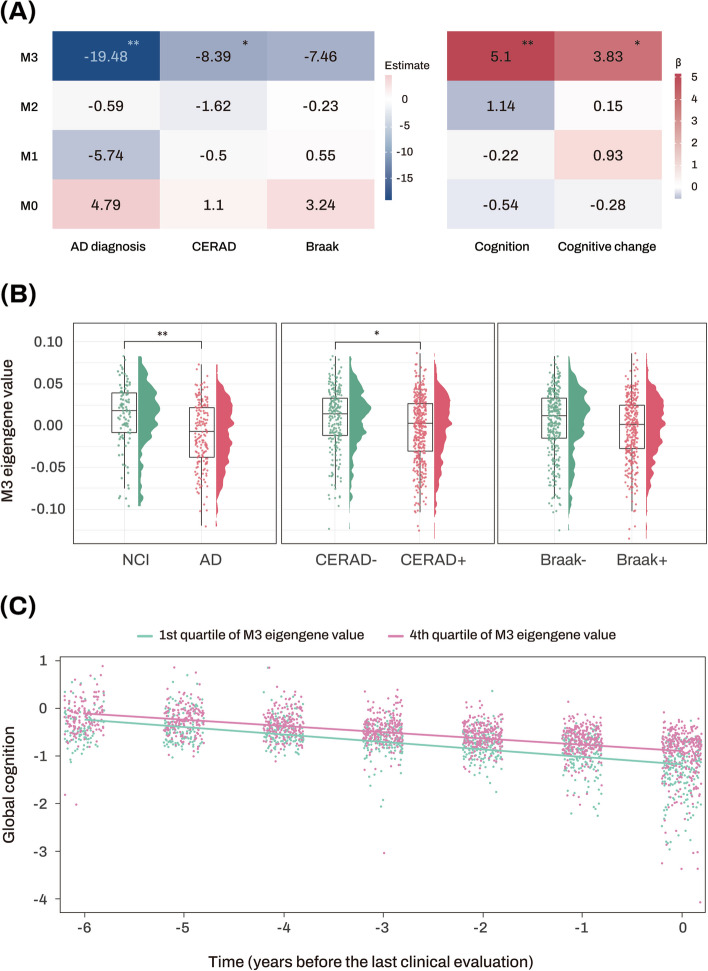
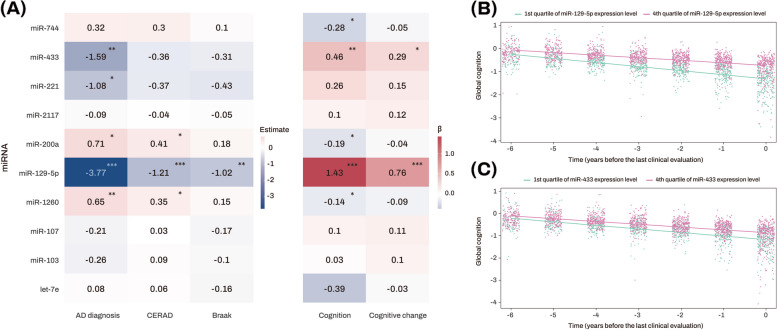
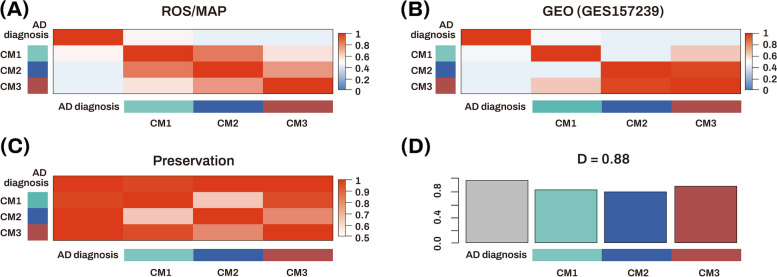
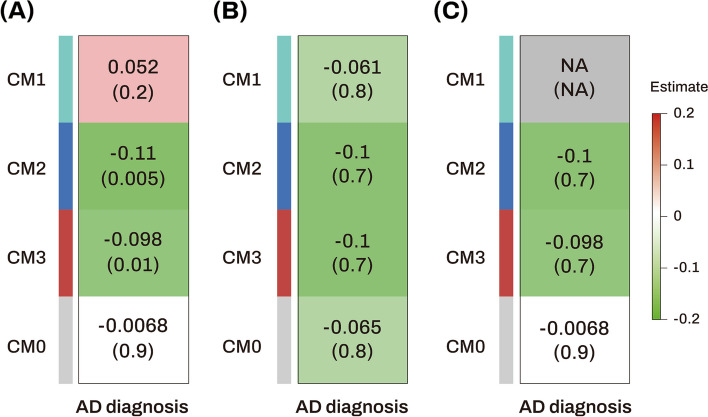
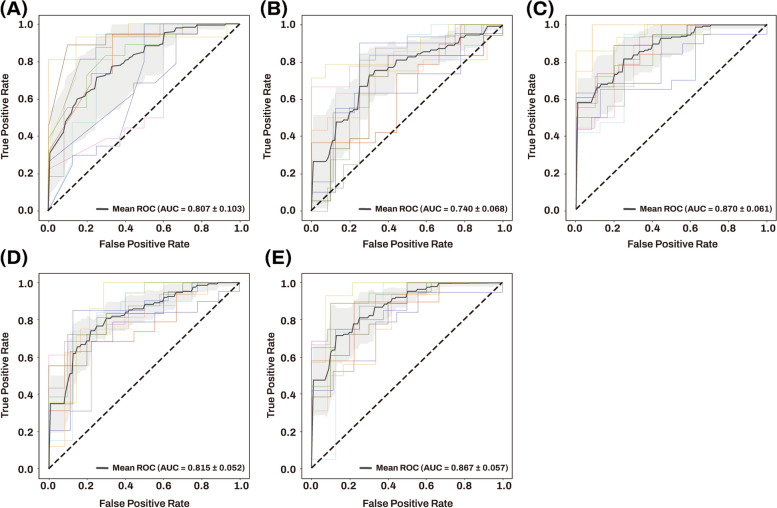
Background: Alzheimer’s dementia (AD) pathogenesis involves complex mechanisms, including microRNA (miRNA) dysregulation. Integrative network and machine learning analysis of miRNA can provide insights into AD pathology and prognostic/diagnostic biomarkers. Methods: We performed co-expression network analysis to identify network modules associated with AD, its neuropathology markers, and cognition using brain tissue miRNA profiles from the Religious Orders Study and Rush Memory and Aging Project (ROS/MAP) ( N = 702) as a discovery dataset. We performed association analysis of hub miRNAs with AD, its neuropathology markers, and cognition. After selecting target genes of the hub miRNAs, we performed association analysis of the hub miRNAs with their target genes and then performed pathway-based enrichment analysis. For replication, we performed a consensus miRNA co-expression network analysis using the ROS/MAP dataset and an independent dataset ( N = 16) from the Gene Expression Omnibus (GEO). Furthermore, we performed a machine learning approach to assess the performance of hub miRNAs for AD classification. Results: Network analysis identified a glucose metabolism pathway-enriched module (M3) as significantly associated with AD and cognition. Five hub miRNAs (miR-129-5p, miR-433, miR-1260, miR-200a, and miR-221) of M3 had significant associations with AD clinical and/or pathologic traits, with miR129-5p by far the strongest across all phenotypes. Gene-set enrichment analysis of target genes associated with their corresponding hub miRNAs identified significantly enriched biological pathways including ErbB, AMPK, MAPK, and mTOR signaling pathways. Consensus network analysis identified two AD-associated consensus network modules and two hub miRNAs (miR-129-5p and miR-221). Machine learning analysis showed that the AD classification performance (area under the curve (AUC) = 0.807) of age, sex, and APOE ε4 carrier status was significantly improved by 6.3% with inclusion of five AD-associated hub miRNAs. Conclusions: Integrative network and machine learning analysis identified miRNA signatures, especially miR-129-5p, as associated with AD, its neuropathology markers, and cognition, enhancing our understanding of AD pathogenesis and leading to better performance of AD classification as potential diagnostic/prognostic biomarkers.
Overview
The claims and statistics of this paper haven’t been checked yet.
Run the check — free, no account needed. It reads the open-access text and checks the sources it cites.
Integrity signals
Registry
Cites
Statistics
Figures
Verification
Claims the paper makes
The claims and statistics of this paper haven’t been checked yet.
Run the check — free, no account needed. It reads the open-access text and checks the sources it cites.
Claims other papers make about this one
Each is checked against this paper’s own text: does it say what the citing paper says it does?
The cited source doesn’t support the claim as written.
In the citing paper
“A recent study observed decreased miR-129-5p levels in postmortem brain samples of AD patients from the ROS/MAP cohort and a negative correlation to cognitive function [35], thereby confirming previous findings [17, 36].”
From A role for astrocytic miR-129-5p in frontotemporal dementia (2025) · cites this paper as [35]
Checked by a reasoning model — may be wrong.
Experimental — accuracy not yet measured
Self-check
Percentages, sums and reported differences re-computed from the paper’s own numbers.
The self-check needs the paper’s full text.
Citations
Cites
Alzheimer Disease: An Update on Pathobiology and Treatment Strategies
Long, J. M., & Holtzman, D. M. (2019) · Cell · doi:10.1016/j.cell.2019.09.001 · Cited by 3,204
What is principal component analysis?
Ringnér, M. (2008) · Nature Biotechnology · doi:10.1038/nbt0308-303 · Cited by 2,407
Mixed brain pathologies account for most dementia cases in community-dwelling older persons
Schneider, J. A., Arvanitakis, Z., Bang, W., & Bennett, D. A. (2007) · Neurology · doi:10.1212/01.wnl.0000271090.28148.24 · Cited by 1,992
Self-citationNeuropathology of older persons without cognitive impairment from two community-based studies
Bennett, D. A., Schneider, J. A., Arvanitakis, Z., Kelly, J. F., Aggarwal, N. T., Shah, R. C., & Wilson, R. S. (2006) · Neurology · doi:10.1212/01.wnl.0000219668.47116.e6 · Cited by 1,336
Self-citationMild cognitive impairment is related to Alzheimer disease pathology and cerebral infarctions
Bennett, D. A., Schneider, J. A., Bienias, J. L., Evans, D. A., & Wilson, R. S. (2005) · Neurology · doi:10.1212/01.wnl.0000152982.47274.9e · Cited by 537
Self-citationWan, Y.-W., Al-Ouran, R., Mangleburg, C. G., Perumal, T. M., Lee, T. V., Allison, K., Swarup, V., Funk, C. C., Gaiteri, C., Allen, M., et al. (2020) · Cell Reports · doi:10.1016/j.celrep.2020.107908 · Cited by 295 · cited 1×
“NCI was defined by Braak scores ≦ 3, the CERAD scores of possible Alzheimer’s disease (sparse NPs) or no Alzheimer’s disease, and clinical diagnosis of no cognitive impairment [21].”
MethodSelf-citationCell-Type-Based Analysis of MicroRNA Profiles in the Mouse Brain
He, M., Liu, Y., Wang, X., Zhang, M. Q., Hannon, G. J., & Huang, Z. J. (2012) · Neuron · doi:10.1016/j.neuron.2011.11.010 · Cited by 277
miRNATissueAtlas2: an update to the human miRNA tissue atlas
Keller, A., Gröger, L., Tschernig, T., Solomon, J., Laham, O., Schaum, N., Wagner, V., Kern, F., Schmartz, G. P., Li, Y., et al. (2022) · Nucleic Acids Research · doi:10.1093/nar/gkab808 · Cited by 143
Liu, D., Tang, H., Li, X.-Y., Deng, M.-F., Wei, N., Wang, X., Zhou, Y.-F., Wang, D.-Q., Fu, P., Wang, J.-Z., et al. (2017) · Molecular Therapy · doi:10.1016/j.ymthe.2017.01.018 · Cited by 127
Genetics of Gene Expression in the Aging Human Brain Reveal TDP-43 Proteinopathy Pathophysiology
Yang, H.-S., White, C. C., Klein, H.-U., Yu, L., Gaiteri, C., Ma, Y., Felsky, D., Mostafavi, S., Petyuk, V. A., Sperling, R. A., et al. (2020) · Neuron · doi:10.1016/j.neuron.2020.05.010 · Cited by 47
Self-citationPomper, N., Liu, Y., Hoye, M. L., Dougherty, J. D., & Miller, T. M. (2020) · Scientific Reports · doi:10.1038/s41598-020-61307-5 · Cited by 39
Research works printed but not linked: 73
- Association As. 2012 Alzheimer’s disease facts and figures. Alzheimers Dement. 2012;8(2):131–68. · DOI
- Hampel H, Frank R, Broich K, Teipel SJ, Katz RG, Hardy J, et al. Biomarkers for Alzheimer's disease: academic, industry and regulatory perspectives. Nat Rev Drug Discov. 2010;9(7):560–74. · DOI
- Kou X, Chen D, Chen N. The regulation of microRNAs in Alzheimer's disease. Front Neurol. 2020;11:288. · DOI · Paper page
- Wang M, Qin L, Tang B. MicroRNAs in Alzheimer’s disease. Front Genet. 2019;10:153. · DOI
- Patrick E, Rajagopal S, Wong H-KA, McCabe C, Xu J, Tang A, et al. Dissecting the role of non-coding RNAs in the accumulation of amyloid and tau neuropathologies in Alzheimer’s disease. Mol Neurodegener. 2017;12(1):1–13. · DOI · Paper page
- Winter J, Jung S, Keller S, Gregory RI, Diederichs S. Many roads to maturity: microRNA biogenesis pathways and their regulation. Nat Cell Biol. 2009;11(3):228–34. · DOI
- Bartel DP. MicroRNAs: genomics, biogenesis, mechanism, and function. cell. 2004;116(2):281–97. · DOI
- Arora T, Prashar V, Singh R, Barwal TS, Changotra H, Sharma A, et al. Dysregulated miRNAs in progression and pathogenesis of Alzheimer’s disease. Mol Neurobiol. 2022;59(10):1–18. · DOI · Paper page
- Miya Shaik M, Tamargo IA, Abubakar MB, Kamal MA, Greig NH, Gan SH. The role of microRNAs in Alzheimer’s disease and their therapeutic potentials. Genes. 2018;9(4):174. · DOI
- Lau P, Frigerio CS, De Strooper B. Variance in the identification of microRNAs deregulated in Alzheimer's disease and possible role of lincRNAs in the pathology: the need of larger datasets. Ageing Res Rev. 2014;17:43–53. · DOI
- Carter SL, Brechbühler CM, Griffin M, Bond AT. Gene co-expression network topology provides a framework for molecular characterization of cellular state. Bioinformatics. 2004;20(14):2242–50. · DOI · Paper page
- Eisen MB, Spellman PT, Brown PO, Botstein D. Cluster analysis and display of genome-wide expression patterns. Proc Natl Acad Sci U S A. 1998;95(25):14863–8. · DOI · Paper page
- Langfelder P, Horvath S. WGCNA: an R package for weighted correlation network analysis. BMC Bioinformatics. 2008;9(1):1–13. · DOI · Paper page
- Pedersen HK, Forslund SK, Gudmundsdottir V, Petersen AØ, Hildebrand F, Hyötyläinen T, et al. A computational framework to integrate high-throughput ‘-omics’ datasets for the identification of potential mechanistic links. Nat Protoc. 2018;13(12):2781–800. · DOI
- Zhang T, Shen Y, Guo Y, Yao J. Identification of key transcriptome biomarkers based on a vital gene module associated with pathological changes in Alzheimer’s disease. Aging (Albany NY). 2021;13(11):14940. · DOI
- Bennett DA, Schneider JA, Aggarwal NT, Arvanitakis Z, Shah RC, Kelly JF, et al. Decision rules guiding the clinical diagnosis of Alzheimer’s disease in two community-based cohort studies compared to standard practice in a clinic-based cohort study. Neuroepidemiology. 2006;27(3):169–76. · DOI
- Braak H, Alafuzoff I, Arzberger T, Kretzschmar H, Del Tredici K. Staging of Alzheimer disease-associated neurofibrillary pathology using paraffin sections and immunocytochemistry. Acta Neuropathol. 2006;112(4):389–404. · DOI · Paper page
- Mirra SS, Heyman A, McKeel D, Sumi S, Crain BJ, Brownlee L, et al. The Consortium to Establish a Registry for Alzheimer's Disease (CERAD): part II. Standardization of the neuropathologic assessment of Alzheimer's disease. Neurology. 1991;41(4):479–9. · DOI · Paper page
- Henriques AD, Machado-Silva W, Leite RE, Suemoto CK, Leite KR, Srougi M, et al. Genome-wide profiling and predicted significance of post-mortem brain microRNA in Alzheimer’s disease. Mech Ageing Dev. 2020;191:111352. · DOI
- Kozomara A, Griffiths-Jones S. miRBase: annotating high confidence microRNAs using deep sequencing data. Nucleic Acids Res. 2014;42(D1):D68–73. · DOI · Paper page
- De Jager PL, Ma Y, McCabe C, Xu J, Vardarajan BN, Felsky D, et al. A multi-omic atlas of the human frontal cortex for aging and Alzheimer’s disease research. Sci Data. 2018;5(1):1–13. · DOI · Paper page
- Zhang Y, Parmigiani G, Johnson WE. ComBat-seq: batch effect adjustment for RNA-seq count data. Genom Bioinform. 2020;2(3):lqaa078. · DOI · Paper page
- Karpenko O, Bahroos N, Chukhman M, Dong X, Kanabar P, Arbieva Z, et al. Galaxy high throughput genotyping pipeline for GeneTitan. AMIA Jt Summits Transl Sci Proc. 2013;2013:102–2.
- Irizarry RA, Hobbs B, Collin F, Beazer-Barclay YD, Antonellis KJ, Scherf U, et al. Exploration, normalization, and summaries of high density oligonucleotide array probe level data. Biostatistics. 2003;4(2):249–64. · DOI · Paper page
- Wang M, Beckmann ND, Roussos P, Wang E, Zhou X, Wang Q, et al. The Mount Sinai cohort of large-scale genomic, transcriptomic and proteomic data in Alzheimer's disease. Sci Data. 2018;5(1):1–16. · DOI · Paper page
- Trapnell C, Roberts A, Goff L, Pertea G, Kim D, Kelley DR, et al. Differential gene and transcript expression analysis of RNA-seq experiments with TopHat and Cufflinks. Nat Protoc. 2012;7(3):562–78. · DOI
- Langmead B, Trapnell C, Pop M, Salzberg SL. Ultrafast and memory-efficient alignment of short DNA sequences to the human genome. Genome Biol. 2009;10(3):1–10. · DOI · Paper page
- Li B, Dewey CN. RSEM: accurate transcript quantification from RNA-Seq data with or without a reference genome. BMC Bioinformatics. 2011;12:1–16. · DOI · Paper page
- Wilson RS, Segawa E, Boyle PA, Anagnos SE, Hizel LP, Bennett DA. The natural history of cognitive decline in Alzheimer's disease. Psychol Aging. 2012;27(4):1008. · DOI
- Nam J-W, Rissland OS, Koppstein D, Abreu-Goodger C, Jan CH, Agarwal V, et al. Global analyses of the effect of different cellular contexts on microRNA targeting. Mol Cell. 2014;53(6):1031–43. · DOI
- Wong N, Wang X. miRDB: an online resource for microRNA target prediction and functional annotations. Nucleic Acids Res. 2015;43(D1):D146–52. · DOI
- Huang DW, Sherman BT, Lempicki RA. Systematic and integrative analysis of large gene lists using DAVID bioinformatics resources. Nat Protoc. 2009;4(1):44–57. · DOI · Paper page
- Kanehisa M, Goto S. KEGG: kyoto encyclopedia of genes and genomes. Nucleic Acids Res. 2000;28(1):27–30. · DOI · Paper page
- Botstein D, Cherry JM, Ashburner M, Ball CA, Blake JA, Butler H, et al. Gene Ontology: tool for the unification of biology. Nat genet. 2000;25(1):25–9. · DOI · Paper page
- Li J, Han X, Wan Y, Zhang S, Zhao Y, Fan R, et al. TAM 2.0: tool for MicroRNA set analysis. Nucleic Acids Res. 2018;46(W1):W180–5. · DOI
- Neyman J, Pearson ES. On the use and interpretation of certain test criteria for purposes of statistical inference: part I. Biometrika. 1928;20A(1-2):175–240. · DOI
- Langfelder P, Horvath S. Eigengene networks for studying the relationships between co-expression modules. BMC Syst Biol. 2007;1:1–17. · DOI · Paper page
- Mueller AJ, Canty-Laird EG, Clegg PD, Tew SR. Cross-species gene modules emerge from a systems biology approach to osteoarthritis. NPJ Syst Biol Appl. 2017;3(1):13. · DOI
- Benjamini Y, Hochberg Y. Controlling the false discovery rate: a practical and powerful approach to multiple testing. J R Stat Soc Series B Stat Methodol. 1995;57(1):289–300. · DOI · Paper page
- Urbanowicz RJ, Zhang R, Cui Y, Suri P. STREAMLINE: a simple, transparent, end-to-end automated machine learning pipeline facilitating data analysis and algorithm comparison. ArXiv220612002 2022. · DOI
- Teipel SJ, Grothe MJ, Metzger CD, Grimmer T, Sorg C, Ewers M, et al. Robust detection of impaired resting state functional connectivity networks in Alzheimer's disease using elastic net regularized regression. Front Aging Neurosci. 2017;8:318. · DOI
- Bouckaert RR, Frank E. Evaluating the replicability of significance tests for comparing learning algorithms. Pacific-Asia conference on knowledge discovery and data mining; 2004: Springer; 2004: 3-12. · DOI
- Lau P, Bossers K, Rs J, Salta E, Frigerio CS, Barbash S, et al. Alteration of the micro RNA network during the progression of Alzheimer's disease. EMBO Mol Med. 2013;5(10):1613–34. · DOI · Paper page
- Liu Z, Hu C, Tang D, Luo G. miR-129 Promotes the proliferation of Alzheimer’s neuronal cells by binding the 3′ untranslated regions (3′ UTR) of amyloid precursor protein (APP). J Biomater Tissue Eng. 2022;12(3):551–7. · DOI
- Li Z, Chen Q, Liu J, Du Y. Physical exercise ameliorates the cognitive function and attenuates the neuroinflammation of Alzheimer’s disease via miR-129–5p. Dement Geriatr Cogn Disord. 2020;49(2):163–9. · DOI · Paper page
- Sun W, Zhao J, Li C. Dexmedetomidine provides protection against hippocampal neuron apoptosis and cognitive impairment in mice with Alzheimer’s disease by mediating the miR-129/YAP1/JAG1 axis. Mol Neurobiol. 2020;57(12):5044–55. · DOI
- Gupta R, Kumar P. Integrative analysis of OIP5-AS1/miR-129-5p/CREBBP axis as a potential therapeutic candidate in the pathogenesis of metal toxicity-induced Alzheimer's disease. Gene Rep. 2022;26:101442. · DOI
- Zhang Y-Y, Bao H-L, Dong L-X, Liu Y, Zhang G-W, An F-M. Silenced lncRNA H19 and up-regulated microRNA-129 accelerates viability and restrains apoptosis of PC12 cells induced by Aβ25-35 in a cellular model of Alzheimer’s disease. Cell Cycle. 2021;20(1):112–25. · DOI
- Manzine PR, Pelucchi S, Horst MA, Vale FA, Pavarini SC, Audano M, et al. microRNA 221 targets ADAM10 mRNA and is downregulated in Alzheimer’s disease. J Alzheimers Dis. 2018;61(1):113–23. · DOI
- Biglari N, Khalaj-Kondori M, Ghasemi T. Potential of hsa-miR200a-3p and hsa-miR502-3p as blood-based biomarker for Alzheimer’s disease. Mol Biol Rep. 2022;49(12):1–8. · DOI
- Chanda K, Jana NR, Mukhopadhyay D. Long non-coding RNA MALAT1 protects against Aβ1–42 induced toxicity by regulating the expression of receptor tyrosine kinase EPHA2 via quenching miR-200a/26a/26b in Alzheimer's disease. Life Sci. 2022;302(8):120652. · DOI
- Zhang Q-S, Liu W, Lu G-X. miR-200a-3p promotes β-Amyloid-induced neuronal apoptosis through down-regulation of SIRT1 in Alzheimer’s disease. J Biosci. 2017;42(3):397–404. · DOI
- Schipper HM, Maes OC, Chertkow HM, Wang E. MicroRNA expression in Alzheimer blood mononuclear cells. Gene Regul Syst Bio. 2007;1:GRSB.S361. · DOI
- Nagaraj S, Laskowska-Kaszub K, Dębski KJ, Wojsiat J, Dąbrowski M, Gabryelewicz T, et al. Profile of 6 microRNA in blood plasma distinguish early stage Alzheimer’s disease patients from non-demented subjects. Oncotarget. 2017;8(10):16122. · DOI
- Wang R, Zhang J. Clinical significance of miR-433 in the diagnosis of Alzheimer's disease and its effect on Aβ-induced neurotoxicity by regulating JAK2. Exp Gerontol. 2020;141:111080. · DOI
- Jiang Q, Chen S, Hu C, Huang P, Shen H, Zhao W. Neuregulin-1 (Nrg1) signaling has a preventive role and is altered in the frontal cortex under the pathological conditions of Alzheimer's disease. Mol Med Rep. 2016;14(3):2614–24. · DOI
- Yang Q, Zhao Q, Yin Y. miR-133b is a potential diagnostic biomarker for Alzheimer's disease and has a neuroprotective role. Exp Ther Med. 2019;18(4):2711–8.
- Chen S, Velardez MO, Warot X, Yu Z-X, Miller SJ, Cros D, et al. Neuregulin 1–erbB signaling is necessary for normal myelination and sensory function. J Neurosci. 2006;26(12):3079–86. · DOI
- Barbato C, Giacovazzo G, Albiero F, Scardigli R, Scopa C, Ciotti M, et al. Cognitive decline and modulation of alzheimer’s disease-related genes after inhibition of MicroRNA-101 in mouse hippocampal neurons. Mol Neurobiol. 2020;57:3183–94. · DOI
- Chang F, Zhang LH, Xu WP, Jing P, Zhan PY. microRNA-9 attenuates amyloidβ-induced synaptotoxicity by targeting calcium/calmodulin-dependent protein kinase kinase 2. Mol Med Rep. 2014;9(5):1917–22. · DOI · Paper page
- Li S, Yan Y, Jiao Y, Gao Z, Xia Y, Kong L, et al. Neuroprotective effect of osthole on neuron synapses in an Alzheimer’s disease cell model via upregulation of microRNA-9. J Mol Neurosci. 2016;60:71–81. · DOI · Paper page
- Muraleedharan R, Dasgupta B. AMPK in the brain: its roles in glucose and neural metabolism. FEBS J. 2022;289(8):2247–62. · DOI
- Zhang S, Lachance BB, Mattson MP, Jia X. Glucose metabolic crosstalk and regulation in brain function and diseases. Prog Neurobiol. 2021;204:102089. · DOI
- Lopez M, Nogueiras R, Tena-Sempere M, Dieguez C. Hypothalamic AMPK: a canonical regulator of whole-body energy balance. Nat Rev Endocrinol. 2016;12(7):421–32. · DOI
- Li Q, Wang Y, Peng W, Jia Y, Tang J, Li W, et al. MicroRNA-101a regulates autophagy phenomenon via the MAPK pathway to modulate Alzheimer’s-associated pathogenesis. Cell Transplant. 2019;28(8):1076–84. · DOI
- Hernandez-Rapp J, Rainone S, Goupil C, Dorval V, Smith PY, Saint-Pierre M, et al. microRNA-132/212 deficiency enhances Aβ production and senile plaque deposition in Alzheimer’s disease triple transgenic mice. Sci Rep. 2016;6(1):30953. · DOI
- Deng Y, Zhang J, Sun X, Ma G, Luo G, Miao Z, et al. miR-132 improves the cognitive function of rats with Alzheimer's disease by inhibiting the MAPK1 signal pathway. Exp Ther Med. 2020;20(6):1–1. · DOI
- Zhang W, Yang Y, Xiang Z, Cheng J, Yu Z, Wang W, et al. MRTF-A-mediated protection against amyloid-β-induced neuronal injury correlates with restoring autophagy via miR-1273g-3p/mTOR axis in Alzheimer models. Aging (Albany NY). 2022;14(10):4305. · DOI
- Higaki S, Muramatsu M, Matsuda A, Matsumoto K, Satoh J-i, Michikawa M, et al. Defensive effect of microRNA-200b/c against amyloid-beta peptide-induced toxicity in Alzheimer's disease models. PLoS One. 2018;13(5):e0196929. · DOI
- Ye X, Luo H, Chen Y, Wu Q, Xiong Y, Zhu J, et al. MicroRNAs 99b-5p/100-5p regulated by endoplasmic reticulum stress are involved in abeta-induced pathologies. Front Aging Neurosci. 2015;7:210. · DOI
- Liang C, Mu Y, Tian H, Wang D, Zhang S, Wang H, et al. MicroRNA-140 silencing represses the incidence of Alzheimer's disease. Neurosci Lett. 2021;758:135674. · DOI · Paper page
- Angelucci F, Cechova K, Valis M, Kuca K, Zhang B, Hort J. MicroRNAs in Alzheimer’s disease: diagnostic markers or therapeutic agents? Front Pharmacol. 2019;10:665. · DOI
- Liu S, Fan M, Zheng Q, Hao S, Yang L, Qi C, et al. MicroRNAs in Alzheimer's disease: potential diagnostic markers and therapeutic targets. Biomed Pharmacother. 2022;148:112681. · DOI
Cited by
Sorted by citations
A role for astrocytic miR-129-5p in frontotemporal dementia
Kaurani, L., Pradhan, R., Schröder, S., Burkhardt, S., Schuetz, A.-L., Krüger, D. M., Pena, T., Heutink, P., Sananbenesi, F., & Fischer, A. (2025) · Translational Psychiatry · doi:10.1038/s41398-025-03338-y · Cited by 10
Metadata
- Authors
- Han, S.-W., Pyun, J.-M., Bice, P. J., Bennett, D. A., Saykin, A. J., Kim, S. Y., Park, Y. H., & Nho, K.
- Venue
- Alzheimer's Research & Therapy
- Published
- 2024-01-09
- Volume
- 16
- Issue
- 1
- ISSN
- 1758-9193
- PMC
- PMC10775662
- Cited by
- 33
- References
- 11
- Language
- en
About these checks
Registry, retraction, Cites and statistics results are computed, not judged, with one exception: a printed reference that no index lists is read once by a model before it counts as a citation error. Claims are extracted by a model and kept only when their quote appears verbatim in the text; each cited source is then checked, with a model’s help, for whether it says what the claim relies on. Those verdicts can be wrong — read the claim’s quote and the cited source before relying on one.
Statistics and arithmetic are recomputed, not judged.
Confidence bands are shown only for fields calibrated on our annotated test set. None is calibrated yet, so no band is shown.
What counts as a claim ›How we measure confidence ›How we check this ›
Are you an author, or do you see a problem with this page? Request a review
