

The DOI matches its Crossref record; 44 of the 44 references it cites were found in a registry or an index; 25 of the 65 sources its claims cite were checked for support.
Impact of zervimesine on the neuroinflammatory biomarker GFAP and related proteomic molecular correlates in plasma of participants from a phase 2 clinical trial in Alzheimer’s disease
Open accessAbstract
Background: Zervimesine (CT1812) is an investigational brain-penetrant small molecule modulator of the sigma-2 receptor (S2R/ TMEM97 ), currently in clinical development for the treatment of Alzheimer’s disease (AD) and dementia with Lewy bodies (DLB) that selectively prevents and displaces the binding of amyloid beta (Aβ) and α-synuclein oligomers from neuronal synapses. Given the mechanism of action, it was hypothesized that zervimesine might be more effective in patients with lower levels of AD pathology. Indeed, in the SHINE trial, a completed Phase 2, randomized, double-blind, clinical trial conducted in participants with AD, a robust, 95%, slowing of cognitive decline, as assessed via ADAS-Cog11, was observed in a pre-specified subgroup of participants with lesser AD pathology (i.e., low p-tau217 subgroup) compared to a 38% slowing in the overall modified intent-to-treat (mITT)) population. Methods: In SHINE, exploratory plasma biomarkers were assessed using both a targeted and an unbiased, proteomics discovery approach in plasma from participants at baseline and end of study. Treatment effects of zervimesine relative to placebo were assessed in both the mITT population and in a low p-tau217 subgroup, who entered the study with lower (< 1pg/ml) plasma p-tau217 concentrations. Plasma biomarkers Aβ40, Aβ42, GFAP, NfL and BD-tau were assessed using clinically validated targeted assays, along with untargeted TMT-mass spectrometry (MS)-based discovery proteomics followed by bioinformatic, pathway and correlation analyses. Results: Collectively, plasma biomarker findings in the low p-tau217 subgroup were more robust than in the mITT population. Levels of GFAP were significantly decreased and NfL, Aβ42 and Aβ40 levels trended towards a decrease with zervimesine compared to placebo. Proteomics analyses identified candidate pharmacodynamic biomarkers of zervimesine, and gene ontology and pathway analyses pointed to an impact on amyloid biology, trafficking, lipid metabolism, and immune response. Bioinformatics and correlation analyses with GFAP identified biomarkers that may reflect pathway engagement of S2R and/or decreased neuroinflammation. Conclusions: Exploratory plasma biomarker findings align with the degree of clinical benefit in SHINE mITT and low p-tau217 populations, and support future trial enrichment with patients with lower levels of pathology as defined by lower baseline plasma levels of p-tau217. Trial registration: July 20th, 2018 ClinicalTrials.gov Identifier NCT03507790 https://clinicaltrials.gov/study/NCT03507790 .
Overview
AI snapshot
Written from the paper’s full text.
TL;DR
In the SHINE Phase 2 trial, exploratory plasma biomarker and proteomic analyses showed that zervimesine treatment effects were more robust in participants with low baseline plasma p-tau217 (<1 pg/ml) than in the overall mITT population. In that low p-tau217 subgroup, plasma GFAP significantly decreased with zervimesine versus placebo, with trends toward decreases in Aβ42, Aβ40, and NfL.
Key findings
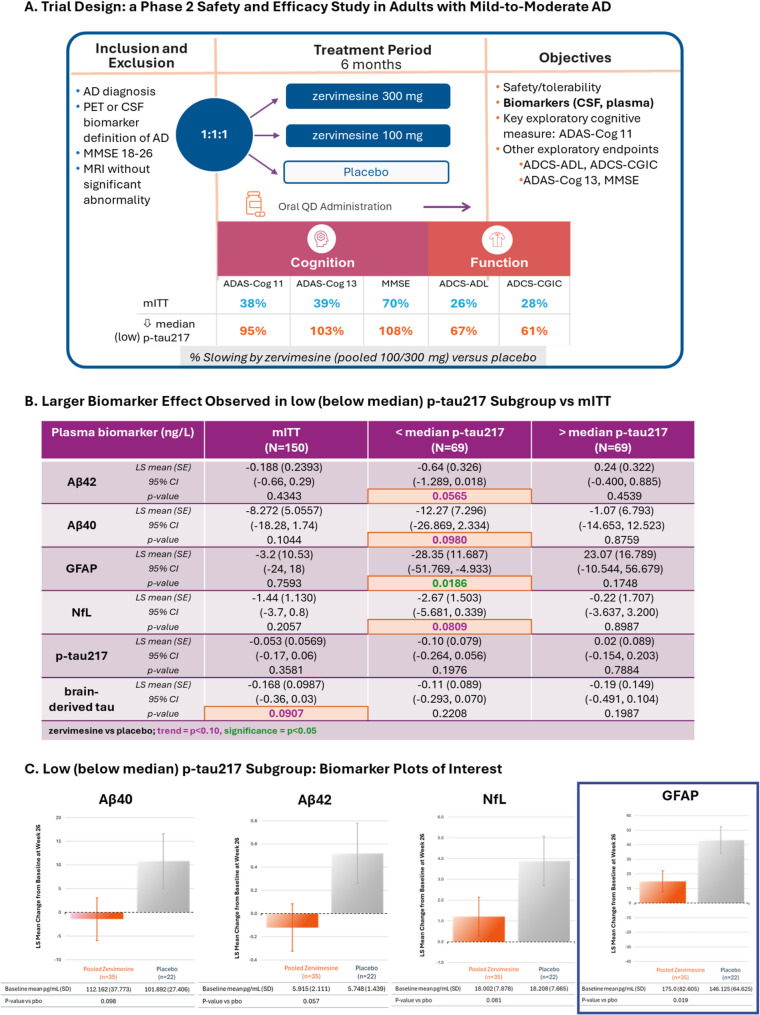
- In the low p-tau217 subgroup, zervimesine significantly decreased plasma GFAP versus placebo (LS mean −28.35; SE 11.687; p = 0.0186), with trends (p ≤ 0.10) toward reductions in Aβ42, Aβ40, and NfL; no treatment effects or trends were observed in the high p-tau217 subgroup (N = 60).
- In the mITT population, only plasma BD-tau showed a trend toward reduction versus placebo (p = 0.09); no treatment-related changes were observed in GFAP, NfL, Aβ42, or Aβ40, and no change was seen in Aβ42/40 ratio (LS mean 0.0019; SE 0.00148; p = 0.2048).
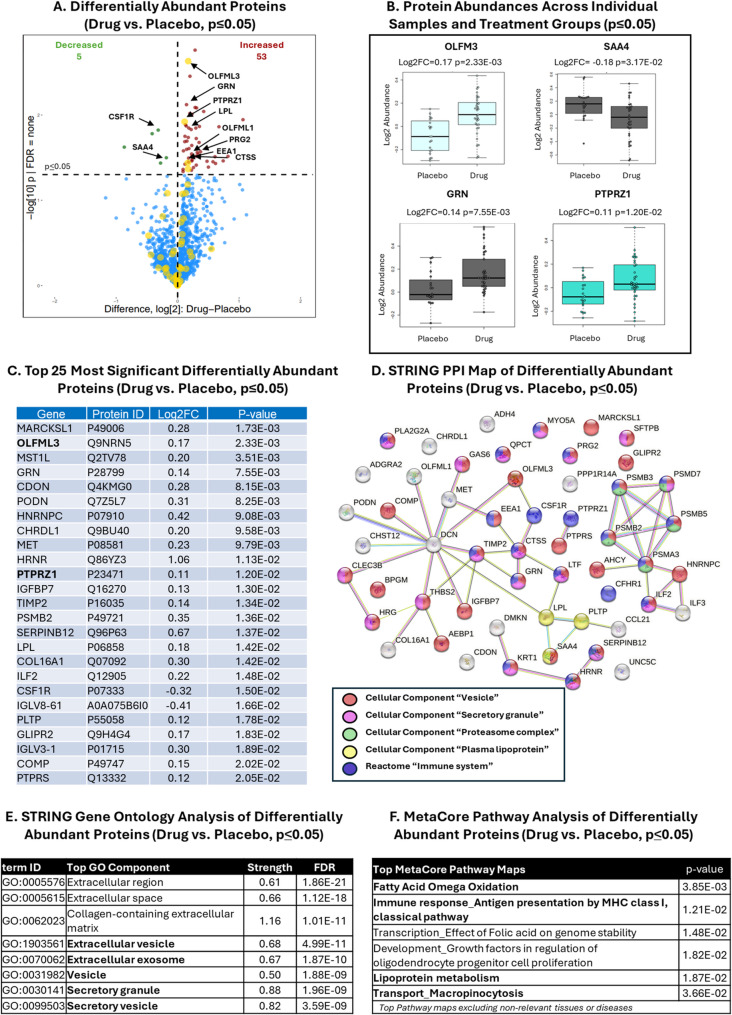
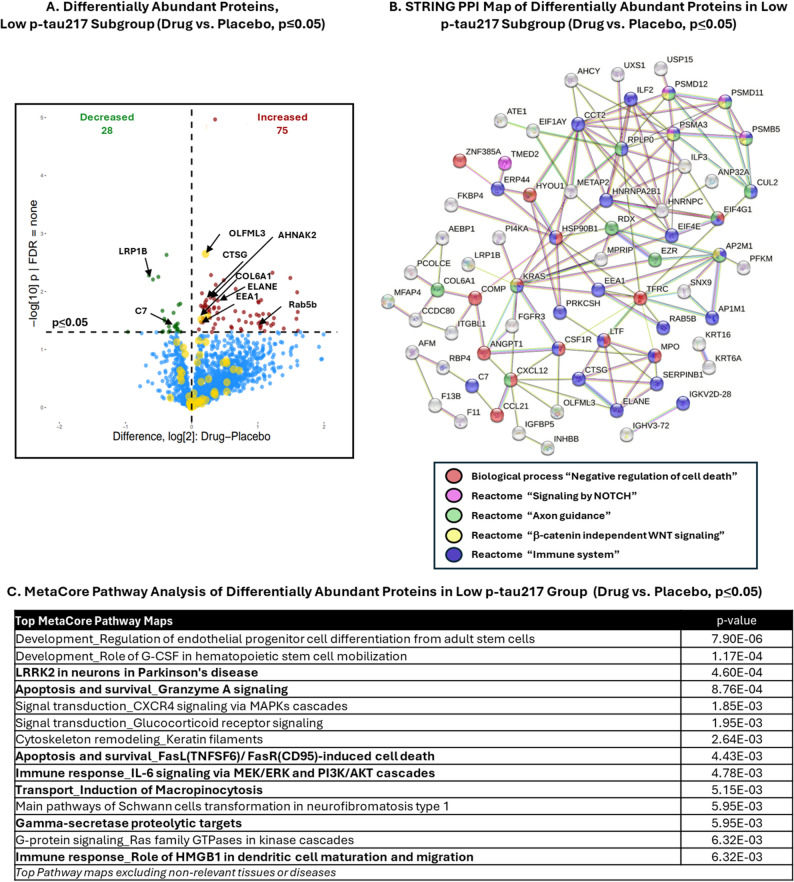
- TMT-MS proteomics detected more than 2000 proteins in mITT plasma; 58 proteins were significantly differentially abundant with zervimesine (53 increased, 5 decreased; p ≤ 0.05), while 103 were differentially abundant in the low p-tau217 subgroup (75 increased, 28 decreased; p ≤ 0.05). Pathway analyses implicated amyloid biology, trafficking, lipid metabolism, and immune response.
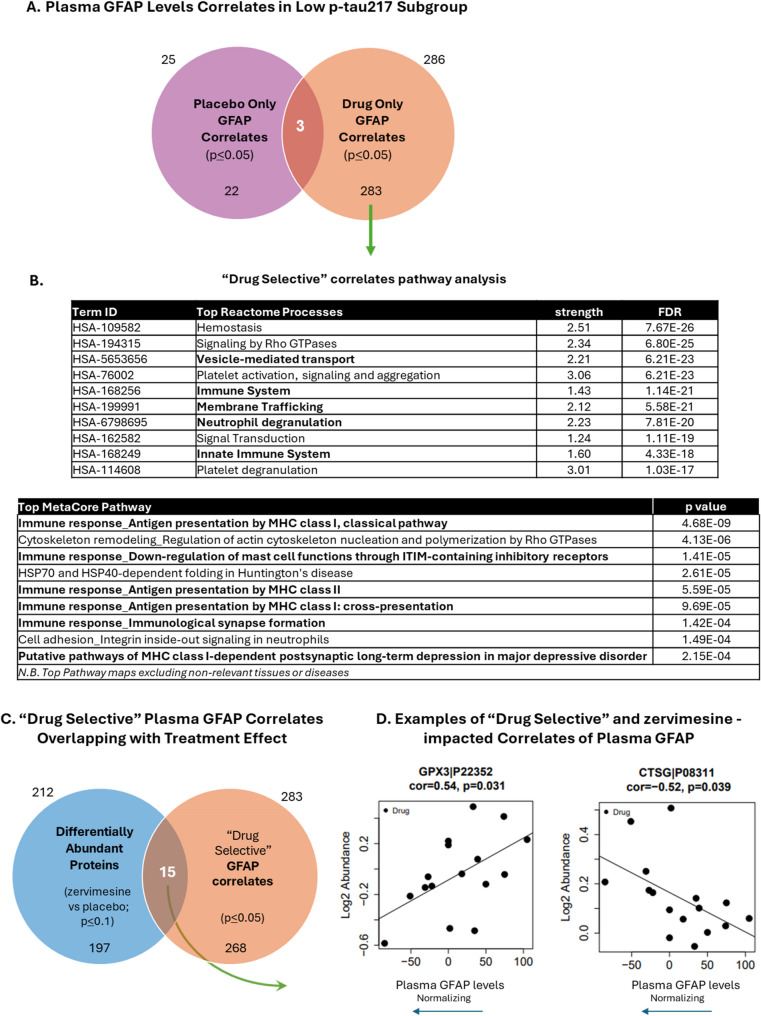
- In the low p-tau217 subgroup, 286 TMT-MS proteins correlated with plasma GFAP in zervimesine-treated participants; after removing 3 shared with placebo, 283 “Drug Selective” correlates remained, and 15 of these were also differentially abundant (zervimesine vs placebo, p ≤ 0.10), including GPX3 and CTSG.
Methods
- SHINE (NCT03507790) was a completed international, multicenter, randomized, double-blind, placebo-controlled 36-week Phase 2 trial in adults aged 50–85 years with mild to moderate AD (MMSE 18–26); participants were randomized 1:1:1 to placebo, 100 mg, or 300 mg zervimesine orally once daily for 6 months. Plasma biomarker analyses included participants with baseline and 6-month plasma (mITT N = 117; low p-tau217 subgroup N = 57; high p-tau217 subgroup N = 60), with p-tau217 subgroups defined by baseline plasma p-tau217 below versus at/above the median of 1.0 pg/ml.
- Targeted plasma biomarkers Aβ40, Aβ42, GFAP, and NfL were measured with the SIMOA Neuro4-Plex E Kit, and brain-derived tau with a SIMOA-based assay; change from baseline was calculated.
- Untargeted discovery proteomics used TMT-MS on the first 57 treatment-compliant participants (n = 20 placebo, n = 37 pooled zervimesine) with baseline and 6-month plasma; low p-tau217 subgroup N = 24 (n = 8 placebo, n = 16 zervimesine). Differential abundance was assessed by ANOVA with unadjusted p ≤ 0.05, followed by GO, STRING, MetaCore pathway analyses, and Pearson correlation of protein change from baseline with plasma GFAP change from baseline in the low p-tau217 subgroup.
Limitations
- The paper states limited sample size, with even smaller subgroups, which may affect differential abundance analysis and lead to false positives or negatives.
- The paper states that proteomics differential abundance and correlation analyses used unadjusted p-values without controlling for multiple comparisons, increasing type 1 error risk; candidate biomarkers should be viewed with caution until replicated.
- The paper states that the p-tau217 subgroup analysis was prespecified but not the primary analysis, and that plasma biomarkers may reflect peripheral changes rather than brain-relevant disease processes; replication in larger trials is warranted.
Model-written summary. Check it against the paper before relying on it.
Integrity signals
Registry
Cites
Statistics
Figures
Verification
Claims the paper makes
38 Own result · 20 Own interpretation · 19 Not checked yet · 13 Partly supported · 7 Own method · 4 No full text of the sources · 4 No basis given · 2 Supported · accuracy not yet measured
Every source the paper cites for this claim was checked and supports it.
In the paper
“preclinical studies have shown that zervimesine can displace toxic Aβ oligomers from binding to neuronal synapses.”
§ Impact of zervimesine on the neuroinflammatory biomarker GFAP and related proteomic molecular correlates in plasma of participants from a phase 2 clinical trial in Alzheimer’s disease > Background
What the sources say
- Supportedcites [1] Izzo NJ, Yuede CM, LaBarbera KM, Limegrover CS, Rehak C, Yurko R, et al. Preclinical and clinical biomarker studies of CT1812: a novel approach to Alzheimer’s disease modification. Alzheimers Dement. 2021;17:1365–82. https://doi.org/10.1002/alz.12302. source
The Results section (Figure 2; page not provided) reports that CT1812 displaced bound Aβ oligomers from neuronal receptors in cultured neurons. The Discussion likewise states that CT1812 displaces already-bound oligomers and prevents their binding to neuronal synaptic receptors. These preclinical findings support the claim about zervimesine (CT1812). (LLM, conf=0.91)
plaindirect- Asserted: passes — The authors put it forward as true.
- Checkable: passes — It can be checked against evidence.
- Load-bearing: passes — The paper’s conclusions depend on it.
- Based: passes — The paper gives a reason why it holds.
- Supported
The cited sources support only part of this claim — read each source’s verdict below.
In the paper
“These exploratory analyses supported an impact of zervimesine on AD pathophysiology [1, 36, 39, 40] including amyloid biology, synaptic function [4–6], inflammation and lipoprotein-related biological processes [5, 6, 41]”
§ Impact of zervimesine on the neuroinflammatory biomarker GFAP and related proteomic molecular correlates in plasma of participants from a phase 2 clinical trial in Alzheimer’s disease > Discussion
What the sources say
- Supportedcites [1] Izzo NJ, Yuede CM, LaBarbera KM, Limegrover CS, Rehak C, Yurko R, et al. Preclinical and clinical biomarker studies of CT1812: a novel approach to Alzheimer’s disease modification. Alzheimers Dement. 2021;17:1365–82. https://doi.org/10.1002/alz.12302. source
The Results section (page not available in our copy) reports exploratory CSF biomarker changes in CT1812-treated patients involving Aβ oligomers and synaptic proteins. Its CSF proteomics analysis also identifies AD-related changes in complement and cholesterol-transport proteins, supporting the claim’s references to inflammation and lipoprotein-related processes. The paper presents these as supporting evidence, not proof of clinical benefit. (LLM, conf=0.89)
- Partly supportedcites [36] Colom-Cadena M, Toombs J, Simzer E, Holt K, McGeachan R, Tulloch J, et al. Transmembrane protein 97 is a potential synaptic amyloid beta receptor in human Alzheimer’s disease. Acta Neuropathol. 2024;147:32. https://doi.org/10.1007/s00401-023-02679-6. sourceExperimental — accuracy not yet measured
The Results section (page unavailable) reports that CT1812 altered pathways important for synaptic function in human iPSC-derived neurons, supporting the synaptic-function portion cited to this paper. The paper does not report exploratory CSF analyses, so it cannot substantiate the claim that those analyses showed this effect. (LLM, conf=0.85)
- Could not verifycites [39] Izzo NJ, Staniszewski A, To L, Fa M, Teich AF, Saeed F, et al. Alzheimer’s therapeutics targeting amyloid beta 1–42 oligomers I: abeta 42 oligomer binding to specific neuronal receptors is displaced by drug candidates that improve cognitive deficits. PLoS One. 2014;9:e111898. https://doi.org/10.1371/journal.pone.0111898. sourceExperimental — accuracy not yet measured
The Results sections on compound screening and anti-Abeta effects describe candidate drugs tested in neuronal cultures and mice, not exploratory CSF analyses of zervimesine. Our copy does not identify zervimesine or report its effects on the biological processes claimed (searched: zervimesine, CT1812, CSF, inflammation, and lipoproteins). (LLM, conf=0.75)
- Partly supportedcites [40] Izzo NJ, Xu J, Zeng C, Kirk MJ, Mozzoni K, Silky C, et al. Alzheimer’s therapeutics targeting amyloid beta 1–42 oligomers II: sigma-2/PGRMC1 receptors mediate abeta 42 oligomer binding and synaptotoxicity. PLoS One. 2014;9:e111899. https://doi.org/10.1371/journal.pone.0111899. sourceExperimental — accuracy not yet measured
The Results section on endogenous Aβ oligomers reports that CT01344 displaced oligomers from postmortem AD brain sections, supporting a related effect on amyloid biology. The paper does not report exploratory CSF analyses or identify an effect of zervimesine on the listed biological processes; its experiments cannot establish that broader claim. (LLM, conf=0.83)
plaindirect- Asserted: passes — The authors put it forward as true.
- Checkable: passes — It can be checked against evidence.
- Load-bearing: unclear — It is unclear whether the paper’s conclusions depend on it.
- Based: passes — The paper gives a reason why it holds.
- Supported
The cited sources support only part of this claim — read each source’s verdict below.
In the paper
“clinical proof of mechanism was seen in a small, single-dose clinical trial in AD patients where after a single dose of zervimesine, levels of Aβ oligomers rose over the 24 h period assessed [2].”
§ Impact of zervimesine on the neuroinflammatory biomarker GFAP and related proteomic molecular correlates in plasma of participants from a phase 2 clinical trial in Alzheimer’s disease > Background
What the sources say
- Partly supportedcites [2] LaBarbera KM, Sheline YI, Izzo NJ, Yuede CM, Waybright L, Yurko R, et al. A phase 1b randomized clinical trial of CT1812 to measure Aβ oligomer displacement in Alzheimer’s disease using an indwelling CSF catheter. Transl Neurodegener. 2023;12:10–3. https://doi.org/10.1186/s40035-023-00358-w. sourceExperimental — accuracy not yet measured
The trial description and Fig. 1 report a small, single-dose study in patients with AD in which CSF Aβ oligomer levels rose over 24 hours in the two treated patients. Our copy calls the treatment CT1812; it does not establish that zervimesine is the same drug. (LLM, conf=0.85)
plaindirect- Asserted: passes — The authors put it forward as true.
- Checkable: passes — It can be checked against evidence.
- Load-bearing: passes — The paper’s conclusions depend on it.
- Based: passes — The paper gives a reason why it holds.
- Partly supported
The cited sources support only part of this claim — read each source’s verdict below.
In the paper
“A growing number of studies – with lecanemab and donanemab – are finding that the earlier stage of disease and/or the AD pathology, the greater the effect size in clinical benefit [14–17].”
§ Impact of zervimesine on the neuroinflammatory biomarker GFAP and related proteomic molecular correlates in plasma of participants from a phase 2 clinical trial in Alzheimer’s disease > Background
What the sources say
- Partly supportedcites [14] Ashton NJ, Brum WS, Molfetta GD, Benedet AL, Arslan B, Jonaitis E, et al. Diagnostic accuracy of a plasma phosphorylated tau 217 immunoassay for Alzheimer disease pathology. JAMA Neurol. 2024;81:255–63. https://doi.org/10.1001/jamaneurol.2023.5319. sourceExperimental — accuracy not yet measured
The Discussion says antiamyloid therapies may be less effective in patients with advanced tau pathology, supporting a possible link between pathology stage and benefit. It does not report clinical-benefit effect sizes for lecanemab or donanemab, or establish the broader claim that earlier disease stage yields greater benefit. (LLM, conf=0.84)
- Not checked — no full text of the sourcecites [15] Mintun MA, Wessels AM, Sims JR. Donanemab in early Alzheimer’s disease. N Engl J Med. 2021;385:666–7. https://doi.org/10.1056/NEJMc2109455. source
- Not checked — no full text of the sourcecites [16] Vasudeva R, Doty E, Yang F, Evans C, Zimmer J, Lu M, et al. The Importance of Early Recognition and Treatment Initiation for Managing Alzheimer’s disease: Subpopulation Analysis of the TRAILBLAZER-ALZ 2 Randomized Trial (S23.005). Neurology. 2025;104. https://doi.org/10.1212/WNL.0000000000210512. source
- Not matchedcites [17] Sperling RA, Selkoe DJ, Reyderman L, Cao Y, van Dyck CH. Does the Current Evidence Base Support Lecanemab Continued Dosing for Early Alzheimer’s Disease? [Perspectives Session]. Alzheimer’s Assoc Int Conf. Philadelphia, PA; 2024.
Couldn’t be matched to a paper in Crossref, so it can’t be checked.
hedgedcorrelational- Asserted: passes — The authors put it forward as true.
- Checkable: passes — It can be checked against evidence.
- Load-bearing: passes — The paper’s conclusions depend on it.
- Based: passes — The paper gives a reason why it holds.
- Partly supported
The cited sources support only part of this claim — read each source’s verdict below.
In the paper
“Reduction of plasma GFAP in zervimesine-treated participants compared to control is consistent with the potential effects of zervimesine in modulating inflammatory or immune response pathways”
§ Impact of zervimesine on the neuroinflammatory biomarker GFAP and related proteomic molecular correlates in plasma of participants from a phase 2 clinical trial in Alzheimer’s disease > Discussion
What the sources say
- Partly supportedcites [5] Lizama BN, Williams C, North HA, Pandey K, Duong D, Di Caro V, et al. CT1812 biomarker signature from a meta-analysis of CSF proteomic findings from two Phase 2 clinical trials in Alzheimer’s disease. Alzheimers Dement. 2024;20:6860–80. https://doi.org/10.1002/alz.14152. sourceExperimental — accuracy not yet measured
The Results section reports CT1812-associated CSF protein networks enriched for immune-response and phagocytic pathways, supporting the proposed pathway connection. However, this paper analyzes CSF proteomics and does not report a reduction in plasma GFAP in treated participants compared with controls (searched: GFAP, plasma, zervimesine). Page numbers were not available in our copy. (LLM, conf=0.86)
- Not checked — no full text of the sourcecites [6] Lizama BN, North HA, Pandey K, Williams C, Duong D, Cho E, et al. An interim exploratory proteomics biomarker analysis of a phase 2 clinical trial to assess the impact of CT1812 in Alzheimer’s disease. Neurobiol Dis. 2024;199:106575. https://doi.org/10.1016/j.nbd.2024.106575. source
hedgedconditional- Asserted: passes — The authors put it forward as true.
- Checkable: passes — It can be checked against evidence.
- Load-bearing: passes — The paper’s conclusions depend on it.
- Based: passes — The paper gives a reason why it holds.
- Partly supported
The cited sources support only part of this claim — read each source’s verdict below.
In the paper
“pathway analyses of the plasma GFAP level correlates identified GO terms like “Vesicle-mediated transport”, “Membrane Trafficking” and immune system related pathways, pathways that were corrected for multiple comparisons (FDR ≤ 0.05)”
§ Impact of zervimesine on the neuroinflammatory biomarker GFAP and related proteomic molecular correlates in plasma of participants from a phase 2 clinical trial in Alzheimer’s disease > Discussion
What the sources say
- Partly supportedcites [48] Reimand J, Isserlin R, Voisin V, Kucera M, Tannus-Lopes C, Rostamianfar A, et al. Pathway enrichment analysis and visualization of omics data using g:Profiler, GSEA, Cytoscape and EnrichmentMap. Nat Protoc. 2019;14:482–517. https://doi.org/10.1038/s41596-018-0103-9. sourceExperimental — accuracy not yet measured
The Procedure sections on pathway enrichment and examination of GSEA results describe multiple-testing-adjusted Q values and recommend an FDR cutoff of Q < 0.05. They do not report an analysis of plasma GFAP correlates or identify vesicle transport, membrane trafficking, or immune pathways as its results. Page numbers are unavailable in our copy. (LLM, conf=0.85)
plaincorrelational- Asserted: passes — The authors put it forward as true.
- Checkable: passes — It can be checked against evidence.
- Load-bearing: unclear — It is unclear whether the paper’s conclusions depend on it.
- Based: passes — The paper gives a reason why it holds.
- Partly supported
A result the paper reports from its own data — it cites no other source for it, so there is none to check. The quote shows it is in the paper.
In the paper
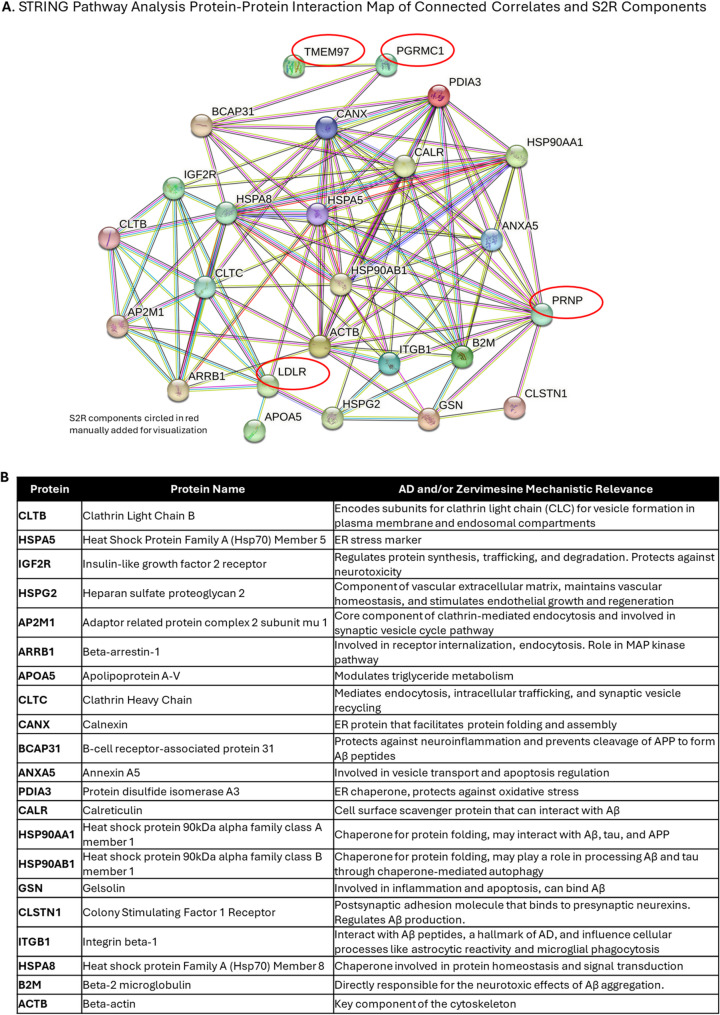
“B Table of the 21 correlates with plasma GFAP levels found to interact with the S2R complex components and their known biological functions relevant to AD or the zervimesine mechanism of action through S2R”
§ Impact of zervimesine on the neuroinflammatory biomarker GFAP and related proteomic molecular correlates in plasma of participants from a phase 2 clinical trial in Alzheimer’s disease > Results > Zervimesine-impacted plasma proteins correlated with plasma GFAP levels
plaincorrelational- Asserted: passes — The authors put it forward as true.
- Checkable: passes — It can be checked against evidence.
- Load-bearing: unclear — It is unclear whether the paper’s conclusions depend on it.
- Based: passes — The paper gives a reason why it holds.
A result the paper reports from its own data — it cites no other source for it, so there is none to check. The quote shows it is in the paper.
In the paper
“Decrease of CSF NfL levels in the SHINE zervimesine-treated participants further underlines the role of zervimesine in slowing neurodegeneration.”
§ Impact of zervimesine on the neuroinflammatory biomarker GFAP and related proteomic molecular correlates in plasma of participants from a phase 2 clinical trial in Alzheimer’s disease > Discussion
plaindirect- Asserted: passes — The authors put it forward as true.
- Checkable: passes — It can be checked against evidence.
- Load-bearing: passes — The paper’s conclusions depend on it.
- Based: passes — The paper gives a reason why it holds.
A result the paper reports from its own data — it cites no other source for it, so there is none to check. The quote shows it is in the paper.
In the paper
“In participants treated with zervimesine, a total of 286 TMT-MS-detected plasma proteins were found to be significantly (p ≤ 0.05) correlated with plasma GFAP levels”
§ Impact of zervimesine on the neuroinflammatory biomarker GFAP and related proteomic molecular correlates in plasma of participants from a phase 2 clinical trial in Alzheimer’s disease > Results > Zervimesine-impacted plasma proteins correlated with plasma GFAP levels
plaincorrelationaln = 16 ·- Asserted: passes — The authors put it forward as true.
- Checkable: passes — It can be checked against evidence.
- Load-bearing: passes — The paper’s conclusions depend on it.
- Based: passes — The paper gives a reason why it holds.
A result the paper reports from its own data — it cites no other source for it, so there is none to check. The quote shows it is in the paper.
In the paper
“In the low p-tau217 subgroup, a statistically significant decrease in the neuroinflammatory marker GFAP (zervimesine vs. placebo; LS mean −28.35; SE 11.687; p = 0.0186) was observed”
§ Impact of zervimesine on the neuroinflammatory biomarker GFAP and related proteomic molecular correlates in plasma of participants from a phase 2 clinical trial in Alzheimer’s disease > Results > Impact of zervimesine treatment on canonical plasma biomarkers using targeted assays
plaindirectn = 57 ·- Asserted: passes — The authors put it forward as true.
- Checkable: passes — It can be checked against evidence.
- Load-bearing: passes — The paper’s conclusions depend on it.
- Based: passes — The paper gives a reason why it holds.
- Probably not a substantial claim. 19
- It may state two separate claims as one. 28
- The quote only partly states this claim. 3
The cited sources support only part of this claim — read each source’s verdict below.
In the paper
“reports of findings from the subgroup analysis of phase 3 trial TRAILBLAZER-ALZ2 suggest that donanemab is more effective in participants with less cognitive impairment and lower tau burden [16, 18].”
§ Impact of zervimesine on the neuroinflammatory biomarker GFAP and related proteomic molecular correlates in plasma of participants from a phase 2 clinical trial in Alzheimer’s disease > Background
What the sources say
- Not checked — no full text of the sourcecites [16] Vasudeva R, Doty E, Yang F, Evans C, Zimmer J, Lu M, et al. The Importance of Early Recognition and Treatment Initiation for Managing Alzheimer’s disease: Subpopulation Analysis of the TRAILBLAZER-ALZ 2 Randomized Trial (S23.005). Neurology. 2025;104. https://doi.org/10.1212/WNL.0000000000210512. source
- Partly supportedcites [18] Sims JR, Zimmer JA, Evans CD, Lu M, Ardayfio P, Sparks J, et al. Donanemab in Early Symptomatic Alzheimer Disease: The TRAILBLAZER-ALZ 2 Randomized Clinical Trial. JAMA. 2023;330:512–27. https://doi.org/10.1001/jama.2023.13239. sourceExperimental — accuracy not yet measured
The Discussion reports greater benefit in the low/medium-tau group than in the high-tau group and says this supports a hypothesis of greater benefit when treatment starts earlier. But the Subgroup Analyses section says outcomes were generally consistent across baseline-characteristic subgroups; our copy does not establish greater efficacy specifically among participants with less cognitive impairment. (LLM, conf=0.82)
hedgedconditional- Asserted: passes — The authors put it forward as true.
- Checkable: passes — It can be checked against evidence.
- Load-bearing: passes — The paper’s conclusions depend on it.
- Based: passes — The paper gives a reason why it holds.
Probably not a substantial claim.
The cited sources support only part of this claim — read each source’s verdict below.
In the paper
“p-tau217 was selected for this substudy as it is an extensively validated to be an excellent indicator of degree of amyloid as assessed via CSF analysis and amyloid PET, and tau levels as assessed via tau PET [9, 13, 14, 32]”
§ Impact of zervimesine on the neuroinflammatory biomarker GFAP and related proteomic molecular correlates in plasma of participants from a phase 2 clinical trial in Alzheimer’s disease > Discussion
What the sources say
- Partly supportedcites [9] Mattsson-Carlgren N, Collij LE, Stomrud E, Pichet Binette A, Ossenkoppele R, Smith R, et al. Plasma biomarker strategy for selecting patients with Alzheimer disease for antiamyloid immunotherapies. JAMA Neurol. 2024;81:69–78. https://doi.org/10.1001/jamaneurol.2023.4596. sourceExperimental — accuracy not yet measured
The Abstract and Discussion (page numbers unavailable) report that plasma p-tau217 predicts amyloid positivity defined by CSF or PET and identifies patients likely to have high tau-PET burden; the Discussion also cites prior supporting studies. The paper evaluates amyloid status and categories of tau burden, not how accurately p-tau217 indicates the quantitative degree of amyloid or tau levels across their ranges. (LLM, conf=0.85)
- Partly supportedcites [13] Mattsson-Carlgren N, Janelidze S, Bateman RJ, Smith R, Stomrud E, Serrano GE, et al. Soluble P-tau217 reflects amyloid and tau pathology and mediates the association of amyloid with tau. EMBO Mol Med. 2021;13:e14022. https://doi.org/10.15252/emmm.202114022. sourceExperimental — accuracy not yet measured
The Results section reports that plasma p-tau217 was significantly associated with both amyloid PET and tau PET measures, supporting those parts of the claim. This paper does not establish its performance against amyloid measured by CSF analysis; the Introduction discusses CSF biomarkers but does not provide that comparison. Its PET findings also vary by disease stage, so “excellent indicator” is broader than the reported associations. (LLM, conf=0.86)
- Partly supportedcites [14] Ashton NJ, Brum WS, Molfetta GD, Benedet AL, Arslan B, Jonaitis E, et al. Diagnostic accuracy of a plasma phosphorylated tau 217 immunoassay for Alzheimer disease pathology. JAMA Neurol. 2024;81:255–63. https://doi.org/10.1001/jamaneurol.2023.5319. sourceExperimental — accuracy not yet measured
The Results section, “Accuracy in Discriminating Abnormal Aβ and Tau Pathologies” (page unavailable), reports high accuracy for identifying abnormal amyloid by CSF and amyloid PET and abnormal tau by tau PET across the studied cohorts. It also reports increasing plasma p-tau217 across tau-PET–defined Braak stages. The evidence is strongest for distinguishing abnormal from normal pathology, rather than for the claimed measurement of the degree of amyloid and tau pathology by each method. (LLM, conf=0.82)
- Partly supportedcites [32] Devanarayan V, Charil A, Horie K, Doherty T, Llano DA, Andreozzi E, et al. Plasma pTau217 ratio predicts continuous regional brain tau accumulation in amyloid-positive early Alzheimer’s disease. Alzheimers Dement. 2025;21:e14411. https://doi.org/10.1002/alz.14411. sourceExperimental — accuracy not yet measured
The Background reports that plasma pTau217R reflects brain amyloid and tau pathology and cites prior findings that it predicts continuous amyloid levels. The Abstract Results report that a pTau217R-based model predicts tau levels measured by PET in amyloid-positive early AD. Our copy does not establish the claimed validation against CSF amyloid measurements, and its findings concern the pTau217 ratio rather than p-tau217 generally. (LLM, conf=0.86)
boostedcorrelational- Asserted: passes — The authors put it forward as true.
- Checkable: passes — It can be checked against evidence.
- Load-bearing: passes — The paper’s conclusions depend on it.
- Based: passes — The paper gives a reason why it holds.
It may state two separate claims as one.
- Partly supported
The cited sources support only part of this claim — read each source’s verdict below.
In the paper
“plasma GFAP is a sensitive biomarker for detecting reactive astrogliosis, a hallmark of neuroinflammation, as well as Aβ pathology, even in early stages of AD [33].”
§ Impact of zervimesine on the neuroinflammatory biomarker GFAP and related proteomic molecular correlates in plasma of participants from a phase 2 clinical trial in Alzheimer’s disease > Discussion
What the sources say
- Partly supportedcites [33] Benedet AL, Milà-Alomà M, Vrillon A, Ashton NJ, Pascoal TA, Lussier F, et al. Differences between plasma and cerebrospinal fluid glial fibrillary acidic protein levels across the Alzheimer disease continuum. JAMA Neurol. 2021;78:1471. https://doi.org/10.1001/jamaneurol.2021.3671. sourceExperimental — accuracy not yet measured
The Introduction calls blood GFAP a reactive-astrogliosis biomarker, and the Results and Discussion support plasma GFAP as an early indicator of Aβ pathology. However, the Results section on neuroinflammation found that plasma GFAP, unlike CSF GFAP, was not associated with the other glial biomarkers tested. The paper therefore does not establish plasma GFAP as a sensitive detector of neuroinflammation generally. (LLM, conf=0.86)
plaincorrelational- Asserted: passes — The authors put it forward as true.
- Checkable: passes — It can be checked against evidence.
- Load-bearing: passes — The paper’s conclusions depend on it.
- Based: passes — The paper gives a reason why it holds.
It may state two separate claims as one.
- Partly supported
The cited sources support only part of this claim — read each source’s verdict below.
In the paper
“the oligomer receptor prion protein, PrPC, not only binds TMEM97 (S2R) [36], it is also known to bind amyloid precursor protein (APP) [37]”
§ Impact of zervimesine on the neuroinflammatory biomarker GFAP and related proteomic molecular correlates in plasma of participants from a phase 2 clinical trial in Alzheimer’s disease > Discussion
What the sources say
- Partly supportedcites [36] Colom-Cadena M, Toombs J, Simzer E, Holt K, McGeachan R, Tulloch J, et al. Transmembrane protein 97 is a potential synaptic amyloid beta receptor in human Alzheimer’s disease. Acta Neuropathol. 2024;147:32. https://doi.org/10.1007/s00401-023-02679-6. sourceExperimental — accuracy not yet measured
The Results section reports a FRET signal between TMEM97 and PrPC in human postsynapses, supporting close proximity. The Discussion treats a direct interaction as possible, but the FRET finding does not establish that PrPC binds TMEM97. The APP-binding clause has a separate citation [37] and is not assessed against this source. (LLM, conf=0.86)
- Supportedcites [37] Miranzadeh Mahabadi H, Taghibiglou C. Cellular prion protein (PrPc): putative interacting partners and consequences of the interaction. Int J Mol Sci. 2020;21:7058. https://doi.org/10.3390/ijms21197058. source
This source is cited for the APP-binding clause [37], not the TMEM97 clause [36]. Section 4.3, “Alzheimer’s Disease-Related Proteins,” says that the association of PrPC and APP was validated by co-immunoprecipitation. (LLM, conf=0.94)
boostedcorrelational- Asserted: passes — The authors put it forward as true.
- Checkable: passes — It can be checked against evidence.
- Load-bearing: passes — The paper’s conclusions depend on it.
- Based: passes — The paper gives a reason why it holds.
It may state two separate claims as one.
- Partly supported
The cited sources support only part of this claim — read each source’s verdict below.
In the paper
“The level of plasma p-tau217 is correlated with amyloid and tau pathology on PET imaging and has proven useful in identifying study participants for trials assessing the effects of anti-amyloid therapies [11–13].”
§ Impact of zervimesine on the neuroinflammatory biomarker GFAP and related proteomic molecular correlates in plasma of participants from a phase 2 clinical trial in Alzheimer’s disease > Background
What the sources say
- Partly supportedcites [11] Ashton NJ, Brum WS, Di Molfetta G, Benedet AL, Arslan B, Jonaitis E, et al. Diagnostic accuracy of a plasma phosphorylated tau 217 immunoassay for Alzheimer disease pathology. JAMA Neurol. 2024;81:255. https://doi.org/10.1001/jamaneurol.2023.5319. sourceExperimental — accuracy not yet measured
The Results sections on abnormal Aβ and tau pathologies and on other plasma biomarkers report that plasma p-tau217 predicts PET-defined amyloid and tau pathology and correlates with both PET measures (page numbers unavailable in our copy). The Discussion describes promising utility for early Alzheimer disease trials, but says further studies of trial-inclusion designs are warranted. It does not establish that p-tau217 has already proven useful for selecting participants in anti-amyloid therapy trials. (LLM, conf=0.88)
- Not checked — no full text of the sourcecites [12] Hu Y, Cho M, Sachdev P, Dage J, Hendrix S, Hansson O, et al. Fluid biomarkers in the context of amyloid-targeting disease-modifying treatments in Alzheimer’s disease. Med. 2024;5:1206–26. https://doi.org/10.1016/j.medj.2024.08.004. source
- Partly supportedcites [13] Mattsson-Carlgren N, Janelidze S, Bateman RJ, Smith R, Stomrud E, Serrano GE, et al. Soluble P-tau217 reflects amyloid and tau pathology and mediates the association of amyloid with tau. EMBO Mol Med. 2021;13:e14022. https://doi.org/10.15252/emmm.202114022. sourceExperimental — accuracy not yet measured
The Results section reports associations between plasma P-tau217 and both amyloid and tau PET measures, supporting the first part of the claim. The paper does not report that plasma P-tau217 has proven useful for selecting participants for anti-amyloid therapy trials; its Participants section says amyloid positivity in the studied cohort was determined by PET. (LLM, conf=0.87)
plaincorrelational- Asserted: passes — The authors put it forward as true.
- Checkable: passes — It can be checked against evidence.
- Load-bearing: passes — The paper’s conclusions depend on it.
- Based: passes — The paper gives a reason why it holds.
Probably not a substantial claim. It may state two separate claims as one.
- Partly supported
The cited sources support only part of this claim — read each source’s verdict below.
In the paper
“The Aβ42/40 ratio is decreased in AD patients reflecting increased brain amyloid plaque load, and has been helpful in the diagnosis of AD [34, 35].”
§ Impact of zervimesine on the neuroinflammatory biomarker GFAP and related proteomic molecular correlates in plasma of participants from a phase 2 clinical trial in Alzheimer’s disease > Discussion
What the sources say
- Supportedcites [34] Hansson O, Blennow K, Zetterberg H, Dage J. Blood biomarkers for Alzheimer’s disease in clinical practice and trials. Nat Aging. 2023;3:506–19. https://doi.org/10.1038/s43587-023-00403-3. source
The BBMs for AD and related disorders section says the plasma Aβ42/Aβ40 ratio is lower in amyloid-positive groups and is associated with brain plaques. The CSF-based biomarkers section says the ratio correlates strongly with amyloid PET status and AD neuropathology and that CSF assays are used clinically. The paper also cautions that plasma assays vary substantially in diagnostic performance, so the claim should not be read as applying equally to every assay. (LLM, conf=0.89)
- Partly supportedcites [35] Lewczuk P, Matzen A, Blennow K, Parnetti L, Molinuevo JL, Eusebi P, et al. Cerebrospinal fluid Aβ42/40 corresponds better than Aβ42 to amyloid PET in Alzheimer’s disease. J Alzheimers Dis. 2016;55:813–22. https://doi.org/10.3233/JAD-160722. sourceExperimental — accuracy not yet measured
The Results (Demographic data and CSF biomarkers; page unavailable) report a lower CSF Aβ42/40 ratio in participants with greater PET-measured cortical amyloid deposition. The Introduction says the ratio improves the accuracy of clinical AD diagnosis. However, the study’s cohort was 88% cognitively normal, so its finding does not directly establish that the ratio is decreased specifically in AD patients. (LLM, conf=0.86)
plaindirect- Asserted: passes — The authors put it forward as true.
- Checkable: passes — It can be checked against evidence.
- Load-bearing: fails — The paper’s conclusions may not depend on it.
- Based: passes — The paper gives a reason why it holds.
Probably not a substantial claim. The paper’s conclusions may not depend on it. It may state two separate claims as one.
- Supported
Every source the paper cites for this claim was checked and supports it.
In the paper
“Treatment of neurons with zervimesine restores the functional and synaptic deficits incurred by Aβ oligomers, including the restoration of membrane trafficking, and the prevention of synapse loss [1].”
§ Impact of zervimesine on the neuroinflammatory biomarker GFAP and related proteomic molecular correlates in plasma of participants from a phase 2 clinical trial in Alzheimer’s disease > Background
What the sources say
- Supportedcites [1] Izzo NJ, Yuede CM, LaBarbera KM, Limegrover CS, Rehak C, Yurko R, et al. Preclinical and clinical biomarker studies of CT1812: a novel approach to Alzheimer’s disease modification. Alzheimers Dement. 2021;17:1365–82. https://doi.org/10.1002/alz.12302. source
The Results report that CT1812 restored Aβ-oligomer-induced vesicular trafficking deficits in neuronal cultures (Figure 1) and prevented or reversed synapse loss in cultured neurons (Figure 2). The paper uses the name CT1812 rather than zervimesine, but the reported effects match those attributed to the treatment. (LLM, conf=0.88)
plaindirect- Asserted: passes — The authors put it forward as true.
- Checkable: passes — It can be checked against evidence.
- Load-bearing: passes — The paper’s conclusions depend on it.
- Based: passes — The paper gives a reason why it holds.
It may state two separate claims as one.
- Supported
The cited sources support only part of this claim — read each source’s verdict below.
In the paper
“EEA1 is a key protein is a key marker of early endosomes that plays a crucial role in the endocytic trafficking and amyloidogenic processing of amyloid precursor protein (APP) [42], and altered expression of endosomal proteins including EEA1, can contribute to the AD progression, particularly in relation to Aβ accumulation [43].”
§ Impact of zervimesine on the neuroinflammatory biomarker GFAP and related proteomic molecular correlates in plasma of participants from a phase 2 clinical trial in Alzheimer’s disease > Discussion
What the sources say
- Not checked — no full text of the sourcecites [42] Burrinha T, Martinsson I, Gomes R, Terrasso AP, Gouras GK, Almeida CG. Upregulation of APP endocytosis by neuronal aging drives amyloid-dependent synapse loss. J Cell Sci. 2021. https://doi.org/10.1242/jcs.255752. source
- Partly supportedcites [43] Xicota L, Lagarde J, Eysert F, Grenier-Boley B, Rivals I, Botté A, et al. Modifications of the endosomal compartment in fibroblasts from sporadic Alzheimer’s disease patients are associated with cognitive impairment. Transl Psychiatry. 2023. https://doi.org/10.1038/s41398-023-02355-z. sourceExperimental — accuracy not yet measured
Split into 2 atoms — 0 confirmed, 2 partially supported, 0 disputed, 0 misattributed, 0 unverifiable. Expand the claim to see per-atom verdicts.
plainconditional- Asserted: passes — The authors put it forward as true.
- Checkable: passes — It can be checked against evidence.
- Load-bearing: fails — The paper’s conclusions may not depend on it.
- Based: passes — The paper gives a reason why it holds.
Probably not a substantial claim. The paper’s conclusions may not depend on it. It may state two separate claims as one.
The cited sources support only part of this claim — read each source’s verdict below.
In the paper
“IGF2R is important for memory, and its dysregulation may contribute to AD pathology. IGF2R levels decrease with the presence of the APOE4 allele, which is associated with increased risk for AD and overexpression of IGF2R is also associated to increase Aβ production [51, 52].”
§ Impact of zervimesine on the neuroinflammatory biomarker GFAP and related proteomic molecular correlates in plasma of participants from a phase 2 clinical trial in Alzheimer’s disease > Discussion
What the sources say
- Partly supportedcites [51] Alberini CM. IGF2 in memory, neurodevelopmental disorders, and neurodegenerative diseases. Trends Neurosci. 2023. https://doi.org/10.1016/j.tins.2023.03.007. sourceExperimental — accuracy not yet measured
The section on IGF2 expression and memory reports that blocking or deleting hippocampal IGF2R impairs long-term memory. The CNS diseases section links IGF2R to amyloid reduction in an AD mouse model, but does not report lower IGF2R levels with APOE4 or increased Aβ production from IGF2R overexpression; it instead reports that IGF2 overexpression reduced Aβ, apparently via IGF2R. Page numbers are unavailable in our copy. (LLM, conf=0.87)
- Supportedcites [52] Yu XW, Pandey K, Katzman AC, Alberini CM. A role for CIM6P/IGF2 receptor in memory consolidation and enhancement. Elife. 2020;9:1–25. https://doi.org/10.7554/eLife.54781. source
The Discussion reports that hippocampal neuronal CIM6P/IGF2R is crucial for memory consolidation and implicates the receptor in Alzheimer’s disease. It also states that receptor levels decrease with APOE4 alleles and that receptor overexpression increases Aβ production. The APOE4 and overexpression findings are reported from earlier studies, not presented as this paper’s own experiments. (LLM, conf=0.94)
hedgedcorrelational- Asserted: passes — The authors put it forward as true.
- Checkable: passes — It can be checked against evidence.
- Load-bearing: fails — The paper’s conclusions may not depend on it.
- Based: passes — The paper gives a reason why it holds.
Probably not a substantial claim. The paper’s conclusions may not depend on it. It may state two separate claims as one.
- Partly supported
A result the paper reports from its own data — it cites no other source for it, so there is none to check. The quote shows it is in the paper.
In the paper
“Nominally significant trends (p ≤ 0.10) in reducing plasma levels of Aβ40, Aβ42, and NfL were also observed in zervimesine vs. placebo treated participants”
§ Impact of zervimesine on the neuroinflammatory biomarker GFAP and related proteomic molecular correlates in plasma of participants from a phase 2 clinical trial in Alzheimer’s disease > Discussion
plaindirect- Asserted: passes — The authors put it forward as true.
- Checkable: passes — It can be checked against evidence.
- Load-bearing: passes — The paper’s conclusions depend on it.
- Based: unclear — It is unclear why the paper says it holds.
The quote only partly states this claim.
A result the paper reports from its own data — it cites no other source for it, so there is none to check. The quote shows it is in the paper.
In the paper
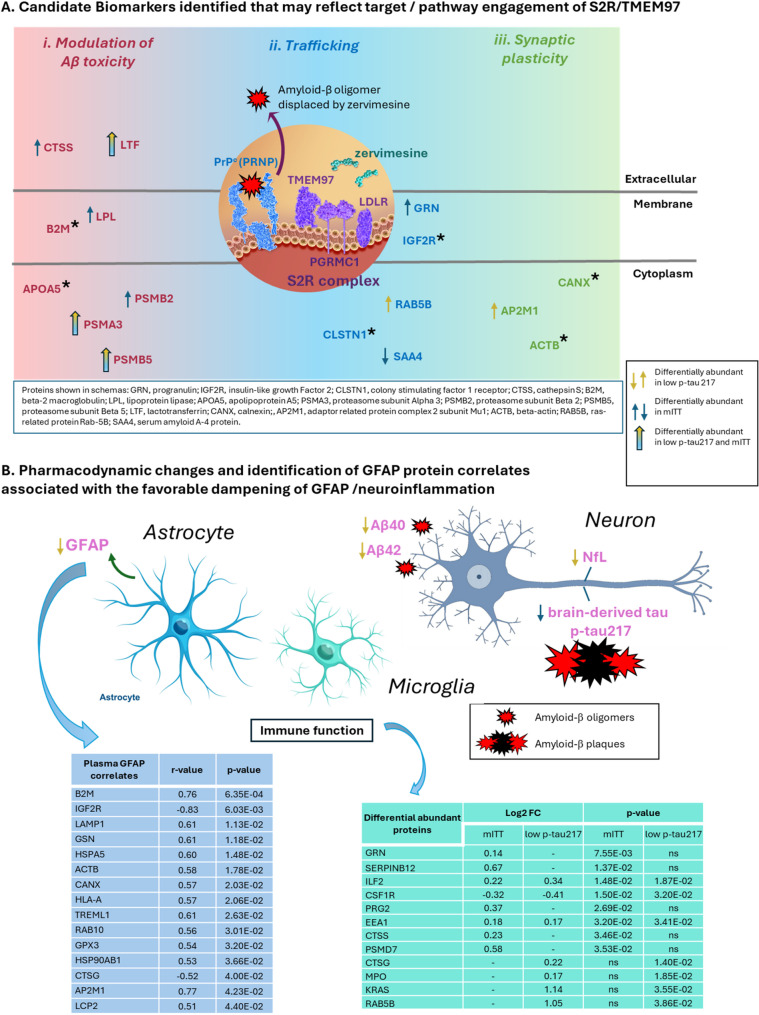
“Scatter plots of two of these proteins – glutathione peroxidase 3 (GPX3) and cathepsin G (CTSG) – are shown, demonstrating examples of a positive and negative correlation of change in abundance with improvement in plasma GFAP levels”
§ Impact of zervimesine on the neuroinflammatory biomarker GFAP and related proteomic molecular correlates in plasma of participants from a phase 2 clinical trial in Alzheimer’s disease > Results > Zervimesine-impacted plasma proteins correlated with plasma GFAP levels
boostedcorrelational- Asserted: fails — The authors may not put it forward as true.
- Checkable: passes — It can be checked against evidence.
- Load-bearing: fails — The paper’s conclusions may not depend on it.
- Based: fails — The paper may give no reason why it holds.
Probably not a substantial claim. The authors may not put it forward as true. The paper’s conclusions may not depend on it. The paper may give no reason why it holds.
A result the paper reports from its own data — it cites no other source for it, so there is none to check. The quote shows it is in the paper.
In the paper
“of which 58 proteins were significantly differentially abundant with zervimesine treatment (Fig. 2A: zervimesine vs. placebo p ≤ 0.05, 53 increased (red), 5 decreased (green)).”
§ Impact of zervimesine on the neuroinflammatory biomarker GFAP and related proteomic molecular correlates in plasma of participants from a phase 2 clinical trial in Alzheimer’s disease > Results > Proteomics discovery of pharmacodynamic plasma biomarkers of zervimesine
plaindirect- Asserted: passes — The authors put it forward as true.
- Checkable: passes — It can be checked against evidence.
- Load-bearing: passes — The paper’s conclusions depend on it.
- Based: passes — The paper gives a reason why it holds.
It may state two separate claims as one.
A result the paper reports from its own data — it cites no other source for it, so there is none to check. The quote shows it is in the paper.
In the paper
“Fifteen proteins (Fig. 4C, brown overlap) met both correlation and differential abundance criteria.”
§ Impact of zervimesine on the neuroinflammatory biomarker GFAP and related proteomic molecular correlates in plasma of participants from a phase 2 clinical trial in Alzheimer’s disease > Results > Zervimesine-impacted plasma proteins correlated with plasma GFAP levels
plaincorrelational- Asserted: passes — The authors put it forward as true.
- Checkable: passes — It can be checked against evidence.
- Load-bearing: passes — The paper’s conclusions depend on it.
- Based: passes — The paper gives a reason why it holds.
The quote only partly states this claim.
The paper states this without a source or data behind it here, so there is nothing to check it against. The quote shows it is in the paper.
In the paper
“only the 283 “Drug Selective” protein correlates (r≥|0.50|) (orange semicircle; top correlates shown in Supplemental Table 3), were selected for pathway analyses”
§ Impact of zervimesine on the neuroinflammatory biomarker GFAP and related proteomic molecular correlates in plasma of participants from a phase 2 clinical trial in Alzheimer’s disease > Results > Zervimesine-impacted plasma proteins correlated with plasma GFAP levels
plainn = 16- Asserted: passes — The authors put it forward as true.
- Checkable: passes — It can be checked against evidence.
- Load-bearing: passes — The paper’s conclusions depend on it.
- Based: passes — The paper gives a reason why it holds.
Probably not a substantial claim.
A result the paper reports from its own data — it cites no other source for it, so there is none to check. The quote shows it is in the paper.
In the paper
“These candidate biomarkers include early endosome antigen 1 (EEA1), identified in mITT and low p-tau217 groups, and progranulin (GRN) identified in the mITT population.”
§ Impact of zervimesine on the neuroinflammatory biomarker GFAP and related proteomic molecular correlates in plasma of participants from a phase 2 clinical trial in Alzheimer’s disease > Discussion
plaincorrelational- Asserted: passes — The authors put it forward as true.
- Checkable: passes — It can be checked against evidence.
- Load-bearing: passes — The paper’s conclusions depend on it.
- Based: passes — The paper gives a reason why it holds.
It may state two separate claims as one.
A conclusion the paper draws from its own results — it cites no other source for it, so there is none to check. The quote shows it is in the paper.
In the paper
“Data provide insights into the mechanism by which zervimesine may ameliorate AD through S2R, perhaps via dampening neuroinflammation in addition to slowing neurodegeneration”
§ Impact of zervimesine on the neuroinflammatory biomarker GFAP and related proteomic molecular correlates in plasma of participants from a phase 2 clinical trial in Alzheimer’s disease > Background
hedgedconditional- Asserted: passes — The authors put it forward as true.
- Checkable: passes — It can be checked against evidence.
- Load-bearing: passes — The paper’s conclusions depend on it.
- Based: passes — The paper gives a reason why it holds.
It may state two separate claims as one.
- Rests on an assumption: GFAP is a neuroinflammatory biomarker.
In the paper
“Plasma biomarkers are less invasive, less costly, and more time-efficient measurements than CSF or neuroimaging biomarkers [9].”
§ Impact of zervimesine on the neuroinflammatory biomarker GFAP and related proteomic molecular correlates in plasma of participants from a phase 2 clinical trial in Alzheimer’s disease > Discussion
What the sources say
- Not checked yetcites [9] Mattsson-Carlgren N, Collij LE, Stomrud E, Pichet Binette A, Ossenkoppele R, Smith R, et al. Plasma biomarker strategy for selecting patients with Alzheimer disease for antiamyloid immunotherapies. JAMA Neurol. 2024;81:69–78. https://doi.org/10.1001/jamaneurol.2023.4596. source
plain- Asserted: passes — The authors put it forward as true.
- Checkable: passes — It can be checked against evidence.
- Load-bearing: passes — The paper’s conclusions depend on it.
- Based: passes — The paper gives a reason why it holds.
It may state two separate claims as one.
What the paper did — it cites no source for this, so there is none to check. The quote shows it is in the paper.
In the paper
“Participants were randomized 1:1:1 to receive placebo, or 100 or 300 mg zervimesine, orally, once daily for 6 months.”
§ Impact of zervimesine on the neuroinflammatory biomarker GFAP and related proteomic molecular correlates in plasma of participants from a phase 2 clinical trial in Alzheimer’s disease > Methods > Clinical trial design
plain- Asserted: passes — The authors put it forward as true.
- Checkable: passes — It can be checked against evidence.
- Load-bearing: passes — The paper’s conclusions depend on it.
- Based: passes — The paper gives a reason why it holds.
Probably not a substantial claim.
In the paper
“Increased GFAP, associated with astrogliosis, is a hallmark of and linked to pathological processes in Alzheimer’s disease, particularly amyloid build-up, and neuroinflammation [27].”
§ Impact of zervimesine on the neuroinflammatory biomarker GFAP and related proteomic molecular correlates in plasma of participants from a phase 2 clinical trial in Alzheimer’s disease > Discussion
What the sources say
- Not checked yetcites [27] Pereira JB, Janelidze S, Smith R, Mattsson-Carlgren N, Palmqvist S, Teunissen CE, et al. Plasma GFAP is an early marker of amyloid-β but not tau pathology in Alzheimer’s disease. Brain. 2021;144:3505–16. https://doi.org/10.1093/brain/awab223. source
plaincorrelational- Asserted: passes — The authors put it forward as true.
- Checkable: passes — It can be checked against evidence.
- Load-bearing: passes — The paper’s conclusions depend on it.
- Based: passes — The paper gives a reason why it holds.
It may state two separate claims as one.
What the paper did — it cites no source for this, so there is none to check. The quote shows it is in the paper.
In the paper
“This hypothesis was pre-specified in the statistical analysis plan for the SHINE trial using an indirect measure of brain pathology by assessing baseline plasma p-tau217 levels and using the median value to generate “low” and “high” p-tau217 subgroups.”
§ Impact of zervimesine on the neuroinflammatory biomarker GFAP and related proteomic molecular correlates in plasma of participants from a phase 2 clinical trial in Alzheimer’s disease > Discussion
plain- Asserted: passes — The authors put it forward as true.
- Checkable: passes — It can be checked against evidence.
- Load-bearing: passes — The paper’s conclusions depend on it.
- Based: passes — The paper gives a reason why it holds.
Probably not a substantial claim.
None of the sources cited for this claim have been checked yet.
In the paper
“Given that PrPC can bind APP and can alter levels of Aβ40 and Aβ42 [38]”
§ Impact of zervimesine on the neuroinflammatory biomarker GFAP and related proteomic molecular correlates in plasma of participants from a phase 2 clinical trial in Alzheimer’s disease > Discussion
What the sources say
- Not checked yetcites [38] Foley AR, Roseman GP, Chan K, Smart A, Finn TS, Yang K, et al. Evidence for aggregation-independent, PrP C -mediated Aβ cellular internalization. Proc Natl Acad Sci. 2020;117:28625–31. https://doi.org/10.1073/pnas.2009238117. source
Checked before — its earlier verdict is held back until a new check runs.
plaindirect- Asserted: passes — The authors put it forward as true.
- Checkable: passes — It can be checked against evidence.
- Load-bearing: fails — The paper’s conclusions may not depend on it.
- Based: passes — The paper gives a reason why it holds.
Probably not a substantial claim. The paper’s conclusions may not depend on it. It may state two separate claims as one.
- Not checked yet
None of the sources cited for this claim have been checked yet.
In the paper
“Findings from the SHINE p-tau217 subgroup analysis identified a patient population most likely to respond to zervimesine treatment, with favorable findings of a biological impact – decrease in GFAP and trends in decreases in NfL and Aβ42 – consistent with improved clinical outcomes [7, 8].”
§ Impact of zervimesine on the neuroinflammatory biomarker GFAP and related proteomic molecular correlates in plasma of participants from a phase 2 clinical trial in Alzheimer’s disease > Background
What the sources say
- Not checked yetcites [7] Cognition Therapeutics. A Study to Evaluate the Safety and Efficacy of CT1812 in Subjects With Mild to Moderate Alzheimer’s Disease. ClinicalTrials.gov identifier: NCT035077. 2025 [cited 2026 Feb 4]. Accessed 4 Feb 2026. https://clinicaltrials.gov/study/NCT03507790.
- Not checked — no full text of the sourcecites [8] Vijverberg EGB, Scharre DW, Woodward M, Catalano S, Hamby ME, Grundman M, et al. Randomized, Double-Blind Study of Zervimesine in Mild to Moderate Alzheimer’s Disease. Journal of Alzheimer's Disease. 2026. https://doi.org/10.1177/13872877261437145. source
plaindirect- Asserted: passes — The authors put it forward as true.
- Checkable: passes — It can be checked against evidence.
- Load-bearing: passes — The paper’s conclusions depend on it.
- Based: passes — The paper gives a reason why it holds.
It may state two separate claims as one.
None of the sources cited for this claim have been checked yet.
In the paper
“Elevated levels of GFAP in plasma and serum are associated with the degree and rate of neurodegeneration, Aβ positivity and cognitive decline in individuals with AD [27, 28].”
§ Impact of zervimesine on the neuroinflammatory biomarker GFAP and related proteomic molecular correlates in plasma of participants from a phase 2 clinical trial in Alzheimer’s disease > Results > Zervimesine-impacted plasma proteins correlated with plasma GFAP levels
What the sources say
- Not checked yetcites [27] Pereira JB, Janelidze S, Smith R, Mattsson-Carlgren N, Palmqvist S, Teunissen CE, et al. Plasma GFAP is an early marker of amyloid-β but not tau pathology in Alzheimer’s disease. Brain. 2021;144:3505–16. https://doi.org/10.1093/brain/awab223. source
- Not checked yetcites [28] Phillips JM, Winfree RL, Seto M, Schneider JA, Bennett DA, Dumitrescu LC, et al. Pathologic and clinical correlates of region-specific brain GFAP in Alzheimer’s disease. Acta Neuropathol. Springer Science and Business Media Deutschland GmbH; 2024;148. https://doi.org/10.1007/s00401-024-02828-5. source
Checked before — its earlier verdict is held back until a new check runs.
plaincorrelational- Asserted: passes — The authors put it forward as true.
- Checkable: passes — It can be checked against evidence.
- Load-bearing: fails — The paper’s conclusions may not depend on it.
- Based: passes — The paper gives a reason why it holds.
Probably not a substantial claim. The paper’s conclusions may not depend on it.
A conclusion the paper draws from its own results — it cites no other source for it, so there is none to check. The quote shows it is in the paper.
In the paper
“which provides support for a role of zervimesine in impacting amyloid biology, neuroinflammation and neurodegeneration in patients with mild to moderate AD that have lower than 1 pg/ml p-tau17 levels at baseline using the AlzPath Dx assay.”
§ Impact of zervimesine on the neuroinflammatory biomarker GFAP and related proteomic molecular correlates in plasma of participants from a phase 2 clinical trial in Alzheimer’s disease > Discussion
hedgedconditional- Asserted: passes — The authors put it forward as true.
- Checkable: passes — It can be checked against evidence.
- Load-bearing: passes — The paper’s conclusions depend on it.
- Based: passes — The paper gives a reason why it holds.
The quote only partly states this claim.
A conclusion the paper draws from its own results — it cites no other source for it, so there is none to check. The quote shows it is in the paper.
In the paper
“Several biomarkers identified in either or both the mITT population and p-tau217 subgroup analyses, supports that zervimesine modulates i) Aβ toxicity (CTSS, B2M, LPL, APOA5, PSMA3, PSMB2, PSMAB5, LTF), (ii) neuronal trafficking (GRN, IGF2R, CLSTN1, RAB5B, SAA4), and (iii) synaptic plasticity (CANX, AP2M1, ACTB).”
§ Impact of zervimesine on the neuroinflammatory biomarker GFAP and related proteomic molecular correlates in plasma of participants from a phase 2 clinical trial in Alzheimer’s disease > Results > Zervimesine-impacted plasma proteins correlated with plasma GFAP levels
hedgeddirect- Asserted: passes — The authors put it forward as true.
- Checkable: passes — It can be checked against evidence.
- Load-bearing: passes — The paper’s conclusions depend on it.
- Based: passes — The paper gives a reason why it holds.
It may state two separate claims as one.
In the paper
“Progranulin (GRN) regulates lysosomal biogenesis, inflammation and stress response [44]. GRN has been genetically linked to the neurodegeneration, with loss of function mutations or decreased levels have increased risk for neurodegenerative diseases including AD [44].”
§ Impact of zervimesine on the neuroinflammatory biomarker GFAP and related proteomic molecular correlates in plasma of participants from a phase 2 clinical trial in Alzheimer’s disease > Discussion
What the sources say
- Not checked — no full text of the sourcecites [44] Rhinn H, Tatton N, McCaughey S, Kurnellas M, Rosenthal A, Elsevier Ltd. Progranulin as a therapeutic target in neurodegenerative diseases. Trends Pharmacol Sci. 2022. https://doi.org/10.1016/j.tips.2021.11.015. source
plaindirect- Asserted: passes — The authors put it forward as true.
- Checkable: passes — It can be checked against evidence.
- Load-bearing: passes — The paper’s conclusions depend on it.
- Based: passes — The paper gives a reason why it holds.
Probably not a substantial claim. It may state two separate claims as one.
What the paper did — it cites no source for this, so there is none to check. The quote shows it is in the paper.
In the paper
“Limitations of this study include a limited sample size, and sample sizes were even smaller in subgroups.”
§ Impact of zervimesine on the neuroinflammatory biomarker GFAP and related proteomic molecular correlates in plasma of participants from a phase 2 clinical trial in Alzheimer’s disease > Discussion > Limitations
plain- Asserted: passes — The authors put it forward as true.
- Checkable: passes — It can be checked against evidence.
- Load-bearing: unclear — It is unclear whether the paper’s conclusions depend on it.
- Based: passes — The paper gives a reason why it holds.
It may state two separate claims as one.
None of the sources cited for this claim have been checked yet.
In the paper
“GPX3 is an enzyme involved in the antioxidant system and its expression is altered in AD [49].”
§ Impact of zervimesine on the neuroinflammatory biomarker GFAP and related proteomic molecular correlates in plasma of participants from a phase 2 clinical trial in Alzheimer’s disease > Discussion
What the sources say
- Not checked yetcites [49] Panyard DJ, Reus LM, Ali M, Liu J, Deming YK, Lu Q, et al. Post-GWAS multiomic functional investigation of the TNIP1 locus in Alzheimer’s disease highlights a potential role for GPX3. Alzheimers Dement. 2024;20:5044–53. https://doi.org/10.1002/alz.13848. source
Checked before — its earlier verdict is held back until a new check runs.
plaincorrelational- Asserted: passes — The authors put it forward as true.
- Checkable: passes — It can be checked against evidence.
- Load-bearing: fails — The paper’s conclusions may not depend on it.
- Based: passes — The paper gives a reason why it holds.
Probably not a substantial claim. The paper’s conclusions may not depend on it. It may state two separate claims as one.
- Not checked yet
None of the sources cited for this claim have been checked yet.
In the paper
“CLSTN plays a role in Aβ processing, axonal transport and formation of synapses [53].”
§ Impact of zervimesine on the neuroinflammatory biomarker GFAP and related proteomic molecular correlates in plasma of participants from a phase 2 clinical trial in Alzheimer’s disease > Discussion
What the sources say
- Not checked yetcites [53] Vagnoni A, Perkinton MS, Gray EH, Francis PT, Noble W, Miller CCJ. Calsyntenin-1 mediates axonal transport of the amyloid precursor protein and regulates aβ production. Hum Mol Genet. 2012;21:2845–54. https://doi.org/10.1093/hmg/dds109. source
Checked before — its earlier verdict is held back until a new check runs.
plaindirect- Asserted: passes — The authors put it forward as true.
- Checkable: passes — It can be checked against evidence.
- Load-bearing: fails — The paper’s conclusions may not depend on it.
- Based: passes — The paper gives a reason why it holds.
Probably not a substantial claim. The paper’s conclusions may not depend on it. It may state two separate claims as one.
- Not checked yet
A conclusion the paper draws from its own results — it cites no other source for it, so there is none to check. The quote shows it is in the paper.
In the paper
“In sum, findings of the SHINE study support the continued clinical development of zervimesine for the treatment of neurodegenerative diseases.”
§ Impact of zervimesine on the neuroinflammatory biomarker GFAP and related proteomic molecular correlates in plasma of participants from a phase 2 clinical trial in Alzheimer’s disease > Conclusion
plaindirect- Asserted: passes — The authors put it forward as true.
- Checkable: fails — It may be too vague to check against evidence.
- Load-bearing: passes — The paper’s conclusions depend on it.
- Based: passes — The paper gives a reason why it holds.
Probably not a substantial claim. It may be too vague to check against evidence.
A conclusion the paper draws from its own results — it cites no other source for it, so there is none to check. The quote shows it is in the paper.
In the paper
“it is possible that while some biomarkers identified may reflect biological changes in the brain, it is also possible that some biomarkers may reflect changes occurring in the periphery, that may not be disease-relevant.”
§ Impact of zervimesine on the neuroinflammatory biomarker GFAP and related proteomic molecular correlates in plasma of participants from a phase 2 clinical trial in Alzheimer’s disease > Discussion > Limitations
hedgedconditional- Asserted: passes — The authors put it forward as true.
- Checkable: passes — It can be checked against evidence.
- Load-bearing: fails — The paper’s conclusions may not depend on it.
- Based: passes — The paper gives a reason why it holds.
Probably not a substantial claim. The paper’s conclusions may not depend on it. It may state two separate claims as one.
What the paper did — it cites no source for this, so there is none to check. The quote shows it is in the paper.
In the paper
“Given this analysis was performed using an unadjusted p-value of p ≤ 0.05, it is likely that 5% of the proteins may be false-positives.”
§ Impact of zervimesine on the neuroinflammatory biomarker GFAP and related proteomic molecular correlates in plasma of participants from a phase 2 clinical trial in Alzheimer’s disease > Discussion
hedged- Asserted: passes — The authors put it forward as true.
- Checkable: passes — It can be checked against evidence.
- Load-bearing: passes — The paper’s conclusions depend on it.
- Based: passes — The paper gives a reason why it holds.
It may state two separate claims as one.
A conclusion the paper draws from its own results — it cites no other source for it, so there is none to check. The quote shows it is in the paper.
In the paper
“Plasma proteomic analysis of SHINE participant further supports a role of zervimesine in impacting amyloid biology, synaptic biology, vesicle and lipid trafficking, neuroinflammation and neurodegeneration and highlights a newly discovered set of biomarkers to track in future trials, biomarkers which could reflect S2R pathway engagement or an impact on the disease progression.”
§ Impact of zervimesine on the neuroinflammatory biomarker GFAP and related proteomic molecular correlates in plasma of participants from a phase 2 clinical trial in Alzheimer’s disease > Conclusion
hedgeddirect- Asserted: passes — The authors put it forward as true.
- Checkable: passes — It can be checked against evidence.
- Load-bearing: passes — The paper’s conclusions depend on it.
- Based: passes — The paper gives a reason why it holds.
It may state two separate claims as one.
A conclusion the paper draws from its own results — it cites no other source for it, so there is none to check. The quote shows it is in the paper.
In the paper
“In a subgroup analysis of the SHINE trial, in alignment with the clinical effects and CSF biomarker changes, treatment with zervimesine for 6 months leads to positive changes (decreases) in canonical biomarkers of neuroinflammation, trends towards dampening of neurodegeneration, and an impact on amyloid biology; biological effects consistent with the greater clinical effect size seen in the low p-”
§ Impact of zervimesine on the neuroinflammatory biomarker GFAP and related proteomic molecular correlates in plasma of participants from a phase 2 clinical trial in Alzheimer’s disease > Conclusion
plaindirect- Asserted: passes — The authors put it forward as true.
- Checkable: passes — It can be checked against evidence.
- Load-bearing: passes — The paper’s conclusions depend on it.
- Based: passes — The paper gives a reason why it holds.
It may state two separate claims as one.
In the paper
“and is involved in Aβ deposition and like CTSS can modulate immune responses [50].”
§ Impact of zervimesine on the neuroinflammatory biomarker GFAP and related proteomic molecular correlates in plasma of participants from a phase 2 clinical trial in Alzheimer’s disease > Discussion
What the sources say
- Not checked — no full text of the sourcecites [50] Savage MJ, Iqbal M, Loh T, Trusko SP, Scott R, Siman R. Cathepsin G: localization in human cerebral cortex and generation of amyloidogenic fragments from the β-amyloid precursor protein. Neuroscience. 1994;60:607–19. https://doi.org/10.1016/0306-4522(94)90490-1. source
plaincorrelational- Asserted: passes — The authors put it forward as true.
- Checkable: passes — It can be checked against evidence.
- Load-bearing: fails — The paper’s conclusions may not depend on it.
- Based: passes — The paper gives a reason why it holds.
Probably not a substantial claim. The paper’s conclusions may not depend on it. It may state two separate claims as one.
What the paper did — it cites no source for this, so there is none to check. The quote shows it is in the paper.
In the paper
“All proteomics differential abundance and correlations analysis performed considered unadjusted p-values and did not control for multiple comparisons, thus permitting a greater likelihood of type 1 errors (false positives).”
§ Impact of zervimesine on the neuroinflammatory biomarker GFAP and related proteomic molecular correlates in plasma of participants from a phase 2 clinical trial in Alzheimer’s disease > Discussion > Limitations
plaindirect- Asserted: passes — The authors put it forward as true.
- Checkable: passes — It can be checked against evidence.
- Load-bearing: passes — The paper’s conclusions depend on it.
- Based: passes — The paper gives a reason why it holds.
It may state two separate claims as one.
None of the sources cited for this claim have been checked yet.
In the paper
“Of note, LPL is a key enzyme involved in lipid metabolism. By interacting with lipoprotein receptors, such as the direct interactor with S2R (TMEM97), LDLR [46], LPL promotes the internalization of lipoproteins, contributing to lipid homeostasis and receptor-mediated signaling in neurons. In addition, LPL maintains the balance of membrane composition and fluidity, which is crucial for proper”
§ Impact of zervimesine on the neuroinflammatory biomarker GFAP and related proteomic molecular correlates in plasma of participants from a phase 2 clinical trial in Alzheimer’s disease > Discussion
What the sources say
- Not checked yetcites [46] Riad A, Zeng C, Weng C-C, Winters H, Xu K, Makvandi M, et al. Sigma-2 receptor/TMEM97 and PGRMC-1 increase the rate of internalization of LDL by LDL receptor through the formation of a ternary complex. Sci Rep. 2018;8:16845. https://doi.org/10.1038/s41598-018-35430-3. source
- Not checked yetcites [47] Althaher AR, S. AL Shehadeh R. Lipoprotein Lipase and Neurological Health: Investigating its Impact on Brain Function and Alzheimer’s Disease. Open Biomark J. 2024;14. https://doi.org/10.2174/0118753183367402241216115139. source
Checked before — its earlier verdict is held back until a new check runs.
plaindirect- Asserted: passes — The authors put it forward as true.
- Checkable: passes — It can be checked against evidence.
- Load-bearing: fails — The paper’s conclusions may not depend on it.
- Based: passes — The paper gives a reason why it holds.
Probably not a substantial claim. The paper’s conclusions may not depend on it. It may state two separate claims as one.
What the paper did — it cites no source for this, so there is none to check. The quote shows it is in the paper.
In the paper
“While the p-tau217 subgroup analysis was prespecified, it was not the primary analysis.”
§ Impact of zervimesine on the neuroinflammatory biomarker GFAP and related proteomic molecular correlates in plasma of participants from a phase 2 clinical trial in Alzheimer’s disease > Discussion > Limitations
plain- Asserted: passes — The authors put it forward as true.
- Checkable: passes — It can be checked against evidence.
- Load-bearing: fails — The paper’s conclusions may not depend on it.
- Based: passes — The paper gives a reason why it holds.
Probably not a substantial claim. The paper’s conclusions may not depend on it. It may state two separate claims as one.
The paper relies on this without support.
Zervimesine is a modulator of the sigma-2 receptor (S2R/TMEM97).
“Zervimesine (CT1812) is an orally administered small molecule modulator of the sigma-2 receptor (S2R/TMEM97) in clinical development for treatment of Alzheimer’s disease (AD; NCT03507790; NCT05531656) and dementia with Lewy bodies (DLB; NCT05225415).”
The paper relies on this without support.
GFAP is a neuroinflammatory biomarker.
“the neuroinflammatory marker GFAP”
The paper relies on this without support.
NfL is a recognized biomarker of neurodegeneration for multiple neurodegenerative disorders, including AD, in which CSF levels are elevated relative to healthy non-demented control.
“NfL is a recognized biomarker of neurodegeneration for multiple neurodegenerative disorders, including AD, in which CSF levels are elevated relative to healthy non-demented control.”
The paper relies on this without support.
HSPA5 and HSP90AB1 are members of the heat shock protein family and as chaperone proteins are involved in controlling protein folding and ER homeostasis.
“HSPA5, HSP90AB1are both members of the heat shock protein family and as chaperone proteins are involved in controlling protein folding and ER homeostasis.”
The paper relies on this without support.
Elevated secreted GFAP levels is a well-established marker of astrogliosis, detectable in plasma due to blood-brain-barrier disruption, and elevated in plasma of patients with AD.
“Elevated secreted GFAP levels is a well-established marker of astrogliosis, detectable in plasma due to blood-brain-barrier disruption, and elevated in plasma of patients with AD.”
Self-check
Percentages, sums and reported differences re-computed from the paper’s own numbers.
Each contradiction between two passages listed here was confirmed by an independent check.
Rated minor: it would not touch a result — a value no result rests on, a p-value that stays on the same side of the significance level, or a conflict that is clerical, resolved elsewhere in the paper, or outside its own findings.
In the paper
§ Impact of zervimesine on the neuroinflammatory biomarker GFAP and related proteomic molecular correlates in plasma of participants from a phase 2 clinical trial in Alzheimer’s disease > Results > Zervimesine-impacted plasma proteins correlated with plasma GFAP levels
“Fifteen proteins (Fig. 4C, brown overlap) met both correlation and differential abundance criteria.”
§ Impact of zervimesine on the neuroinflammatory biomarker GFAP and related proteomic molecular correlates in plasma of participants from a phase 2 clinical trial in Alzheimer’s disease > Discussion
“Of the 283 “Drug Selective” proteins correlated with the plasma GFAP levels (P ≤ 0.05), 15 were also impacted by zervimesine treatment (zervimesine vs. placebo, p < 0.05).”
Citations
Cites
Donanemab in Early Symptomatic Alzheimer Disease: The TRAILBLAZER-ALZ 2 Randomized Clinical Trial
Sims, J. R., Zimmer, J. A., Evans, C. D., Lu, M., Ardayfio, P., Sparks, J., Wessels, A. M., Shcherbinin, S., Wang, H., Monkul Nery, E. S., et al. (2023) · JAMA · doi:10.1001/jama.2023.13239 · Cited by 2,932
Reimand, J., Isserlin, R., Voisin, V., Kucera, M., Tannus-Lopes, C., Rostamianfar, A., Wadi, L., Meyer, M., Wong, J., Xu, C., et al. (2019) · Nature Protocols · doi:10.1038/s41596-018-0103-9 · Cited by 1,970
Blood-based biomarkers for Alzheimer's disease: towards clinical implementation
Teunissen, C. E., Verberk, I. M. W., Thijssen, E. H., Vermunt, L., Hansson, O., Zetterberg, H., van der Flier, W. M., Mielke, M. M., & del Campo, M. (2022) · The Lancet Neurology · doi:10.1016/s1474-4422(21)00361-6 · Cited by 1,045
Self-citationDiagnostic Accuracy of a Plasma Phosphorylated Tau 217 Immunoassay for Alzheimer Disease Pathology
Ashton, N. J., Brum, W. S., Di Molfetta, G., Benedet, A. L., Arslan, B., Jonaitis, E., Langhough, R. E., Cody, K., Wilson, R., Carlsson, C. M., et al. (2024) · JAMA Neurology · doi:10.1001/jamaneurol.2023.5319 · Cited by 884 · cited 2×
“…to be an excellent indicator of degree of amyloid as assessed via CSF analysis and amyloid PET, and tau levels as assessed via tau PET [9, 13, 14, 32], and for practical reasons, as if the hypothesis was proven correct, this might enable use of this plasma biomarker to enrich for a responder…”
Self-citationBenedet, A. L., Milà-Alomà, M., Vrillon, A., Ashton, N. J., Pascoal, T. A., Lussier, F., Karikari, T. K., Hourregue, C., Cognat, E., Dumurgier, J., et al. (2021) · JAMA Neurology · doi:10.1001/jamaneurol.2021.3671 · Cited by 638
Self-citationPlasma GFAP is an early marker of amyloid-β but not tau pathology in Alzheimer's disease
Pereira, J. B., Janelidze, S., Smith, R., Mattsson-Carlgren, N., Palmqvist, S., Teunissen, C. E., Zetterberg, H., Stomrud, E., Ashton, N. J., Blennow, K., et al. (2021) · Brain · doi:10.1093/brain/awab223 · Cited by 598
Self-citationBlood biomarkers for Alzheimer’s disease in clinical practice and trials
Hansson, O., Blennow, K., Zetterberg, H., & Dage, J. (2023) · Nature Aging · doi:10.1038/s43587-023-00403-3 · Cited by 522
Self-citationAlzheimer's disease: synaptic dysfunction and Aβ
Shankar, G. M., & Walsh, D. M. (2009) · Molecular Neurodegeneration · doi:10.1186/1750-1326-4-48 · Cited by 486
Cicognola, C., Janelidze, S., Hertze, J., Zetterberg, H., Blennow, K., Mattsson, N., & Hansson, O. (2021) · Alzheimer s Research & Therapy · doi:10.1186/s13195-021-00804-9 · Cited by 324
Self-citationSoluble P‐tau217 reflects amyloid and tau pathology and mediates the association of amyloid with tau
Mattsson‐Carlgren, N., Janelidze, S., Bateman, R. J., Smith, R., Stomrud, E., Serrano, G. E., Reiman, E. M., Palmqvist, S., Dage, J. L., Beach, T. G., et al. (2021) · EMBO Molecular Medicine · doi:10.15252/emmm.202114022 · Cited by 261
Research works printed but not linked: 7
- Ashton NJ, Brum WS, Molfetta GD, Benedet AL, Arslan B, Jonaitis E, et al. Diagnostic accuracy of a plasma phosphorylated tau 217 immunoassay for Alzheimer disease pathology. JAMA Neurol. 2024;81:255–63. https://doi.org/10.1001/jamaneurol.2023.5319. · DOI · Paper page
- Sperling RA, Selkoe DJ, Reyderman L, Cao Y, van Dyck CH. Does the Current Evidence Base Support Lecanemab Continued Dosing for Early Alzheimer’s Disease? [Perspectives Session]. Alzheimer’s Assoc Int Conf. Philadelphia, PA; 2024.
- Cognition Therapeutics. Cognition Therapeutics Study of Zervimesine (CT1812) in Early Alzheimer’s Disease Surpasses 50% Enrollment Target [Press Release]. 2025 Jul 1; https://ir.cogrx.com/press_releases/cognition-therapeutics-study-of-zervimesine-ct1812-in-early-alzheimers-disease-surpasses-50-enrollment-target/.
- Cognition Therapeutics. Cognition Therapeutics’ Analysis Correlates Biomarker Changes with Cognitive Benefit in Alzheimer’s Population [Press Release]. 2024 Nov 25; https://ir.cogrx.com/press_releases/cognition-therapeutics-analysis-correlates-biomarker-changes-with-cognitive-benefit-in-alzheimers-population/.
- Cognition Therapeutics. Cognition Therapeutics presents phase 3 plan for zervimesine (CT1812) in Alzheimer’s disease at Clinical Trials on Alzheimer’s Disease (CTAD) conference. [Press Release]. 2025 Dec 1; https://ir.cogrx.com/press_releases/cognition-therapeutics-presents-phase-3-plan-for-zervimesine-ct1812-in-alzheimers-disease-at-clinical-trials-on-alzheimers-disease-ctad-conference/.
- Lilly. Results from Lilly’s Landmark Phase 3 Trial of Donanemab Presented at Alzheimer’s Association Conference and Published in JAMA [Press Release]. 2023 Jul 17; https://investor.lilly.com/news-releases/news-release-details/results-lillys-landmark-phase-3-trial-donanemab-presented.
- Eisai. New Clinical Data Demonstrates Three Years of Continuous Treatment with Dual-Acting LEQEMBI® (lecanemab-irmb) Continues to Significantly Benefit Early Alzheimer’s Disease Patients Presented at AAIC 2024. [Press Release]. 2024. https://www.eisai.com/news/2024/news202456.html.
Cited by
Sorted by citations
Crystal Structure of the Sigma-2 Receptor Complexed with Investigational Drug Zervimesine (CT1812)
Look, G. C., Gilzer, D., Preuß, F., Wollenhaupt, J., Nitsche, J., Amaudrut, J., Malancona, S., Montalbetti, C., Caggiano, A. O., & Hamby, M. E. (2026) · ACS Medicinal Chemistry Letters · doi:10.1021/acsmedchemlett.6c00215
Self-citation
Metadata
- Authors
- Di Caro, V., Cho, E., Thiel, J., Lizama, B. N., Koel-Simmelink, M. J. A., Pandey, K., Duong, D., Seyfried, N. T., Grundman, M., Teunissen, C. E., Zetterberg, H., Blennow, K., Caggiano, A. O., & Hamby, M. E.
- Affiliations
- Cognition Therapeutics (United States) (US)
- Amsterdam UMC Location Vrije Universiteit Amsterdam (NL)
- Emory University (US)
- University of California San Diego (US)
- University of Wisconsin–Madison (US)
- Sahlgrenska University Hospital (SE)
- Corresponding author
- Hamby, Mary E.
- ORCID
- Venue
- Alzheimer's Research & Therapy
- Published
- 2026-04-06
- Volume
- 18
- Issue
- 1
- ISSN
- 1758-9193 (ISSN-L)
- PMC
- PMC13182022
- OpenAlex
- W7151006868
- Cited by
- 1
- References
- 44
- Citations by year
- 2026: 1
- FWCI
- 1.66
- Type
- journal article
- Language
- en
- Open access
- gold
- doi.org
- Licence
- Locations
- Alzheimer s Research & Therapy (publishedVersion, cc-by)
- PubMed (publishedVersion)
- PubMed Central (publishedVersion, cc-by)
- Pure Amsterdam UMC (publishedVersion, cc-by)
- DOAJ (DOAJ: Directory of Open Access Journals) (submittedVersion, cc-by-sa)
- Funders
- National Institute on Aging (1R01AG058660)
- Alzheimer's Drug Discovery Foundation
- Topics
- Life Sciences › Neuroscience › Cellular and Molecular Neuroscience › Alzheimer's disease research and treatments
- Health Sciences › Medicine › Psychiatry and Mental health › Dementia and Cognitive Impairment Research
- Life Sciences › Pharmacology, Toxicology and Pharmaceutics › Pharmacology › Pharmacological Receptor Mechanisms and Effects
- Keywords
- Alzheimer's disease, sigma-2 receptor, TMEM97, neuroinflammation, glial fibrillary acidic protein, plasma biomarkers, phosphorylated tau, amyloid-beta, neurofilament light chain, pharmacodynamic biomarkers, dementia with Lewy bodies, amyloid-beta binding, lipid metabolism, immune response, SHINE trial
- MeSH terms
- Neuroinflammatory Diseases, Aged, Alzheimer Disease, Double-Blind Method, Female, Glial Fibrillary Acidic Protein, Humans, Male, Biomarkers, Amyloid beta-Peptides, Proteomics
About these checks
Registry, retraction, Cites and statistics results are computed, not judged, with one exception: a printed reference that no index lists is read once by a model before it counts as a citation error. Claims are extracted by a model and kept only when their quote appears verbatim in the text; each cited source is then checked, with a model’s help, for whether it says what the claim relies on. Those verdicts can be wrong — read the claim’s quote and the cited source before relying on one.
A language model drew the claims from the paper on 2026-11-10, under version 3 of the claim definition (model deepseek-v4.1-flash, prompt extract-v3).
A second model labelled each claim on 2026-11-10 (model jev-1.13-20260917, definition revision gold-guideline-v0.2).
Cited sources are checked with a language model’s help (gpt-6-sol).
Statistics and arithmetic are recomputed, not judged.
Confidence bands are shown only for fields calibrated on our annotated test set. None is calibrated yet, so no band is shown.
What counts as a claim ›How we measure confidence ›How we check this ›
Are you an author, or do you see a problem with this page? Request a review
