Student or educator? Sign up with your school email and get 6 months of Pro free.
Cited by 92

The DOI matches its Crossref record; 11 of the 11 references it cites were found in a registry or an index.

Astrocytes in mouse models of tauopathies acquire early deficits and lose neurosupportive functions

Sidoryk-Wegrzynowicz, Marta, Gerber, Yannick N., Ries, Miriam, Sastre, Magdalena, Tolkovsky, Aviva M., Spillantini, Maria Grazia·2017·Acta Neuropathologica Communications

Overview

The claims and statistics of this paper haven’t been checked yet.

Run the check — free, no account needed. It reads the open-access text and checks the sources it cites.

A few free checks a day · papers already verified open instantly · results are public

Integrity signals

Registry

Crossref · 10.1186/s40478-017-0478-9

Cites

11 of 11 references verified0 citation errors · 0 not checkable

Statistics

Figures

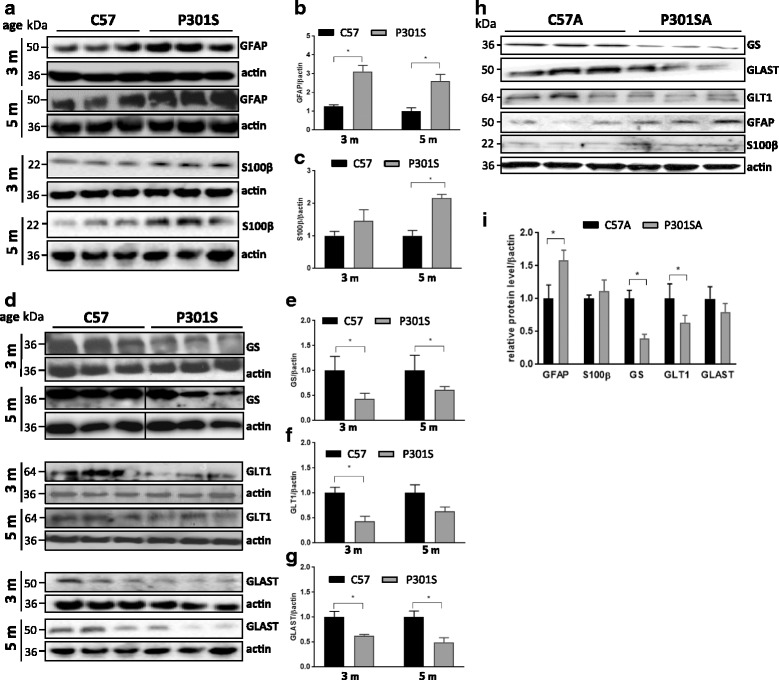
Fig. 1 Astrocytes from P301S mice express more GFAP and S100β and less GS, GLT-1 and GLAST than astrocytes from control mice. a, d Representative blots of astrocyte-specific protein markers related to gliosis/proliferation (GFAP, S100β) and function (glutamine synthetase (GS) and the glutamate transporters (GLT-1 and GLAST)) in the superficial motor cortex of 3 month-old and 5 month-old C57 and P301S mice. h Expression of the same markers in primary pure cultured astrocytes from 7 day-old mice after days 8 in vitro (98% culture confluence). Mean ± SEM, *p < 0.05 vs control; unpaired t test, N = 3 independent experiments (mice: GFAP, S100β (b, c); GLT-1, GLAST, GS (e–g); primary cultures i). Vertical lines in (d) denote point were the picture of the Western blot was assembled from two parts cut from the same blot
Fig. 1 Astrocytes from P301S mice express more GFAP and S100β and less GS, GLT-1 and GLAST than astrocytes from control mice. a, d Representative blots of astrocyte-specific protein markers related to gliosis/proliferation (GFAP, S100β) and function (glutamine synthetase (GS) and the glutamate transporters (GLT-1 and GLAST)) in the superficial motor cortex of 3 month-old and 5 month-old C57 and P301S mice. h Expression of the same markers in primary pure cultured astrocytes from 7 day-old mice after days 8 in vitro (98% culture confluence). Mean ± SEM, *p < 0.05 vs control; unpaired t test, N = 3 independent experiments (mice: GFAP, S100β (b, c); GLT-1, GLAST, GS (e–g); primary cultures i). Vertical lines in (d) denote point were the picture of the Western blot was assembled from two parts cut from the same blotCC BY · PubMed Central
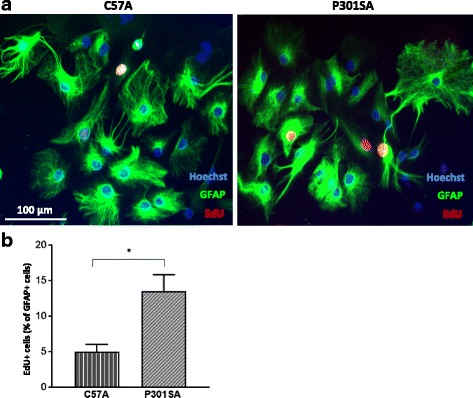
Fig. 2 Astrocytes from P301S mice are more proliferative. Proliferation assay using EdU was performed 1 day after passage of confluent astrocyte cultures from 7 day-old pups. A higher proliferation capacity was observed in P301SA compared to C57A astrocytes. a Representative images where red indicates nuclei undergoing proliferation. b Quantification of proliferating cells, mean ± SEM, *p < 0.05 vs control; statistical analysis was performed using unpaired t test. N = 3 independent experiments where counting from three technical replicates (wells) in which at least three fields per well were analyzed constitute one value for statistical purposes. EdU, 5-ethynyl-2'-deoxyuridine
Fig. 2 Astrocytes from P301S mice are more proliferative. Proliferation assay using EdU was performed 1 day after passage of confluent astrocyte cultures from 7 day-old pups. A higher proliferation capacity was observed in P301SA compared to C57A astrocytes. a Representative images where red indicates nuclei undergoing proliferation. b Quantification of proliferating cells, mean ± SEM, *p < 0.05 vs control; statistical analysis was performed using unpaired t test. N = 3 independent experiments where counting from three technical replicates (wells) in which at least three fields per well were analyzed constitute one value for statistical purposes. EdU, 5-ethynyl-2'-deoxyuridineCC BY · PubMed Central
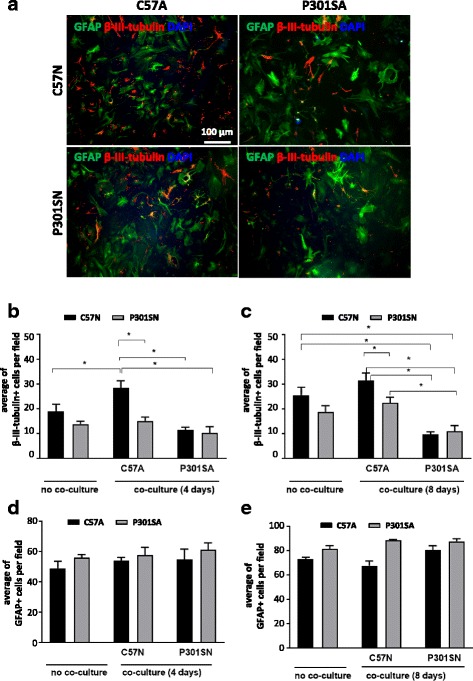
Fig. 3 Astrocytes from P301S mice have a reduced capacity to support neuronal survival. Primary astrocytes (C57A and P301SA) cultured from cerebral cortex of 7 day-old mice (98% purity) were plated on top of primary neurons cultured from mice of similar age and brain region for 4–5 days. Co-cultures were maintained for 4 and 8 days. a Representative images of co-cultures immunostained for β-III-tubulin (red), GFAP (green) and Dapi (blue). Quantification of neuron (b, c) and astrocyte (d, e) numbers after 4 and 8 days of co-culture. Each experiment consisted of six technical replicates (wells) in which at least five fields were analyzed. Data show mean per field ± SEM from at least four independent experiments. Data were analysed using ANOVA followed by Tukey’s multiple comparison test; *p < 0.05 for these comparisons: C57N vs C57N + P301SA; C57N vs P301SN + P301SA; C57N vs C57N + C57A; C57N + C57A vs P301SN + C57A; C57N + C57A vs C57N + P301SA; C57N + C57A vs P301SN + P301SA; P301SN + C57A vs P301SN + P301SA; ANOVA of results from 4 day co-cultures revealed a significant interaction between genotype and co-culture condition [F (2, 21) = 4.477; p = 0.0240], significant effects of co-culture type [F (2, 21) = 14.27; p = 0.0001] and genotype [F (1, 21) = 14.8; p = 0.0009]. In 8 day of co-cultures, ANOVA revealed no interaction between genotype and culture conditions [F (2, 22) = 3.048; p = 0.0678], the significant effect being co-culture type [F (2, 22) = 17.51; p < 0.0001] and co-culture condition [F (1, 22) = 6.54; p = 0.0180]. No significant differences in the numbers of astrocytes were present between the various cultures
Fig. 3 Astrocytes from P301S mice have a reduced capacity to support neuronal survival. Primary astrocytes (C57A and P301SA) cultured from cerebral cortex of 7 day-old mice (98% purity) were plated on top of primary neurons cultured from mice of similar age and brain region for 4–5 days. Co-cultures were maintained for 4 and 8 days. a Representative images of co-cultures immunostained for β-III-tubulin (red), GFAP (green) and Dapi (blue). Quantification of neuron (b, c) and astrocyte (d, e) numbers after 4 and 8 days of co-culture. Each experiment consisted of six technical replicates (wells) in which at least five fields were analyzed. Data show mean per field ± SEM from at least four independent experiments. Data were analysed using ANOVA followed by Tukey’s multiple comparison test; *p < 0.05 for these comparisons: C57N vs C57N + P301SA; C57N vs P301SN + P301SA; C57N vs C57N + C57A; C57N + C57A vs P301SN + C57A; C57N + C57A vs C57N + P301SA; C57N + C57A vs P301SN + P301SA; P301SN + C57A vs P301SN + P301SA; ANOVA of results from 4 day co-cultures revealed a significant interaction between genotype and co-culture condition [F (2, 21) = 4.477; p = 0.0240], significant effects of co-culture type [F (2, 21) = 14.27; p = 0.0001] and genotype [F (1, 21) = 14.8; p = 0.0009]. In 8 day of co-cultures, ANOVA revealed no interaction between genotype and culture conditions [F (2, 22) = 3.048; p = 0.0678], the significant effect being co-culture type [F (2, 22) = 17.51; p < 0.0001] and co-culture condition [F (1, 22) = 6.54; p = 0.0180]. No significant differences in the numbers of astrocytes were present between the various culturesCC BY · PubMed Central
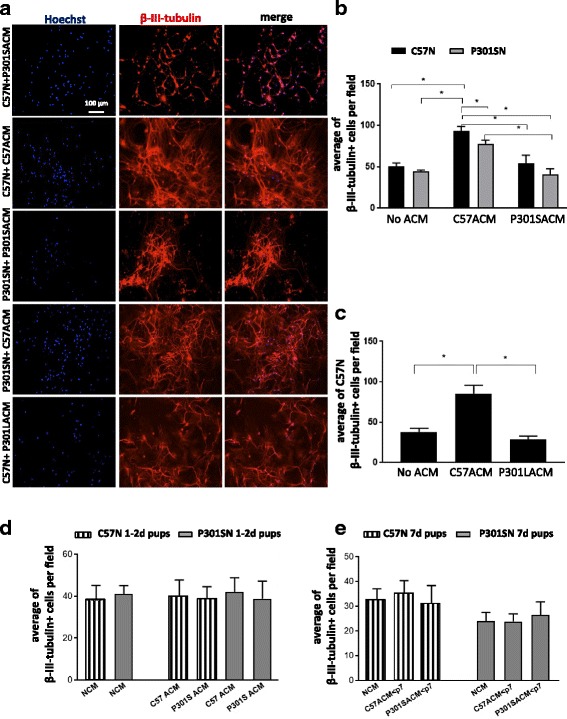
Fig. 4 Astrocytes from P301S and P301L tau mice develop a reduced capacity to support neuronal survival during the first postnatal week. Serum-free medium conditioned by pure astrocytes derived from ≥7 day-old C57, P301S and P301L tau mice over 24 h was centrifuged to remove cellular debris and immediately added to 7 day cultured neurons extracted from 7 day-old mice. After 8 days, cells were fixed, stained with β-III-tubulin and counted. Mean ± SEM of four independent experiments where a single value is from four technical replicates (wells) in which at least five fields per well were analyzed. a Images of neurons treated with the various ACMs as indicated. b ACM from 7 day-old C57 and P301S mice; *p < 0.05 for these comparisons: no ACM C57N vs C57N + C57ACM; no ACM P301SN vs C57N + C57ACM; C57N + C57ACM vs P301SN + C57ACM, C57N + C57ACM vs C57N + P301SACM, C57N + C57ACM vs P301SN + P301SACM, P301SN + C57ACM vs P301SN + P301SACM. c ACM from 7 day-old C57A and P301LA; *p < 0.05 for these comparisons: no ACM C57N vs C57N + C57ACM; C57N + C57ACM vs C57N + P301LACM; Tukey’s multiple comparisons test. For 8 day of cultures, ANOVA revealed no interaction between genotype and culture conditions [F (2, 18) = 1.174; p = 0.3317], significant effect of culture condition [F (2, 18) = 19.73; p = 0.0001] and significant effect of genotype [F (1, 18) = 8.725; p = 0.0085]. d Neurons from 1 to 2 day-old mice were cultured for 4 days after which ACM derived from astrocytes cultured from 1 to 2 day-old mice was added for 4 days. e Neurons from 7 day-old mice were cultured for 4 days after which ACM derived from astrocytes cultured from 1 to 2 day-old mice was added for 4 days. Note that in both cases, there is no difference between the effects of ACMs from C57 or P301S mice. Mean ± SEM from three independent experiments; each value was obtained from four technical replicates (wells) in which at least five fields were examined. Values were analysed by the Mann–Whitney test
Fig. 4 Astrocytes from P301S and P301L tau mice develop a reduced capacity to support neuronal survival during the first postnatal week. Serum-free medium conditioned by pure astrocytes derived from ≥7 day-old C57, P301S and P301L tau mice over 24 h was centrifuged to remove cellular debris and immediately added to 7 day cultured neurons extracted from 7 day-old mice. After 8 days, cells were fixed, stained with β-III-tubulin and counted. Mean ± SEM of four independent experiments where a single value is from four technical replicates (wells) in which at least five fields per well were analyzed. a Images of neurons treated with the various ACMs as indicated. b ACM from 7 day-old C57 and P301S mice; *p < 0.05 for these comparisons: no ACM C57N vs C57N + C57ACM; no ACM P301SN vs C57N + C57ACM; C57N + C57ACM vs P301SN + C57ACM, C57N + C57ACM vs C57N + P301SACM, C57N + C57ACM vs P301SN + P301SACM, P301SN + C57ACM vs P301SN + P301SACM. c ACM from 7 day-old C57A and P301LA; *p < 0.05 for these comparisons: no ACM C57N vs C57N + C57ACM; C57N + C57ACM vs C57N + P301LACM; Tukey’s multiple comparisons test. For 8 day of cultures, ANOVA revealed no interaction between genotype and culture conditions [F (2, 18) = 1.174; p = 0.3317], significant effect of culture condition [F (2, 18) = 19.73; p = 0.0001] and significant effect of genotype [F (1, 18) = 8.725; p = 0.0085]. d Neurons from 1 to 2 day-old mice were cultured for 4 days after which ACM derived from astrocytes cultured from 1 to 2 day-old mice was added for 4 days. e Neurons from 7 day-old mice were cultured for 4 days after which ACM derived from astrocytes cultured from 1 to 2 day-old mice was added for 4 days. Note that in both cases, there is no difference between the effects of ACMs from C57 or P301S mice. Mean ± SEM from three independent experiments; each value was obtained from four technical replicates (wells) in which at least five fields were examined. Values were analysed by the Mann–Whitney testCC BY · PubMed Central
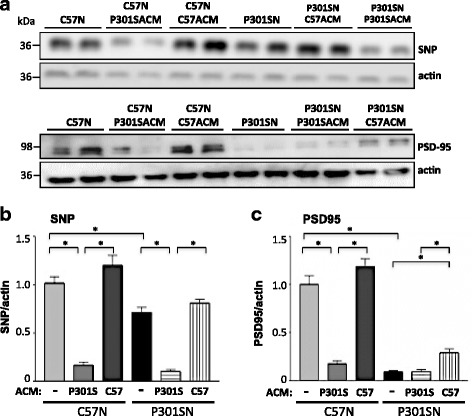
Fig. 5 ACM from P301SA reduces synaptic protein expression in cultured neurons. C57N or P301SN cultures were exposed to C57ACM or P301SACM for 8 days after which cell lysates were analysed by immunoblotting. a Representative immunoblot of synaptophysin (SNP) and PSD95 in neuronal cultures with and without ACM exposure. Note the significant decline of both (b) SNP and (c) PSD95 when C57N or P301SN were cultured with P301SACM compared to neurons maintained in C57ACM. Data were normalised to β actin and represent mean ± SEM of three independent experiments performed in triplicate. *p < 0.05 for these comparisons: C57N vs C57N + P301SACM; C57N + P301SACM vs C57N + C57ACM; P301SN vs P301SN + P301SACM; P301SN vs P301SN + C57ACM; Tukey’s multiple comparisons test both for SNP and PSD95. ANOVA for SNP values revealed a significant interaction between genotype and culture condition [F (2, 12) = 29.88; p = 0.0001], significant effect of genotype [F (1, 12) = 307.2; p = 0.0001] and significant effect of culture treatment [F (2, 12) = 34.68; p = 0.0001]. ANOVA for PSD95 values revealed a significant interaction between genotype and culture condition (ACM) [F (2, 12) = 18.08; p = 0.0002], significant effect of genotype [F (1, 12) = 112.2; p = 0.0001] and culture treatments [F (2, 12) = 37.01; p = 0.0001]
Fig. 5 ACM from P301SA reduces synaptic protein expression in cultured neurons. C57N or P301SN cultures were exposed to C57ACM or P301SACM for 8 days after which cell lysates were analysed by immunoblotting. a Representative immunoblot of synaptophysin (SNP) and PSD95 in neuronal cultures with and without ACM exposure. Note the significant decline of both (b) SNP and (c) PSD95 when C57N or P301SN were cultured with P301SACM compared to neurons maintained in C57ACM. Data were normalised to β actin and represent mean ± SEM of three independent experiments performed in triplicate. *p < 0.05 for these comparisons: C57N vs C57N + P301SACM; C57N + P301SACM vs C57N + C57ACM; P301SN vs P301SN + P301SACM; P301SN vs P301SN + C57ACM; Tukey’s multiple comparisons test both for SNP and PSD95. ANOVA for SNP values revealed a significant interaction between genotype and culture condition [F (2, 12) = 29.88; p = 0.0001], significant effect of genotype [F (1, 12) = 307.2; p = 0.0001] and significant effect of culture treatment [F (2, 12) = 34.68; p = 0.0001]. ANOVA for PSD95 values revealed a significant interaction between genotype and culture condition (ACM) [F (2, 12) = 18.08; p = 0.0002], significant effect of genotype [F (1, 12) = 112.2; p = 0.0001] and culture treatments [F (2, 12) = 37.01; p = 0.0001]CC BY · PubMed Central
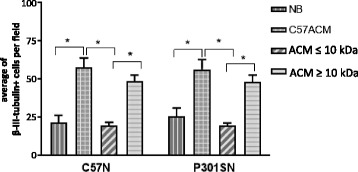
Fig. 6 The active components in C57ACM are macromolecules with a MW above 10 kDa. C57N and P301SN cultures were exposed to complete C57ACM and the same ACM fractionated through a filter with a cut off of ≥10 kDa. The fraction ≥10 kDa (which was diluted to the original volume to offset changes due to concentrating the ACM) or ≤10 kDa was added to the neurons for 8 days. Neurons were counted after immunostaining with the neuronal marker β-III-tubulin. *p < 0.05 for comparisons between number of neurons in: NB vs C57ACM; C57ACM vs C57ACM-10 kDa; C57ACM-10 kDa vs C57ACM + 10 kDa; similar significance was found when C57N or P301SN were treated, statistical analyses was done using Tukey’s multiple comparisons test. ANOVA revealed no interaction on genotype and culture condition (ACM) [F (3, 22 = 0.1457; p = 0.9314], no effect for genotype [F (1, 22) = 0.03553; p = 0.8522] but a significant effect of culture type (ACM) [F (3, 22) = 30.6; p = 0.0001]. The data represent a mean of at least three independent experiments. Each experiment consisted of four technical replicates (wells) in which at least three fields were analyzed
Fig. 6 The active components in C57ACM are macromolecules with a MW above 10 kDa. C57N and P301SN cultures were exposed to complete C57ACM and the same ACM fractionated through a filter with a cut off of ≥10 kDa. The fraction ≥10 kDa (which was diluted to the original volume to offset changes due to concentrating the ACM) or ≤10 kDa was added to the neurons for 8 days. Neurons were counted after immunostaining with the neuronal marker β-III-tubulin. *p < 0.05 for comparisons between number of neurons in: NB vs C57ACM; C57ACM vs C57ACM-10 kDa; C57ACM-10 kDa vs C57ACM + 10 kDa; similar significance was found when C57N or P301SN were treated, statistical analyses was done using Tukey’s multiple comparisons test. ANOVA revealed no interaction on genotype and culture condition (ACM) [F (3, 22 = 0.1457; p = 0.9314], no effect for genotype [F (1, 22) = 0.03553; p = 0.8522] but a significant effect of culture type (ACM) [F (3, 22) = 30.6; p = 0.0001]. The data represent a mean of at least three independent experiments. Each experiment consisted of four technical replicates (wells) in which at least three fields were analyzedCC BY · PubMed Central
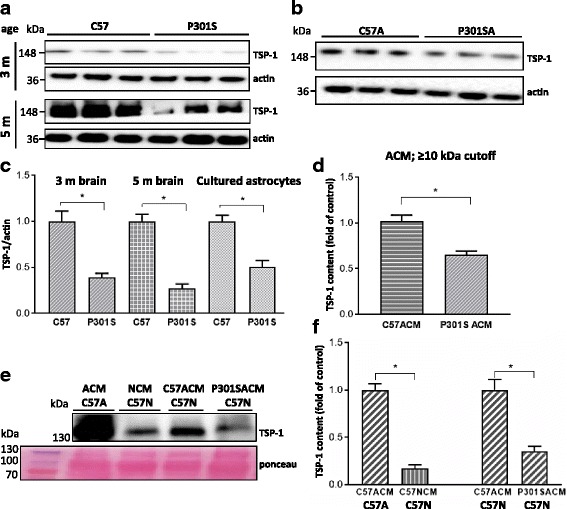
Fig. 7 TSP-1 expression is reduced in the superficial cortex and in cultured astrocytes or ACM from P301S mice. a Lysates from the superficial cortex of 3 and 5 month-old mice or b from astrocytes from 98% pure cultures from 7 day-old mice were analysed for TSP-1 expression by immunoblotting. c Quantitative analysis of TSP-1 expression normalised to actin. Values for C57-derived controls are set to 1. *p < 0.05 for these comparisons: C57 3 m vs P301S 3 m; C57 5 m vs P301S 5 mo; C57A vs P301SA. d Analysis of ACM from C57A or P301SA after fractionation on an Amicon filter with a 10 kDa cutoff. A significant decrease in TSP-1 was observed in P301SACM compared to C57ACM, *p < 0.05; e Representative blot, and f quantification of TSP-1.expression in C57ACM, pure C57 neuronal cultures (C57NCM), and C57 neurons co-cultured with C57ACM or P301SACM. Ponceau S staining of ACM blot to show equal loading. *p < 0.05 for these comparisons: C57N + C57ACM vs C57N + P301SACM. C57A released more TSP-1 than C57N, C57A vs C57N. The data represent a mean of three independent experiments performed in triplicates; mean ± S.E.M, statistical analyses performed with Mann–Whitney test
Fig. 7 TSP-1 expression is reduced in the superficial cortex and in cultured astrocytes or ACM from P301S mice. a Lysates from the superficial cortex of 3 and 5 month-old mice or b from astrocytes from 98% pure cultures from 7 day-old mice were analysed for TSP-1 expression by immunoblotting. c Quantitative analysis of TSP-1 expression normalised to actin. Values for C57-derived controls are set to 1. *p < 0.05 for these comparisons: C57 3 m vs P301S 3 m; C57 5 m vs P301S 5 mo; C57A vs P301SA. d Analysis of ACM from C57A or P301SA after fractionation on an Amicon filter with a 10 kDa cutoff. A significant decrease in TSP-1 was observed in P301SACM compared to C57ACM, *p < 0.05; e Representative blot, and f quantification of TSP-1.expression in C57ACM, pure C57 neuronal cultures (C57NCM), and C57 neurons co-cultured with C57ACM or P301SACM. Ponceau S staining of ACM blot to show equal loading. *p < 0.05 for these comparisons: C57N + C57ACM vs C57N + P301SACM. C57A released more TSP-1 than C57N, C57A vs C57N. The data represent a mean of three independent experiments performed in triplicates; mean ± S.E.M, statistical analyses performed with Mann–Whitney testCC BY · PubMed Central
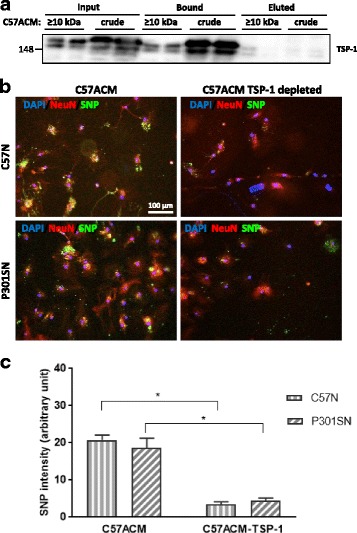
Fig. 8 TSP-1 depletion reduces the synaptogenic effects of C57ACM. a TSP-1 was immunodepleted from crude C57ACM or from the ≥10 kDa fraction and depletion validated by immunoblotting. Blot showsTSP-1 amounts in input, fraction bound to beads, and eluted supernatant after magnetic separation. b Representative pictures of SNP and NeuN immunocytochemistry. Complete ACM and TSP-1-depleted ACM were added to the neuronal cultures for 8 days after which cultures were fixed and immunolabelled with antibodies against SNP and NeuN. c Quantification of SNP intensity. For quantification of staining intensity of SNP in the green channel from three slides for each experimental condition were analysed. Results indicate a mean which corresponds in each case to the mean of four fields. *p < 0.05 for these comparisons: C57N + C57ACM vs C57N + C57ACM-TSP-1; P301SN + C57ACM vs P301SN + C57ACM-TSP-1. Values were analysed using Tukey’s multiple comparisons test. ANOVA revealed no interaction between genotype and culture condition (ACM or ACM-TSP-1) [F (1, 12) = 0.9814; p = 0.3414] but a significant effect was found for genotype [F (1, 12) = 62.94; P < 0.0001] while no effect for culture type [F (1, 12) = 1.476; p = 0.2478]
Fig. 8 TSP-1 depletion reduces the synaptogenic effects of C57ACM. a TSP-1 was immunodepleted from crude C57ACM or from the ≥10 kDa fraction and depletion validated by immunoblotting. Blot showsTSP-1 amounts in input, fraction bound to beads, and eluted supernatant after magnetic separation. b Representative pictures of SNP and NeuN immunocytochemistry. Complete ACM and TSP-1-depleted ACM were added to the neuronal cultures for 8 days after which cultures were fixed and immunolabelled with antibodies against SNP and NeuN. c Quantification of SNP intensity. For quantification of staining intensity of SNP in the green channel from three slides for each experimental condition were analysed. Results indicate a mean which corresponds in each case to the mean of four fields. *p < 0.05 for these comparisons: C57N + C57ACM vs C57N + C57ACM-TSP-1; P301SN + C57ACM vs P301SN + C57ACM-TSP-1. Values were analysed using Tukey’s multiple comparisons test. ANOVA revealed no interaction between genotype and culture condition (ACM or ACM-TSP-1) [F (1, 12) = 0.9814; p = 0.3414] but a significant effect was found for genotype [F (1, 12) = 62.94; P < 0.0001] while no effect for culture type [F (1, 12) = 1.476; p = 0.2478]CC BY · PubMed Central
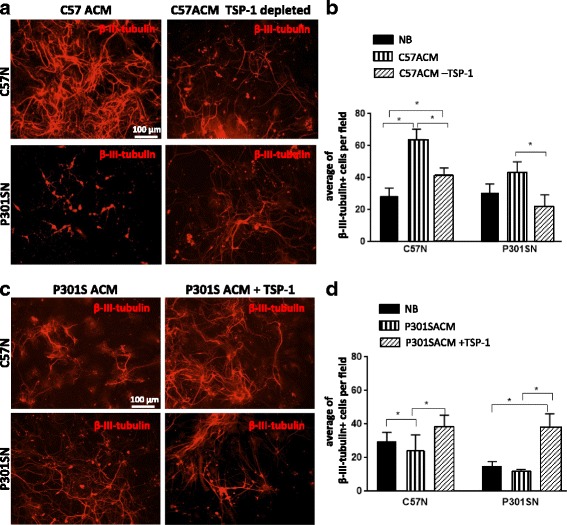
Fig. 9 Effect of TSP-1 depletion of C57ACM or supplementation to P301SACM on neuronal survival. To study the effect of TSP-1 on neuronal survival C57N and P301SN were cultured in (a, b) C57ACM or C57ACM depleted of TSP-1 or (c, d) P301SACM or P301SACM supplemented with TSP-1 for 8 days. a, c Neuronal cultures were fixed and immunolabelled with anti-β-III-tubulin antibody to determine neuronal number. The data represent a mean of three independent experiments. Each experiment consisted of three technical replicates (wells) in which at least three fields were analyzed. b *p < 0.05 for these comparisons: number of neurons in C57N + NB vs C57N + C57ACM; C57N + C57ACM vs C57N + C57ACM-TSP-1; C57N + NB vs C57N + C57ACM-TSP-1; P301SN + C57ACM vs P301SN + C57ACM-TSP-1. d *p < 0.05 for these comparisons: number of neurons in C57N + NB vs C57N + P301SACM; C57N + P301SACM vs C57N + P301SACM + TSP-1; P301SN + NB vs P301SN + P301SACM + TSP-1; P301SN + P301SACM vs P301SN + P301SACM + TSP-1. Results were evaluated with Tukey’s multiple comparisons. For experiments where TSP-1 was depleted ANOVA revealed significant interaction on genotype and culture condition (ACM) [F (2, 12) = 18.01; p = 0.0002], a significant effect for genotype [F (1, 12) = 22.87; p = 0.0004] and significant effect of culture type (ACM) [F (2, 12) = 32.75; p = 0.0001]. For experiments where TSP-1 were added, ANOVA revealed no difference between genotype and culture condition (ACM) [F (2, 12) = 2.524; p = 0.1217], a significant effect of the genotype [F (1, 12) = 9.39; p = 0.0098] and significant effect of culture type (ACM) [F (2, 12) = 32.75; p = 0.0001]
Fig. 9 Effect of TSP-1 depletion of C57ACM or supplementation to P301SACM on neuronal survival. To study the effect of TSP-1 on neuronal survival C57N and P301SN were cultured in (a, b) C57ACM or C57ACM depleted of TSP-1 or (c, d) P301SACM or P301SACM supplemented with TSP-1 for 8 days. a, c Neuronal cultures were fixed and immunolabelled with anti-β-III-tubulin antibody to determine neuronal number. The data represent a mean of three independent experiments. Each experiment consisted of three technical replicates (wells) in which at least three fields were analyzed. b *p < 0.05 for these comparisons: number of neurons in C57N + NB vs C57N + C57ACM; C57N + C57ACM vs C57N + C57ACM-TSP-1; C57N + NB vs C57N + C57ACM-TSP-1; P301SN + C57ACM vs P301SN + C57ACM-TSP-1. d *p < 0.05 for these comparisons: number of neurons in C57N + NB vs C57N + P301SACM; C57N + P301SACM vs C57N + P301SACM + TSP-1; P301SN + NB vs P301SN + P301SACM + TSP-1; P301SN + P301SACM vs P301SN + P301SACM + TSP-1. Results were evaluated with Tukey’s multiple comparisons. For experiments where TSP-1 was depleted ANOVA revealed significant interaction on genotype and culture condition (ACM) [F (2, 12) = 18.01; p = 0.0002], a significant effect for genotype [F (1, 12) = 22.87; p = 0.0004] and significant effect of culture type (ACM) [F (2, 12) = 32.75; p = 0.0001]. For experiments where TSP-1 were added, ANOVA revealed no difference between genotype and culture condition (ACM) [F (2, 12) = 2.524; p = 0.1217], a significant effect of the genotype [F (1, 12) = 9.39; p = 0.0098] and significant effect of culture type (ACM) [F (2, 12) = 32.75; p = 0.0001]CC BY · PubMed Central

Verification

Claims the paper makes

The claims and statistics of this paper haven’t been checked yet.

Run the check — free, no account needed. It reads the open-access text and checks the sources it cites.

A few free checks a day · papers already verified open instantly · results are public

Claims other papers make about this one

Each is checked against this paper’s own text: does it say what the citing paper says it does?

Self-check

Percentages, sums and reported differences re-computed from the paper’s own numbers.

The self-check needs the paper’s full text.

Citations

Cites

Show all 11 references

Research works printed but not linked: 43

  1. Allen B, Ingram E, Takao M, Smith MJ, Jakes R, Virdee K, Yoshida H, Holzer M, Craxton M, et al (2002) Abundant tau filaments and nonapoptotic neurodegeneration in transgenic mice expressing human P301S tau protein. J Neurosci 22:9340–9351 · DOI
  2. Anderson MA, Ao Y, Sofroniew MV (2014) Heterogeneity of reactive astrocytes. Neurosci Lett 565:23–29 · DOI
  3. Araque A, Carmignoto G, Haydon PG (2001) Dynamic signaling between astrocytes and neurons. Annu Rev Physiol 63:795–813 · DOI
  4. Asch AS, Barnwell J, Silverstein RL, Nachman RL (1987) Isolation of the thrombospondin membrane receptor. J Clin Invest 79:1054–1061 · DOI · Paper page
  5. Blurton-Jones M, Kitazawa M, Martinez-Coria H, Castello NA, Muller FJ, Loring JF, Yamasaki TR, Poon WW, Green KN, LaFerla FM (2009) Neural stem cells improve cognition via BDNF in a transgenic model of Alzheimer disease. Proc Natl Acad Sci U S A 106:13594–13599 · DOI
  6. Burbaeva G, Boksha IS, Tereshkina EB, Savushkina OK, Prokhorova TA, Vorobyeva EA (2014) Glutamate and GABA-metabolizing enzymes in post-mortem cerebellum in Alzheimer's disease: phosphate-activated glutaminase and glutamic acid decarboxylase. Cerebellum 13:607–615 · DOI
  7. Chong SA, Benilova I, Shaban H, De Strooper B, Devijver H, Moechars D, Eberle W, Bartic C, Van Leuven F, Callewaert G (2011) Synaptic dysfunction in hippocampus of transgenic mouse models of Alzheimer's disease: a multi-electrode array study. Neurobiol Dis 44:284–291 · DOI
  8. Christopherson KS, Ullian EM, Stokes CC, Mullowney CE, Hell JW, Agah A, Lawler J, Mosher DF, Bornstein P, Barres BA (2005) Thrombospondins are astrocyte-secreted proteins that promote CNS synaptogenesis. Cell 120:421–433 · DOI · Paper page
  9. Conti F, Weinberg RJ (1999) Shaping excitation at glutamatergic synapses. Trends Neurosci 22:451–458 · DOI
  10. Dabir DV, Robinson MB, Swanson E, Zhang B, Trojanowski JQ, Lee VM, Forman MS (2006) Impaired glutamate transport in a mouse model of tau pathology in astrocytes. J Neurosci 26:644–654 · DOI
  11. Delobel P, Lavenir I, Fraser G, Ingram E, Holzer M, Ghetti B, Spillantini MG, Crowther RA, Goedert M (2008) Analysis of tau phosphorylation and truncation in a mouse model of human tauopathy. Am J Pathol 172:123–131 · DOI
  12. El Arfani A, Albertini G, Bentea E, Demuyser T, Van Eeckhaut A, Smolders I, Massie A (2015) Alterations in the motor cortical and striatal glutamatergic system and D-serine levels in the bilateral 6-hydroxydopamine rat model for Parkinson's disease. Neurochem Int 88:88–96 · DOI
  13. Ginsberg SD, Martin LJ, Rothstein JD (1995) Regional deafferentation down-regulates subtypes of glutamate transporter proteins. J Neurochem 65:2800–2803 · DOI
  14. Goedert M, Spillantini MG (2006) A century of Alzheimer's disease. Science 314:777–781 · DOI
  15. Hampton DW, Webber DJ, Bilican B, Goedert M, Spillantini MG, Chandran S (2010) Cell-mediated neuroprotection in a mouse model of human tauopathy. J Neurosci 30:9973–9983 · DOI
  16. Hasel P, Dando O, Jiwaji Z, Baxter P, Todd AC, Heron S, Markus NM, McQueen J, Hampton DW, Torvell M, et al (2017) Neurons and neuronal activity control gene expression in astrocytes to regulate their development and metabolism. Nat Commun 8:15132 · DOI
  17. Hol EM, Pekny M (2015) Glial fibrillary acidic protein (GFAP) and the astrocyte intermediate filament system in diseases of the central nervous system. Curr Opin Cell Biol 32:121–130 · DOI · Paper page
  18. Koh S, Kim N, Yin HH, Harris IR, Dejneka NS, Eroglu C (2015) Human umbilical tissue-derived cells promote synapse formation and Neurite outgrowth via Thrombospondin family proteins. J Neurosci 35:15649–15665 · DOI
  19. Leyns CEG, Holtzman DM (2017) Glial contributions to neurodegeneration in tauopathies. Mol Neurodegener 12:50 · DOI · Paper page
  20. Liauw J, Hoang S, Choi M, Eroglu C, Choi M, Sun GH, Percy M, Wildman-Tobriner B, Bliss T, et al (2008) Thrombospondins 1 and 2 are necessary for synaptic plasticity and functional recovery after stroke. J Cereb Blood Flow Metab 28:1722–1732 · DOI
  21. Lin WL, Lewis J, Yen SH, Hutton M, Dickson DW (2003) Filamentous tau in oligodendrocytes and astrocytes of transgenic mice expressing the human tau isoform with the P301L mutation. Am J Pathol 162:213–218 · DOI
  22. Lu Z, Kipnis J (2010) Thrombospondin 1--a key astrocyte-derived neurogenic factor. FASEB J 24:1925–1934 · DOI
  23. Maurin H, Chong SA, Kraev I, Davies H, Kremer A, Seymour CM, Lechat B, Jaworski T, Borghgraef P, Devijver H, et al (2014) Early structural and functional defects in synapses and myelinated axons in stratum lacunosum moleculare in two preclinical models for tauopathy. PLoS One 9:e87605 · DOI
  24. Mohn TC, Koob AO (2015) Adult Astrogenesis and the etiology of cortical Neurodegeneration. J Exp Neurosci 9:25–34
  25. Norenberg MD, Martinez-Hernandez A (1979) Fine structural localization of glutamine synthetase in astrocytes of rat brain. Brain Res 161:303–310 · DOI
  26. Perego C, Vanoni C, Bossi M, Massari S, Basudev H, Longhi R, Pietrini G (2000) The GLT-1 and GLAST glutamate transporters are expressed on morphologically distinct astrocytes and regulated by neuronal activity in primary hippocampal cocultures. J Neurochem 75:1076–1084 · DOI
  27. Probst A, Gotz J, Wiederhold KH, Tolnay M, Mistl C, Jaton AL, Hong M, Ishihara T, Lee VM, Trojanowski JQ, et al (2000) Axonopathy and amyotrophy in mice transgenic for human four-repeat tau protein. Acta Neuropathol 99:469–481 · DOI
  28. Rama Rao KV, Curtis KM, Johnstone JT, Norenberg MD (2013) Amyloid-beta inhibits thrombospondin 1 release from cultured astrocytes: effects on synaptic protein expression. J Neuropathol Exp Neurol 72:735–744 · DOI
  29. Robinson MB, Jackson JG (2016) Astroglial glutamate transporters coordinate excitatory signaling and brain energetics. Neurochem Int 98:56–71 · DOI
  30. Scattoni ML, Crawley J, Ricceri L (2009) Ultrasonic vocalizations: a tool for behavioural phenotyping of mouse models of neurodevelopmental disorders. Neurosci Biobehav Rev 33:508–515 · DOI
  31. Scattoni ML, Gasparini L, Alleva E, Goedert M, Calamandrei G, Spillantini MG (2010) Early behavioural markers of disease in P301S tau transgenic mice. Behav Brain Res 208:250–257 · DOI
  32. Schindowski K, Bretteville A, Leroy K, Begard S, Brion JP, Hamdane M, Buee L (2006) Alzheimer's disease-like tau neuropathology leads to memory deficits and loss of functional synapses in a novel mutated tau transgenic mouse without any motor deficits. Am J Pathol 169:599–616 · DOI
  33. Sidoryk-Wegrzynowicz M, Lee E, Mingwei N, Aschner M (2011) Disruption of astrocytic glutamine turnover by manganese is mediated by the protein kinase C pathway. Glia 59:1732–1743 · DOI
  34. Spillantini MG, Goedert M (2013) Tau pathology and neurodegeneration. Lancet Neurol 12:609–622 · DOI · Paper page
  35. Spillantini MG, Murrell JR, Goedert M, Farlow MR, Klug A, Ghetti B (1998) Mutation in the tau gene in familial multiple system tauopathy with presenile dementia. Proc Natl Acad Sci U S A 95:7737–7741 · DOI · Paper page
  36. Terwel D, Lasrado R, Snauwaert J, Vandeweert E, Van Haesendonck C, Borghgraef P, Van Leuven F (2005) Changed conformation of mutant tau-P301L underlies the moribund tauopathy, absent in progressive, nonlethal axonopathy of tau-4R/2N transgenic mice. J Biol Chem 280:3963–3973 · DOI
  37. Tyzack GE, Sitnikov S, Barson D, Adams-Carr KL, Lau NK, Kwok JC, Zhao C, Franklin RJ, Karadottir RT, Fawcett JW, et al (2014) Astrocyte response to motor neuron injury promotes structural synaptic plasticity via STAT3-regulated TSP-1 expression. Nat Commun 5:4294 · DOI
  38. Verkhratsky A, Parpura V, Pekna M, Pekny M, Sofroniew M (2014) Glia in the pathogenesis of neurodegenerative diseases. Biochem Soc Trans 42:1291–1301 · DOI · Paper page
  39. Vesce S, Bezzi P, Volterra A (1999) The highly integrated dialogue between neurons and astrocytes in brain function. Sci Prog 82(Pt 3):251–270 · DOI
  40. Xu J, Xiao N, Xia J (2010) Thrombospondin 1 accelerates synaptogenesis in hippocampal neurons through neuroligin 1. Nat Neurosci 13:22–24 · DOI
  41. Yang S, Kuan WL, Spillantini MG (2016) Progressive tauopathy in P301S tau transgenic mice is associated with a functional deficit of the olfactory system. Eur J Neurosci 44:2396–2403 · DOI
  42. Yata K, Oikawa S, Sasaki R, Shindo A, Yang R, Murata M, Kanamaru K, Tomimoto H (2011) Astrocytic neuroprotection through induction of cytoprotective molecules; a proteomic analysis of mutant P301S tau-transgenic mouse. Brain Res 1410:12–23 · DOI
  43. Yonezawa T, Hattori S, Inagaki J, Kurosaki M, Takigawa T, Hirohata S, Miyoshi T, Ninomiya Y (2010) Type IV collagen induces expression of thrombospondin-1 that is mediated by integrin alpha1beta1 in astrocytes. Glia 58:755–767 · DOI

Cited by

Metadata

Authors
Sidoryk-Wegrzynowicz, M., Gerber, Y. N., Ries, M., Sastre, M., Tolkovsky, A. M., & Spillantini, M. G.
Venue
Acta Neuropathologica Communications
Published
2017-12
Volume
5
Issue
1
ISSN
2051-5960
Cited by
92
References
11
Language
en
Funders
  • Alzheimer’s Research UK (RG62844, RG80005)
  • National Centre for the Replacement, Refinement and Reduction of Animals in Research (NC/L000741/1)

About these checks

Registry, retraction, Cites and statistics results are computed, not judged, with one exception: a printed reference that no index lists is read once by a model before it counts as a citation error. Claims are extracted by a model and kept only when their quote appears verbatim in the text; each cited source is then checked, with a model’s help, for whether it says what the claim relies on. Those verdicts can be wrong — read the claim’s quote and the cited source before relying on one.

Statistics and arithmetic are recomputed, not judged.

Confidence bands are shown only for fields calibrated on our annotated test set. None is calibrated yet, so no band is shown.

What counts as a claim ›How we measure confidence ›How we check this ›

Are you an author, or do you see a problem with this page? Request a review

Data sources

Bibliographic data: Semantic Scholar, OpenAlex, Crossref.

Contains information from the Semantic Scholar Academic Graph Datasets, made available under the ODC Attribution License (ODC-BY 1.0).

Semantic Scholar’s data is described in: Kinney, R., et al. (2023). The Semantic Scholar Open Data Platform. arXiv:2301.10140.