

The DOI matches its Crossref record; 78 of the 79 references it cites were found in a registry or an index.
Microglial Interactions with Synapses Are Modulated by Visual Experience
Open accessAbstract
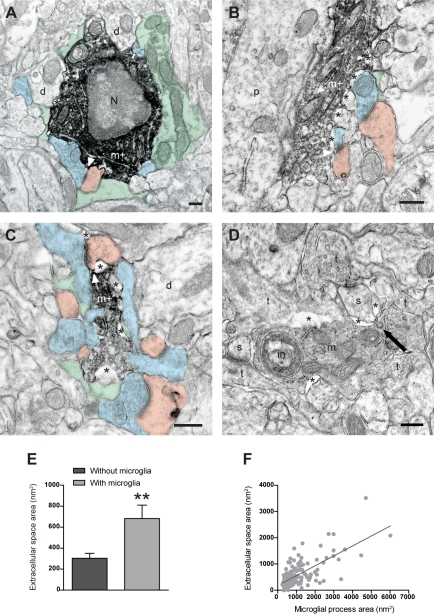
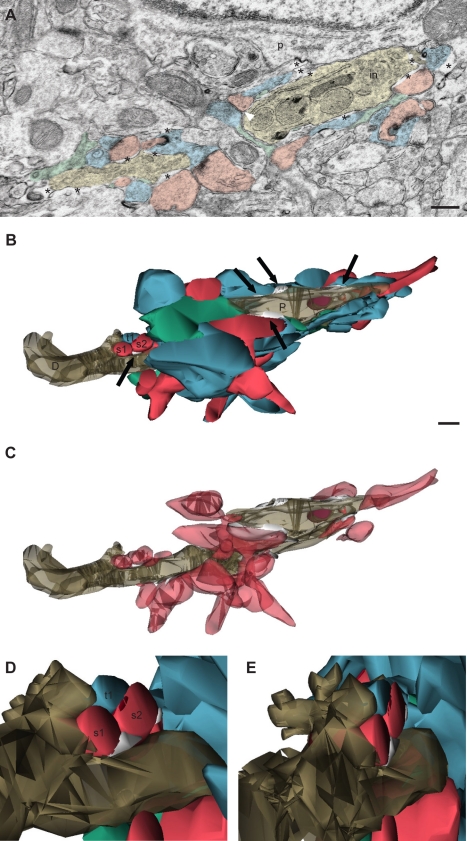
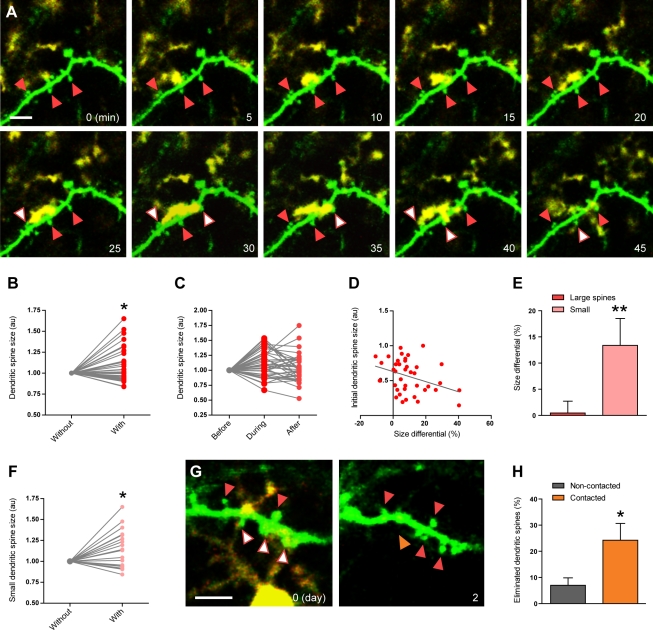
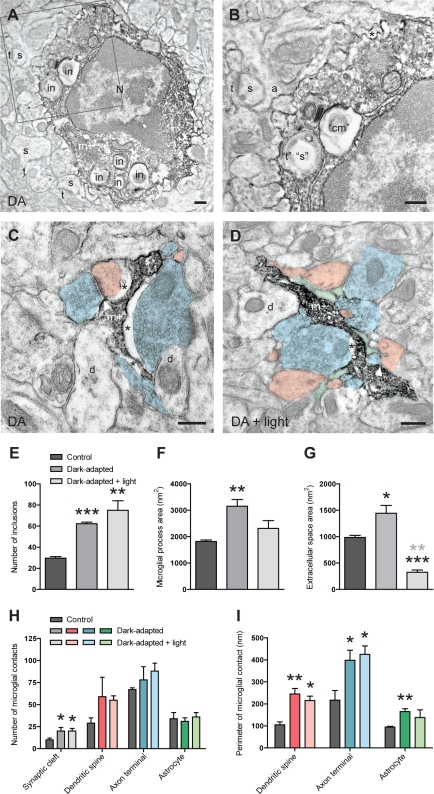
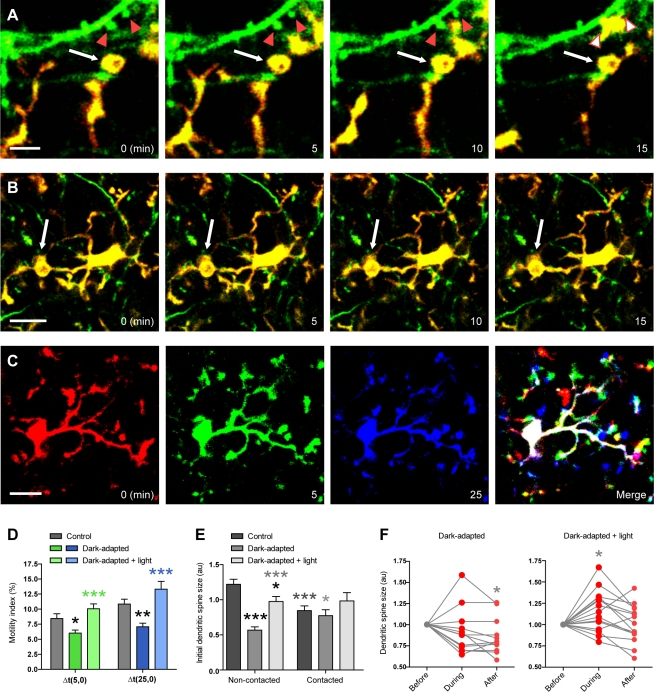
Microglia are the immune cells of the brain. In the absence of pathological insult, their highly motile processes continually survey the brain parenchyma and transiently contact synaptic elements. Aside from monitoring, their physiological roles at synapses are not known. To gain insight into possible roles of microglia in the modification of synaptic structures, we used immunocytochemical electron microscopy, serial section electron microscopy with three-dimensional reconstructions, and two-photon in vivo imaging to characterize microglial interactions with synapses during normal and altered sensory experience, in the visual cortex of juvenile mice. During normal visual experience, most microglial processes displayed direct apposition with multiple synapse-associated elements, including synaptic clefts. Microglial processes were also distinctively surrounded by pockets of extracellular space. In terms of dynamics, microglial processes localized to the vicinity of small and transiently growing dendritic spines, which were typically lost over 2 d. When experience was manipulated through light deprivation and reexposure, microglial processes changed their morphology, showed altered distributions of extracellular space, displayed phagocytic structures, apposed synaptic clefts more frequently, and enveloped synapse-associated elements more extensively. While light deprivation induced microglia to become less motile and changed their preference of localization to the vicinity of a subset of larger dendritic spines that persistently shrank, light reexposure reversed these behaviors. Taken together, these findings reveal different modalities of microglial interactions with synapses that are subtly altered by sensory experience. These findings suggest that microglia may actively contribute to the experience-dependent modification or elimination of a specific subset of synapses in the healthy brain.
Overview
The claims and statistics of this paper haven’t been checked yet.
Run the check — free, no account needed. It reads the open-access text and checks the sources it cites.
Integrity signals
Registry
Cites
Statistics
Figures
Verification
Claims the paper makes
The claims and statistics of this paper haven’t been checked yet.
Run the check — free, no account needed. It reads the open-access text and checks the sources it cites.
Claims other papers make about this one
Each is checked against this paper’s own text: does it say what the citing paper says it does?
In the citing paper
“Microglia have recently been implicated as active participants in brain plasticity per se (42–45).”
From Prolonged Period of Cortical Plasticity upon Redox Dysregulation in Fast-Spiking Interneurons (2015) · cites this paper as [42]
In the citing paper
“microglia participate in experience-dependent remodeling of neural circuits in the normal mature brain by removing extraneous synaptic elements [6, 74–77]”
From Microglial dysfunction in brain aging and Alzheimer's disease (2014) · cites this paper as [74]
In the citing paper
“Microglia also closely monitor neural activity and regulate synaptic plasticity.”
From Adult neurogenesis, glia, and the extracellular matrix (2019) · cites this paper as Tremblay et al., 2010
In the citing paper
“Microglia dynamically interact with neuronal circuits, making direct contacts with synaptic elements1819 in a way that is modulated by experience-dependent changes in neuronal activity19.”
From Microglial P2Y12 is necessary for synaptic plasticity in mouse visual cortex (2016) · cites this paper as [19]
In the citing paper
“The motility of microglial processes and spine contact are actively regulated by sensory experience and are involved in spine elimination (Tremblay et al., 2010).”
From Spatiotemporal dynamics of dendritic spines in the living brain (2014) · cites this paper as Tremblay et al., 2010
In the citing paper
“Another type of glial cells, microglia, have also been found to be in close contact with dendritic spines.”
From Spatiotemporal dynamics of dendritic spines in the living brain (2014) · cites this paper as Tremblay et al., 2010
In the citing paper
“The motility of microglial processes and spine contact are actively regulated by sensory experience and are involved in spine elimination (Tremblay et al., 2010).”
From Spatiotemporal dynamics of dendritic spines in the living brain (2014) · cites this paper as Tremblay et al., 2010
Self-check
Percentages, sums and reported differences re-computed from the paper’s own numbers.
The self-check needs the paper’s full text.
Citations
Cites
The mouse brain in stereotaxic coordinates
Konsman, J. (2003) · Psychoneuroendocrinology · doi:10.1016/s0306-4530(03)00088-x · Cited by 16,796
The Mouse Brain in Stereotaxic Coordinates
Paxinos, G. (2001) · Cited by 12,859
Resting microglial cells are highly dynamic surveillants of brain parenchyma in vivo
Nimmerjahn, A., Kirchhoff, F., & Helmchen, F. (2005) · Science · doi:10.1126/science.1110647 · Cited by 5,827
ATP mediates rapid microglial response to local brain injury in vivo
Davalos, D., Grutzendler, J., Yang, G., Kim, J. V., Zuo, Y., Jung, S., Littman, D. R., Dustin, M. L., & Gan, W.-B. (2005) · Nature Neuroscience · doi:10.1038/nn1472 · Cited by 3,913
Microglia: Active sensor and versatile effector cells in the normal and pathologic brain
Hanisch, U.-K., & Kettenmann, H. (2007) · Nature Neuroscience · doi:10.1038/nn1997 · Cited by 3,676
The Classical Complement Cascade Mediates CNS Synapse Elimination
Stevens, B., Allen, N. J., Vazquez, L. E., Howell, G. R., Christopherson, K. S., Nouri, N., Micheva, K. D., Mehalow, A. K., Huberman, A. D., Stafford, B., et al. (2007) · Cell · doi:10.1016/j.cell.2007.10.036 · Cited by 3,313
mouse brain in stereotaxic coordinates
Franklin, K. B. J., & Paxinos, G. (1997) · Cited by 3,258
Imaging Neuronal Subsets in Transgenic Mice Expressing Multiple Spectral Variants of GFP
Feng, G., Mellor, R. H., Bernstein, M., Keller-Peck, C., Nguyen, Q. T., Wallace, M., Nerbonne, J. M., Lichtman, J. W., & Sanes, J. R. (2000) · Neuron · doi:10.1016/s0896-6273(00)00084-2 · Cited by 3,042
Jung, S., Aliberti, J., Graemmel, P., Sunshine, M. J., Kreutzberg, G. W., Sher, A., & Littman, D. R. (2000) · Molecular and Cellular Biology · doi:10.1128/mcb.20.11.4106-4114.2000 · Cited by 2,632
Structural basis of long-term potentiation in single dendritic spines
Matsuzaki, M., Honkura, N., Ellis-Davies, G. C. R., & Kasai, H. (2004) · Nature · doi:10.1038/nature02617 · Cited by 2,483
Long-term in vivo imaging of experience-dependent synaptic plasticity in adult cortex
Trachtenberg, J. T., Chen, B. E., Knott, G. W., Feng, G., Sanes, J. R., Welker, E., & Svoboda, K. (2002) · Nature · doi:10.1038/nature01273 · Cited by 1,927
Microglial physiology: unique stimuli, specialized responses
Ransohoff, R. M., & Perry, V. H. (2009) · Annual Review of Immunology · doi:10.1146/annurev.immunol.021908.132528 · Cited by 1,858
Tripartite synapses: astrocytes process and control synaptic information
Perea, G., Navarrete, M., & Araque, A. (2009) · Trends in Neurosciences · doi:10.1016/j.tins.2009.05.001 · Cited by 1,820
Reactivation of Ocular Dominance Plasticity in the Adult Visual Cortex
Pizzorusso, T., Medini, P., Berardi, N., Chierzi, S., Fawcett, J. W., & Maffei, L. (2002) · Science · doi:10.1126/science.1072699 · Cited by 1,679
Wake, H., Moorhouse, A. J., Jinno, S., Kohsaka, S., & Nabekura, J. (2009) · The Journal of Neuroscience · doi:10.1523/jneurosci.4363-08.2009 · Cited by 1,619
(1991) · Medical Entomology and Zoology · Cited by 1,512
Microglia-specific localisation of a novel calcium binding protein, Iba1
Ito, D., Imai, Y., Ohsawa, K., Nakajima, K., Fukuuchi, Y., & Kohsaka, S. (1998) · Molecular Brain Research · doi:10.1016/s0169-328x(98)00040-0 · Cited by 1,476
(1976) · Medical Entomology and Zoology · Cited by 1,328
Long-term dendritic spine stability in the adult cortex
Grutzendler, J., Kasthuri, N., & Gan, W.-B. (2002) · Nature · doi:10.1038/nature01276 · Cited by 1,198
Transient and persistent dendritic spines in the neocortex in vivo
Holtmaat, A. J. G. D., Trachtenberg, J. T., Wilbrecht, L., Shepherd, G. M., Zhang, X., Knott, G. W., & Svoboda, K. (2005) · Neuron · doi:10.1016/j.neuron.2005.01.003 · Cited by 1,131
Shrinkage of dendritic spines associated with long-term depression of hippocampal synapses
Zhou, Q., Homma, K. J., & Poo, M.-M. (2004) · Neuron · doi:10.1016/j.neuron.2004.11.011 · Cited by 1,025
Reconstruct : a free editor for serial section microscopy
Fiala, J. C. (2005) · Journal of Microscopy · doi:10.1111/j.1365-2818.2005.01466.x · Cited by 889
Clathrin- and non-clathrin-mediated endocytic regulation of cell signalling
Roy, C. L., & Wrana, J. L. (2005) · Nature Reviews Molecular Cell Biology · doi:10.1038/nrm1571 · Cited by 888
Experience-Dependent Plasticity of Binocular Responses in the Primary Visual Cortex of the Mouse
Gordon, J. A., & Stryker, M. P. (1996) · Journal of Neuroscience · doi:10.1523/jneurosci.16-10-03274.1996 · Cited by 856
Synaptogenesis Via Dendritic Filopodia in Developing Hippocampal Area CA1
Fiala, J. C., Feinberg, M., Popov, V., & Harris, K. M. (1998) · The Journal of Neuroscience · doi:10.1523/jneurosci.18-21-08900.1998 · Cited by 758
Microglia Promote the Death of Developing Purkinje Cells
Marı́n-Teva, J. L., Dusart, I., Colin, C., Gervais, A., van Rooijen, N., & Mallat, M. (2004) · Neuron · doi:10.1016/s0896-6273(04)00069-8 · Cited by 757
Development of long-term dendritic spine stability in diverse regions of cerebral cortex
Zuo, Y., Lin, A., Chang, P., & Gan, W.-B. (2005) · Neuron · doi:10.1016/j.neuron.2005.04.001 · Cited by 684
Immune activation in brain aging and neurodegeneration: too much or too little?
Lucin, K. M., & Wyss-Coray, T. (2009) · Neuron · doi:10.1016/j.neuron.2009.08.039 · Cited by 679
Experience-dependent and cell-type-specific spine growth in the neocortex
Holtmaat, A., Wilbrecht, L., Knott, G. W., Welker, E., & Svoboda, K. (2006) · Nature · doi:10.1038/nature04783 · Cited by 631
Bidirectional Activity-Dependent Morphological Plasticity in Hippocampal Neurons
Nägerl, U. V., Eberhorn, N., Cambridge, S. B., & Bonhoeffer, T. (2004) · Neuron · doi:10.1016/j.neuron.2004.11.016 · Cited by 602
Extracellular matrix molecules and synaptic plasticity
Dityatev, A., & Schachner, M. (2003) · Nature Reviews Neuroscience · doi:10.1038/nrn1115 · Cited by 564
Activity-dependent structural and functional plasticity of astrocyte-neuron interactions
Theodosis, D. T., Poulain, D. A., & Oliet, S. H. R. (2008) · Physiological Reviews · doi:10.1152/physrev.00036.2007 · Cited by 531
A genetically encoded calcium indicator for chronic in vivo two-photon imaging
Mank, M., Santos, A. F., Direnberger, S., Mrsic-Flogel, T. D., Hofer, S. B., Stein, V., Hendel, T., Reiff, D. F., Levelt, C., Borst, A., et al. (2008) · Nature Methods · doi:10.1038/nmeth.1243 · Cited by 475
Philpot, B. D., Sekhar, A. K., Shouval, H., & Bear, M. (2001) · Neuron · doi:10.1016/s0896-6273(01)00187-8 · Cited by 440
Involvement of Iba1 in membrane ruffling and phagocytosis of macrophages/microglia
Ohsawa, K., Imai, Y., Kanazawa, H., Sasaki, Y., & Kohsaka, S. (2000) · Journal of Cell Science · doi:10.1242/jcs.113.17.3073 · Cited by 420
Cell type-specific structural plasticity of axonal branches and boutons in the adult neocortex
De Paola, V., Holtmaat, A., Knott, G., Song, S., Wilbrecht, L., Caroni, P., & Svoboda, K. (2006) · Neuron · doi:10.1016/j.neuron.2006.02.017 · Cited by 419
Choice of cranial window type for in vivo imaging affects dendritic spine turnover in the cortex
Xu, H., Pan, F., Yang, G., & Gan, W. (2007) · Nature Neuroscience · doi:10.1038/nn1883 · Cited by 412
Potentiation of cortical inhibition by visual deprivation
Maffei, A., Nataraj, K., Nelson, S. B., & Turrigiano, G. G. (2006) · Nature · doi:10.1038/nature05079 · Cited by 383
Experience-dependent pruning of dendritic spines in visual cortex by tissue plasminogen activator
Mataga, N., Mizuguchi, Y., & Hensch, T. K. (2004) · Neuron · doi:10.1016/j.neuron.2004.11.028 · Cited by 371
Microglia-Derived Nerve Growth Factor Causes Cell Death in the Developing Retina
Frade, J. M., & Barde, Y. (1998) · Neuron · doi:10.1016/s0896-6273(00)80432-8 · Cited by 341
Evidence for synaptic stripping by cortical microglia
Trapp, B. D., Wujek, J. R., Criste, G. A., Jalabi, W., Yin, X., Kidd, G. J., Stohlman, S. A., & Ransohoff, R. M. (2006) · Glia · doi:10.1002/glia.20462 · Cited by 331
Homeostatic Regulation of Eye-Specific Responses in Visual Cortex during Ocular Dominance Plasticity
Mrsic-Flogel, T. D., Hofer, S. B., Ohki, K., Reid, R. C., Bonhoeffer, T., & Hübener, M. (2007) · Neuron · doi:10.1016/j.neuron.2007.05.028 · Cited by 330
Massive restructuring of neuronal circuits during functional reorganization of adult visual cortex
Keck, T., Mrsic-Flogel, T. D., Vaz Afonso, M., Eysel, U. T., Bonhoeffer, T., & Hübener, M. (2008) · Nature Neuroscience · doi:10.1038/nn.2181 · Cited by 315
The origin and differentiation of microglial cells during development
Cuadros, M. Á. (1998) · Progress in Neurobiology · doi:10.1016/s0301-0082(98)00035-5 · Cited by 305
Dendritic Spine Dynamics Are Regulated by Monocular Deprivation and Extracellular Matrix Degradation
Oray, S., Majewska, A., & Sur, M. (2004) · Neuron · doi:10.1016/j.neuron.2004.12.001 · Cited by 296
Self-citationExtrasynaptic volume transmission and diffusion parameters of the extracellular space
Syková, E. (2004) · Neuroscience · doi:10.1016/j.neuroscience.2004.06.077 · Cited by 270
Remodeling of Synaptic Structure in Sensory Cortical AreasIn Vivo
Majewska, A. K., Newton, J. R., & Sur, M. (2006) · Journal of Neuroscience · doi:10.1523/jneurosci.4454-05.2006 · Cited by 258
Self-citationGoel, A., & Lee, H.-K. (2007) · Journal of Neuroscience · doi:10.1523/jneurosci.5038-06.2007 · Cited by 251
Lang, C., Barco, A., Zablow, L., Kandel, E. R., Siegelbaum, S. A., & Zakharenko, S. S. (2004) · Proceedings of the National Academy of Sciences · doi:10.1073/pnas.0407581101 · Cited by 245
Spine Expansion and Stabilization Associated with Long-Term Potentiation
Yang, Y., Wang, X.-B., Frerking, M., & Zhou, Q. (2008) · The Journal of Neuroscience · doi:10.1523/jneurosci.3998-07.2008 · Cited by 222
Majewska, A. K., & Sur, M. (2003) · Proceedings of the National Academy of Sciences · doi:10.1073/pnas.2636949100 · Cited by 207
Self-citationSynapse elimination accompanies functional plasticity in hippocampal neurons
Bastrikova, N., Gardner, G. A., Reece, J. M., Jeromin, A., & Dudek, S. M. (2008) · Proceedings of the National Academy of Sciences · doi:10.1073/pnas.0800027105 · Cited by 202
Permissive proteolytic activity for visual cortical plasticity
Mataga, N., Nagai, N., & Hensch, T. K. (2002) · Proceedings of the National Academy of Sciences · doi:10.1073/pnas.102088899 · Cited by 179
Extracellular Matrix and Visual Cortical Plasticity
Berardi, N., Pizzorusso, T., & Maffei, L. (2004) · Neuron · doi:10.1016/j.neuron.2004.12.008 · Cited by 177
Morphological studies on neuroglia
Murabe, Y., & Sano, Y. (1982) · Cell and Tissue Research · doi:10.1007/bf00218471 · Cited by 167
A custom-made two-photon microscope and deconvolution system
Majewska, A. K., Yiu, G. C., & Yuste, R. (2000) · Pflügers Archiv - European Journal of Physiology · doi:10.1007/s004240000435 · Cited by 165
Self-citationMorphological studies on neuroglia
Murabe, Y., & Sano, Y. (1982) · Cell and Tissue Research · doi:10.1007/bf00214798 · Cited by 158
In Vivo Simultaneous Tracing and Ca2+ Imaging of Local Neuronal Circuits
Nagayama, S., Zeng, S., Xiong, W., Fletcher, M. L., Masurkar, A. V., Davis, D. J., Pieribone, V. A., & Chen, W. R. (2007) · Neuron · doi:10.1016/j.neuron.2007.02.018 · Cited by 124
Trans-Endocytosis via Spinules in Adult Rat Hippocampus
Špaček, J., & Harris, K. M. (2004) · Journal of Neuroscience · doi:10.1523/jneurosci.0287-04.2004 · Cited by 124
Very Brief Visual Experience Eliminates Plasticity in the Cat Visual Cortex
Mower, G. D., Christen, W. G., & Caplan, C. J. (1983) · Science · doi:10.1126/science.6857278 · Cited by 112
Tissue plasminogen activator mediates reverse occlusion plasticity in visual cortex
Müller, C. M., & Griesinger, C. B. (1998) · Nature Neuroscience · doi:10.1038/248 · Cited by 109
C1q: the perfect complement for a synaptic feast?
Perry, V. H., & O'Connor, V. M. (2008) · Nature reviews. Neuroscience · doi:10.1038/nrn2394 · Cited by 101
Tropea, D., Majewska, A. K., Garcia, R., & Sur, M. (2010) · The Journal of Neuroscience · doi:10.1523/jneurosci.1661-10.2010 · Cited by 92
Self-citationShapiro, L. A., Perez, Z. D., Foresti, M. L., Arisi, G. M., & Ribak, C. E. (2009) · Brain Research · doi:10.1016/j.brainres.2009.02.031 · Cited by 90
The Fine Structure of the Nervous System: The Neurons and Supporting Cells
Doyle, D. (1978) · Journal of Neurology Neurosurgery & Psychiatry · doi:10.1136/jnnp.41.2.191-c · Cited by 71
Localization of EphA4 in axon terminals and dendritic spines of adult rat hippocampus
Tremblay, M., Riad, M., Bouvier, D. S., Murai, K. K., Pasquale, E. B., Descarries, L., & Doucet, G. (2007) · The Journal of Comparative Neurology · doi:10.1002/cne.21263 · Cited by 68
Self-citationAge Changes in the Neuronal Microenvironment
Bondareff, W., & Narotzky, R. (1972) · Science · doi:10.1126/science.176.4039.1135 · Cited by 68
Marker, D. F., Tremblay, M., Lu, S., Majewska, A. K., & Gelbard, H. A. (2010) · Journal of Visualized Experiments · doi:10.3791/2059 · Cited by 63
Self-citationPreparation of Mouse Brain Tissue for Immunoelectron Microscopy
Tremblay, M., Riad, M., & Majewska, A. K. (2010) · Journal of Visualized Experiments · doi:10.3791/2021 · Cited by 55
Self-citationActivation of Microglia during Developmentally Regulated Cell Death in the Cerebral Cortex
Upender, M. B., & Naegele, J. R. (1999) · Developmental Neuroscience · doi:10.1159/000017416 · Cited by 54
Deuchars, J., Li, Y., Kasparov, S., & Paton, J. F. R. (2000) · The Journal of Comparative Neurology · doi:10.1002/(sici)1096-9861(20000207)417:2 · Cited by 54
Developmental course of EphA4 cellular and subcellular localization in the postnatal rat hippocampus
Tremblay, M., Riad, M., Chierzi, S., Murai, K. K., Pasquale, E. B., & Doucet, G. (2008) · The Journal of Comparative Neurology · doi:10.1002/cne.21922 · Cited by 41
Self-citationEffects of dark rearing on phosphorylation of neurotrophin Trk receptors
Viegi, A., Cotrufo, T., Berardi, N., Mascia, L., & Maffei, L. (2002) · European Journal of Neuroscience · doi:10.1046/j.1460-9568.2002.02270.x · Cited by 31
Handbook of neurochemistry and molecular neurobiology : neural protein metabolism and function
Lajtha, Á., & Banik, N. L. (2007) · Digital Access to Libraries (Université catholique de Louvain (UCL), l'Université de Namur (UNamur) and the Université Saint-Louis (USL-B)) · doi:10.1007/978-0-387-30379-6 · Cited by 19
Do spines and dendrites distribute dye evenly?
Svoboda, K. (2004) · Trends in Neurosciences · doi:10.1016/j.tins.2004.05.011 · Cited by 14
Synaptic Mechanisms of Activity-Dependent Remodeling in Visual Cortex during Monocular Deprivation
Rittenhouse, C. D., & Majewska, A. K. (2009) · Journal of Experimental Neuroscience · doi:10.4137/jen.s2559 · Cited by 9
Self-citationPreparation of Mouse Brain Tissue for Immunoelectron Microscopy
Tremblay, M., Riad, M., & Majewska, A. K. (2010) · Journal of Visualized Experiments · doi:10.3791/2021-v · Cited by 8
Self-citationNakanishi, H. (2007) · Springer eBooks · doi:10.1007/978-0-387-30379-6_18 · Cited by 2
Cited by
Sorted by citations
Synaptic Pruning by Microglia Is Necessary for Normal Brain Development
Paolicelli, R. C., Bolasco, G., Pagani, F., Maggi, L., Scianni, M., Panzanelli, P., Giustetto, M., Ferreira, T. A., Guiducci, E., Dumas, L., et al. (2011) · Science · doi:10.1126/science.1202529 · Cited by 4,244
Microglia Sculpt Postnatal Neural Circuits in an Activity and Complement-Dependent Manner
Schafer, D. P., Lehrman, E. K., Kautzman, A. G., Koyama, R., Mardinly, A. R., Yamasaki, R., Ransohoff, R. M., Greenberg, M. E., Barres, B. A., & Stevens, B. (2012) · Neuron · doi:10.1016/j.neuron.2012.03.026 · Cited by 4,089
“To further confirm microglia-mediated phagocytosis of synaptic elements, immunohistochemical electron microscopy (immunoEM) for the microglia marker iba-1 was performed and quantified in the P5 dLGN (Figure 4C; Tremblay et al., 2010b).”
InfluentialKettenmann, H., Hanisch, U.-K., Noda, M., & Verkhratsky, A. (2011) · Physiological Reviews · doi:10.1152/physrev.00011.2010 · Cited by 3,547
Microglia promote learning-dependent synapse formation through brain-derived neurotrophic factor
Parkhurst, C. N., Yang, G., Ninan, I., Savas, J. N., Yates, J. R., Lafaille, J. J., Hempstead, B. L., Littman, D. R., & Gan, W.-B. (2013) · Cell · doi:10.1016/j.cell.2013.11.030 · Cited by 2,599
Microglial M1/M2 polarization and metabolic states
Orihuela, R., McPherson, C. A., & Harry, G. J. (2016) · British Journal of Pharmacology · doi:10.1111/bph.13139 · Cited by 2,070
Metadata
- Authors
- Tremblay, M.-È., Lowery, R. L., & Majewska, A. K.
- Affiliations
- University of Rochester Medicine (US)
- Corresponding author
- Tremblay, Marie-Ève
- Majewska, Ania K.
- Venue
- PLoS Biology
- Publisher
- Public Library of Science (PLoS)
- Published
- 2010-11-02
- Volume
- 8
- Issue
- 11
- Pages
- e1000527
- ISSN
- 1544-9173 (ISSN-L)
- 1545-7885
- PMC
- PMC2970556
- OpenAlex
- W2066943555
- Cited by
- 1,542
- References
- 79
- Citations by year
- 2026: 62 · 2025: 74 · 2024: 127 · 2023: 90 · 2022: 122 · 2021: 145 · 2020: 127 · 2019: 149 · 2018: 107 · 2017: 97 · 2016: 101 · 2015: 95 · 2014: 103 · 2013: 66 · 2012: 48
- FWCI
- 27.48
- Type
- journal article
- Language
- en
- Open access
- gold
- doi.org
- Locations
- PLoS Biology (publishedVersion, cc-by)
- Europe PMC (PubMed Central) (publishedVersion, cc-by)
- PubMed Central (publishedVersion, cc-by)
- PubMed (publishedVersion)
- DOAJ (DOAJ: Directory of Open Access Journals) (submittedVersion, cc-by-sa)
- Figshare (submittedVersion, cc-by)
- Funders
- Burroughs Wellcome Fund
- Alfred P. Sloan Foundation
- University of Rochester
- Stiftung für die Erforschung der Muskelkrankheiten
- National Institutes of Health
- Medical Center, University of Rochester
- National Eye Institute (R01EY019277, EY019277)
- Topics
- Life Sciences › Neuroscience › Neurology › Neuroinflammation and Neurodegeneration Mechanisms
- Life Sciences › Neuroscience › Cellular and Molecular Neuroscience › Neuroscience and Neuropharmacology Research
- Life Sciences › Neuroscience › Developmental Neuroscience › Neurogenesis and neuroplasticity mechanisms
- Keywords
- microglia, synapses, visual cortex, sensory experience, light deprivation, dendritic spines, synaptic cleft, extracellular space, microglial motility, phagocytosis, experience-dependent synaptic plasticity, synaptic pruning, juvenile mice
- MeSH terms
- Animals, Extracellular Space, Microscopy, Electron, Synapses, Vision, Ocular, Microglia, Mice
About these checks
Registry, retraction, Cites and statistics results are computed, not judged, with one exception: a printed reference that no index lists is read once by a model before it counts as a citation error. Claims are extracted by a model and kept only when their quote appears verbatim in the text; each cited source is then checked, with a model’s help, for whether it says what the claim relies on. Those verdicts can be wrong — read the claim’s quote and the cited source before relying on one.
Statistics and arithmetic are recomputed, not judged.
Confidence bands are shown only for fields calibrated on our annotated test set. None is calibrated yet, so no band is shown.
What counts as a claim ›How we measure confidence ›How we check this ›
Are you an author, or do you see a problem with this page? Request a review
