

The DOI matches its Crossref record; 10 of the 10 references it cites were found in a registry or an index.
Cell Fate Decision as High-Dimensional Critical State Transition
Published version of a preprint
Abstract
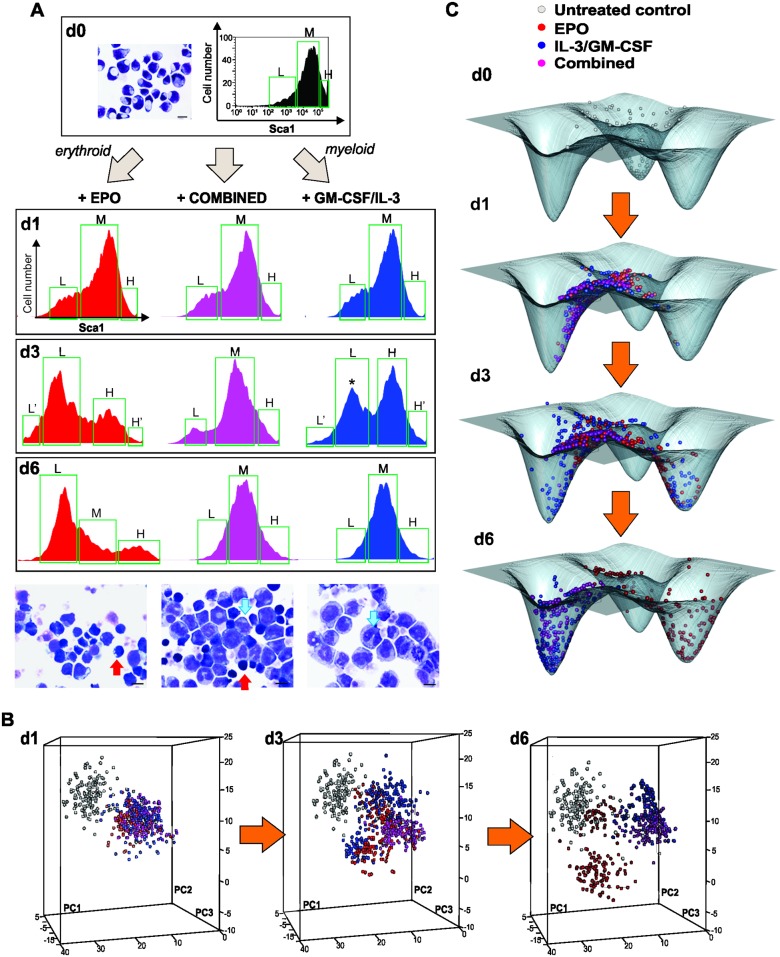
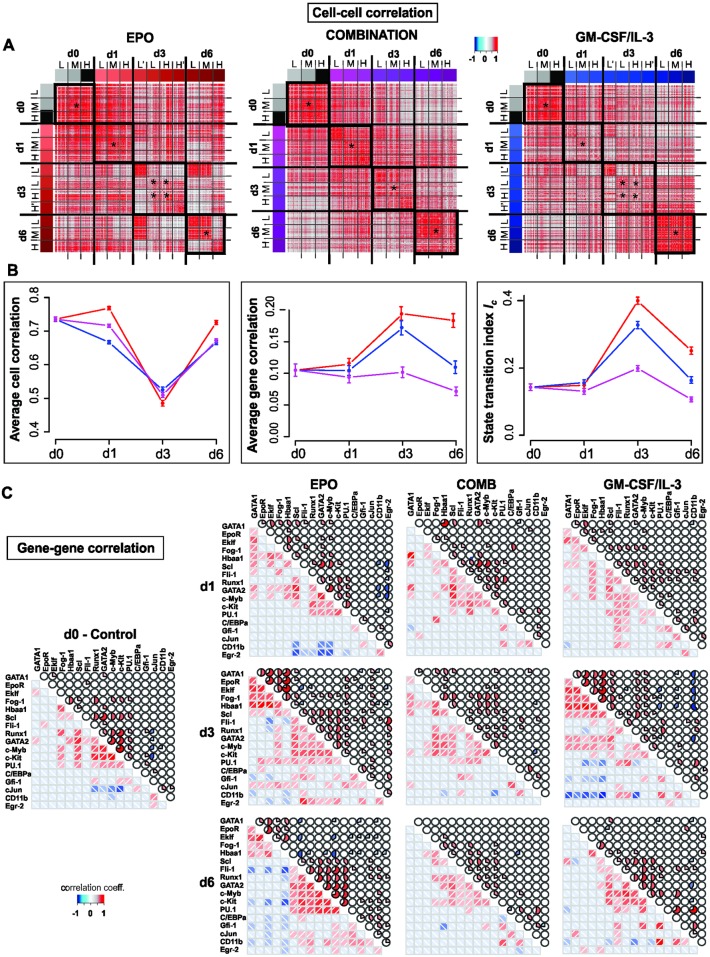
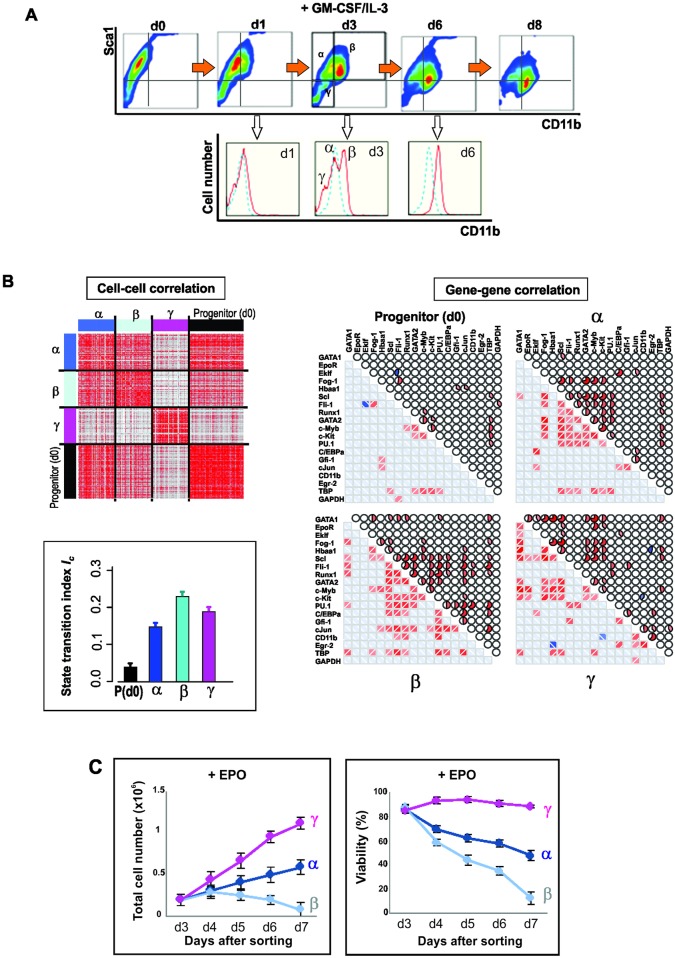
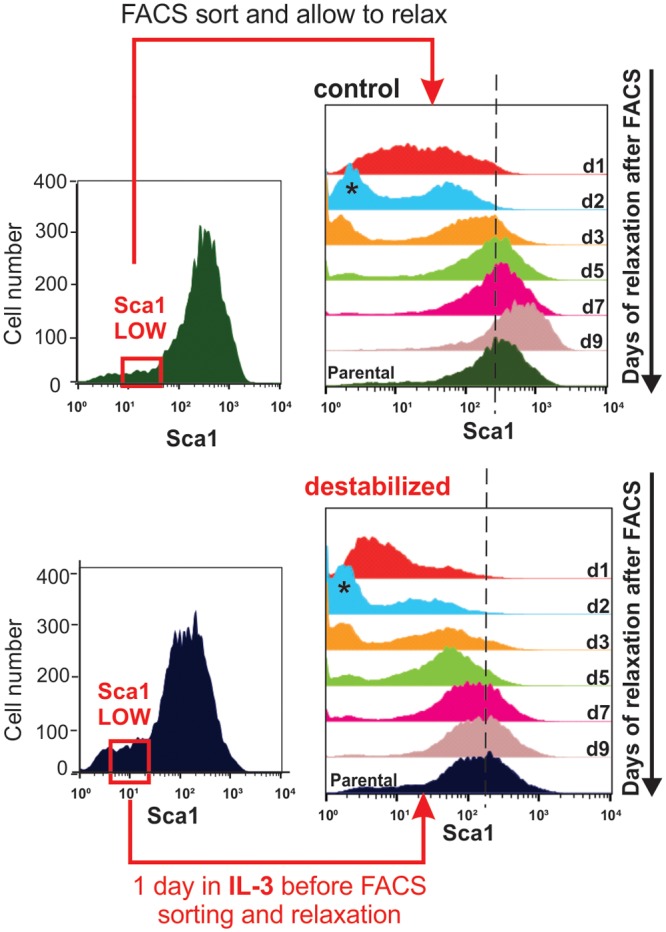
Cell fate choice and commitment of multipotent progenitor cells to a differentiated lineage requires broad changes of their gene expression profile. But how progenitor cells overcome the stability of their gene expression configuration (attractor) to exit the attractor in one direction remains elusive. Here we show that commitment of blood progenitor cells to the erythroid or myeloid lineage is preceded by the destabilization of their high-dimensional attractor state, such that differentiating cells undergo a critical state transition. Single-cell resolution analysis of gene expression in populations of differentiating cells affords a new quantitative index for predicting critical transitions in a high-dimensional state space based on decrease of correlation between cells and concomitant increase of correlation between genes as cells approach a tipping point. The detection of "rebellious cells" that enter the fate opposite to the one intended corroborates the model of preceding destabilization of a progenitor attractor. Thus, early warning signals associated with critical transitions can be detected in statistical ensembles of high-dimensional systems, offering a formal theory-based approach for analyzing single-cell molecular profiles that goes beyond current computational pattern recognition, does not require knowledge of specific pathways, and could be used to predict impending major shifts in development and disease.
Overview
The claims and statistics of this paper haven’t been checked yet.
Run the check — free, no account needed. It reads the open-access text and checks the sources it cites.
Integrity signals
Registry
Cites
Statistics
Figures
Verification
Claims the paper makes
The claims and statistics of this paper haven’t been checked yet.
Run the check — free, no account needed. It reads the open-access text and checks the sources it cites.
Claims other papers make about this one
Each is checked against this paper’s own text: does it say what the citing paper says it does?
In the citing paper
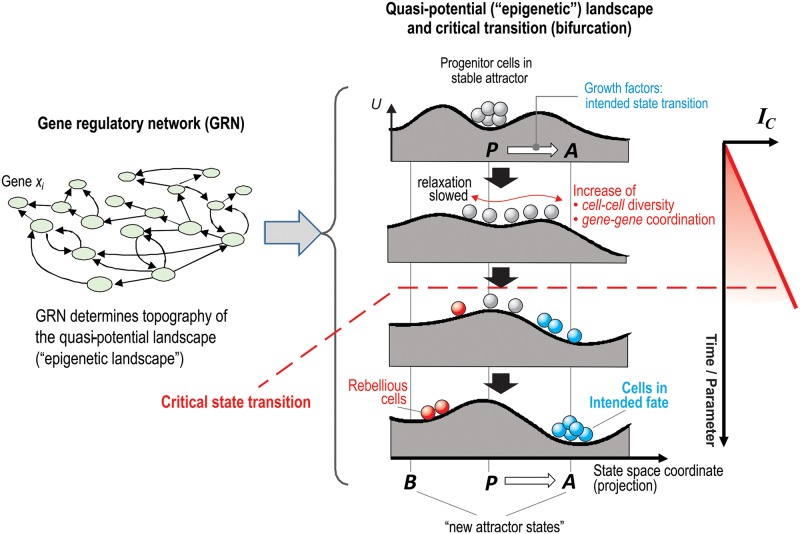
“In fact, GRNs not only explain state transitions, they also underlie the very existence of stable transcriptomic profiles representing cell states (24, 25) (Fig. 1A).”
From Behavior-related gene regulatory networks: A new level of organization in the brain (2020) · cites this paper as [25]
In the citing paper
“Similarly, experimental studies using single-cell transcriptomics have revealed a greater dispersion in expression during differentiation events (35, 36), when deep attractors representing precursor cell types are destabilized and rendered shallower to facilitate state transition (25).”
From Behavior-related gene regulatory networks: A new level of organization in the brain (2020) · cites this paper as [25]
In the citing paper
“This concept has been demonstrated for cell fate decisions by cytokines in cell differentiation (25, 75), and we suggest that analogous dynamics also may play a role in brain development.”
From Behavior-related gene regulatory networks: A new level of organization in the brain (2020) · cites this paper as [25]
Self-check
Percentages, sums and reported differences re-computed from the paper’s own numbers.
The self-check needs the paper’s full text.
Citations
Cites
Single-cell RNA-seq highlights intratumoral heterogeneity in primary glioblastoma
Patel, A. P., Tirosh, I., Trombetta, J. J., Shalek, A. K., Gillespie, S. M., Wakimoto, H., Cahill, D. P., Nahed, B. V., Curry, W. T., Martuza, R. L., et al. (2014) · Science · doi:10.1126/science.1254257 · Cited by 5,063
Early-warning signals for critical transitions
Scheffer, M., Bascompte, J., Brock, W. A., Brovkin, V., Carpenter, S. R., Dakos, V., Held, H., van Nes, E. H., Rietkerk, M., & Sugihara, G. (2009) · Nature · doi:10.1038/nature08227 · Cited by 4,854
The ground state of embryonic stem cell self-renewal
Ying, Q.-L., Wray, J., Nichols, J., Batlle-Morera, L., Doble, B., Woodgett, J., Cohen, P., & Smith, A. (2008) · Nature · doi:10.1038/nature06968 · Cited by 3,442
Anticipating Critical Transitions
Scheffer, M., Carpenter, S. R., Lenton, T. M., Bascompte, J., Brock, W., Dakos, V., van de Koppel, J., van de Leemput, I. A., Levin, S. A., van Nes, E. H., et al. (2012) · Science · doi:10.1126/science.1225244 · Cited by 2,208
RNA sequencing: advances, challenges and opportunities
Ozsolak, F., & Milos, P. M. (2011) · Nature Reviews Genetics · doi:10.1038/nrg2934 · Cited by 2,135 · cited 2×
“IC is particularly useful for single-cell resolution snapshots of molecular profiles, as provided by RNA-seq [34] and CyTOF [35], of statistical ensembles of cells (=cell populations) taken at multiple time intervals during a biological time course.”
MethodReconstructing lineage hierarchies of the distal lung epithelium using single-cell RNA-seq
Treutlein, B., Brownfield, D. G., Wu, A. R., Neff, N. F., Mantalas, G. L., Espinoza, F. H., Desai, T. J., Krasnow, M. A., & Quake, S. R. (2014) · Nature · doi:10.1038/nature13173 · Cited by 1,342
Cell Fates as High-Dimensional Attractor States of a Complex Gene Regulatory Network
Huang, S., Eichler, G., Bar-Yam, Y., & Ingber, D. E. (2005) · Physical Review Letters · doi:10.1103/physrevlett.94.128701 · Cited by 775
Self-citationQuantitative assessment of single-cell RNA-sequencing methods
Wu, A. R., Neff, N. F., Kalisky, T., Dalerba, P., Treutlein, B., Rothenberg, M. E., Mburu, F. M., Mantalas, G. L., Sim, S., Clarke, M. F., et al. (2014) · Nature Methods · doi:10.1038/nmeth.2694 · Cited by 696
Kim, J. K., Kolodziejczyk, A. A., Ilicic, T., Teichmann, S. A., & Marioni, J. C. (2015) · Nature Communications · doi:10.1038/ncomms9687 · Cited by 251
Inferring rules of lineage commitment in haematopoiesis
Pina, C., Fugazza, C., Tipping, A. J., Brown, J., Soneji, S., Teles, J., Peterson, C., & Enver, T. (2012) · Nature Cell Biology · doi:10.1038/ncb2442 · Cited by 162 · cited 1×
“Individual cells can, due to noisy gene expression fluctuations, transiently 47 approach the border of the attractor in one or several dimensions and thereby be 48 transiently “primed” to exit the basin of attraction, and by chance or biased by external 49 conditions, differentiate into one of the predestined lineage…”
Background
Research works printed but not linked: 38
- BD Macarthur, 2009, Systems biology of stem cell fate and cellular reprogramming, Nat Rev Mol Cell Biol, 10, 672, 10.1038/nrm2766 · DOI · Paper page
- S Huang, 2010, Cell lineage determination in state space: a systems view brings flexibility to dogmatic canonical rules, PLoS Biol, 8, 1
- J Wray, 2010, The ground state of pluripotency, Biochem Soc Trans, 38, 1027, 10.1042/BST0381027 · DOI
- HH Chang, 2008, Transcriptome-wide noise controls lineage choice in mammalian progenitor cells, Nature, 453, 544, 10.1038/nature06965 · DOI
- SR Hough, 2009, A continuum of cell states spans pluripotency and lineage commitment in human embryonic stem cells, PLoS ONE, 4, e7708, 10.1371/journal.pone.0007708 · DOI
- S Kauffman, 1969, Homeostasis and differentiation in random genetic control networks, Nature, 224, 177, 10.1038/224177a0 · DOI · Paper page
- S Huang, 2007, Bifurcation dynamics of cell fate decision in bipotent progenitor cells, Dev Biol, 305, 695, 10.1016/j.ydbio.2007.02.036 · DOI · Paper page
- D Kaplan, 1995, Understanding Nonlinear Dynamics, 10.1007/978-1-4612-0823-5 · DOI
- C Trefois, 2015, Critical transitions in chronic disease: transferring concepts from ecology to systems medicine, Curr Opin Biotechnol, 34, 48, 10.1016/j.copbio.2014.11.020 · DOI
- V Chickarmane, 2008, A computational model for understanding stem cell, trophectoderm and endoderm lineage determination, PLoS ONE, 3, e3478, 10.1371/journal.pone.0003478 · DOI
- C Duff, 2011, Mathematical modelling of stem cell differentiation: the PU.1-GATA-1 interaction, J Math Biol, 64, 449, 10.1007/s00285-011-0419-3 · DOI
- JE Ferrell, 2012, Bistability, bifurcations, and Waddington's epigenetic landscape, Current biology, 22, R458, 10.1016/j.cub.2012.03.045 · DOI
- MJ Jolly, 2014, Towards elucidating the connection between epithelial-mesenchymal transitions and stemness, J R Soc Interface, 11, 20140962, 10.1098/rsif.2014.0962 · DOI
- C. Furusawa, 2012, A dynamical-systems view of stem cell biology, Science, 338, 215, 10.1126/science.1224311 · DOI
- M Pal, 2014, Non-genetic heterogeneity, criticality and cell differentiation, Phys Biol, 12, 016001, 10.1088/1478-3975/12/1/016001 · DOI
- L Chen, 2012, Detecting early-warning signals for sudden deterioration of complex diseases by dynamical network biomarkers, Sci Rep, 2, 18, 10.1038/srep00342 · DOI · Paper page
- S Tsai, 1994, Lymphohematopoietic pro-genitors immortalized by a retroviral vector harboring a dominant-negative ret-inoic acid receptor can recapitulate lymphoid, myeloid, and erythroid develop-ment, Genes Dev, 8, 2831, 10.1101/gad.8.23.2831 · DOI
- F Paul, 2015, Transcriptional Heterogeneity and Lineage Commitment in Myeloid Progenitors, Cell, 163, 1663, 10.1016/j.cell.2015.11.013 · DOI · Paper page
- D Grun, 2014, Validation of noise models for single-cell transcriptomics, Nature methods, 11, 637, 10.1038/nmeth.2930 · DOI · Paper page
- GK Marinov, 2014, From single-cell to cell-pool transcriptomes: stochasticity in gene expression and RNA splicing, Genome Res, 24, 496, 10.1101/gr.161034.113 · DOI · Paper page
- JX Zhou, 2015, Quasi-potential landscape in complex multi—stable systems, J R Soc Interface, 12, 1
- CH Waddington, 1956, Principles of Embryology, 10.5962/bhl.title.7217 · DOI
- AN Gorban, 2010, Correlations, risk and crisis: From physiology to finance, Phys A Stat Mech. its Appl, 389, 3193, 10.1016/j.physa.2010.03.035 · DOI
- J Wang, 2010, The potential landscape of genetic circuits imposes the arrow of time in stem cell differentiation, Biophys J, 99, 29, 10.1016/j.bpj.2010.03.058 · DOI
- A Giuliani, 2014, Statistical Mechanics of Gene Expression Networks: Increasing Connectivity as a Response to Stressful Condition, Adv Syst Biol, 3, 1
- A Giuliani, 2014, Invariant features of metabolic networks: a data analysis application on scaling properties of biochemical pathways, Physica A, 337, 157
- T Enver, 1998, Do stem cells play dice?, Blood, 92, 358, 10.1182/blood.V92.2.348 · DOI
- T Enver, 2009, Instructions writ in blood, Nature, 461, 10.1038/461183a · DOI · Paper page
- RL Coffman, 1999, Instruction, selection, or tampering with the odds?, Science, 284, 1283, 10.1126/science.284.5418.1283 · DOI
- RE Callard, 2007, Decision-making by the immune response, Immunol. Cell Biol, 85, 300, 10.1038/sj.icb.7100060 · DOI
- AJ Veraart, 2012, Corrigendum: Recovery rates reflect distance to a tipping point in a living system, Nature, 484, 404, 10.1038/nature11029 · DOI
- D Metcalf, 1999, Stem cells, pre-progenitor cells and lineage-committed cells: Are our dogmas correct?, Ann N Y Acad Sci, 872, 289, 10.1111/j.1749-6632.1999.tb08473.x · DOI
- M Ogawa, 1989, Hemopoietic stem cells: stochastic differentiation and humoral control of prolifera-tion, Environ Health Perspect, 80, 199, 10.1289/ehp.8980199 · DOI
- GS Eichler, 2003, Gene Expression Dynamics Inspector (GEDI): for integrative analysis of expression profiles, Bioinformatics, 19, 2321, 10.1093/bioinformatics/btg307 · DOI
- D Metcalf, 1998, Lineage commitment and maturation in hematopoietic cells: the case for extrinsic regulation, Blood, 92, 345, 10.1182/blood.V92.2.345b · DOI
- C Marr, 2016, Single-cell gene expression profiling and cell state dynamics: collecting data, correlating data points and connecting the dots, Curr Opin Biotechnol, 39, 207, 10.1016/j.copbio.2016.04.015 · DOI · Paper page
- JX Zhou, 2011, Understanding gene circuits at cell-fate branch points for rational cell reprogramming, Trends Genet, 27, 55, 10.1016/j.tig.2010.11.002 · DOI
- P Liu, 2007, Imperfect transcritical and pitchfork bifurcations, J Funct Anal, 251, 573, 10.1016/j.jfa.2007.06.015 · DOI
Cited by
Single-cell entropy for accurate estimation of differentiation potency from a cell’s transcriptome
Teschendorff, A. E., & Enver, T. (2017) · Nature Communications · doi:10.1038/ncomms15599 · Cited by 346
Challenges in measuring and understanding biological noise
Eling, N., Morgan, M. D., & Marioni, J. C. (2019) · Nature Reviews Genetics · doi:10.1038/s41576-019-0130-6 · Cited by 247
Bargaje, R., Trachana, K., Shelton, M. N., McGinnis, C. S., Zhou, J. X., Chadick, C., Cook, S., Cavanaugh, C., Huang, S., & Hood, L. (2017) · Proceedings of the National Academy of Sciences · doi:10.1073/pnas.1621412114 · Cited by 115
Self-citationEling, N., Richard, A. C., Richardson, S., Marioni, J. C., & Vallejos, C. A. (2018) · Cell Systems · doi:10.1016/j.cels.2018.06.011 · Cited by 99
Behavior-related gene regulatory networks: A new level of organization in the brain
Sinha, S., Jones, B. M., Traniello, I. M., Bukhari, S. A., Halfon, M. S., Hofmann, H. A., Huang, S., Katz, P. S., Keagy, J., Lynch, V. J., et al. (2020) · Proceedings of the National Academy of Sciences · doi:10.1073/pnas.1921625117 · Cited by 85
Self-citationTransition state characteristics during cell differentiation
Brackston, R. D., Lakatos, E., & Stumpf, M. P. H. (2018) · PLOS Computational Biology · doi:10.1371/journal.pcbi.1006405 · Cited by 67
Taking Systems Medicine to Heart
Trachana, K., Bargaje, R., Glusman, G., Price, N. D., Huang, S., & Hood, L. E. (2018) · Circulation Research · doi:10.1161/circresaha.117.310999 · Cited by 41
Self-citationSenescence: A program in the road to cell elimination and cancer
Moiseeva, O., Guillon, J., & Ferbeyre, G. (2022) · Seminars in Cancer Biology · doi:10.1016/j.semcancer.2020.12.017 · Cited by 25
Ventre, E., Espinasse, T., Bréhier, C.-E., Calvez, V., Lepoutre, T., & Gandrillon, O. (2021) · Journal of Mathematical Biology · doi:10.1007/s00285-021-01684-1 · Cited by 17
Metadata
- Authors
- Mojtahedi, M., Skupin, A., Zhou, J., Castaño, I. G., Leong-Quong, R. Y. Y., Chang, H., Trachana, K., Giuliani, A., & Huang, S.
- Venue
- PLOS Biology
- Publisher
- Public Library of Science (PLoS)
- Published
- 2016-12-27
- Volume
- 14
- Issue
- 12
- Pages
- e2000640
- ISSN
- 1545-7885
- PMC
- PMC5189937
- Cited by
- 350
- References
- 10
- Language
- en
About these checks
Registry, retraction, Cites and statistics results are computed, not judged, with one exception: a printed reference that no index lists is read once by a model before it counts as a citation error. Claims are extracted by a model and kept only when their quote appears verbatim in the text; each cited source is then checked, with a model’s help, for whether it says what the claim relies on. Those verdicts can be wrong — read the claim’s quote and the cited source before relying on one.
Statistics and arithmetic are recomputed, not judged.
Confidence bands are shown only for fields calibrated on our annotated test set. None is calibrated yet, so no band is shown.
What counts as a claim ›How we measure confidence ›How we check this ›
Are you an author, or do you see a problem with this page? Request a review
Data sources
Bibliographic data: Semantic Scholar, OpenAlex, Crossref.
Contains information from the Semantic Scholar Academic Graph Datasets, made available under the ODC Attribution License (ODC-BY 1.0).
Semantic Scholar’s data is described in: Kinney, R., et al. (2023). The Semantic Scholar Open Data Platform. arXiv:2301.10140.
