

The DOI matches its Crossref record; 59 of the 59 references it cites were found in a registry or an index.
The structural coverage of the human proteome before and after AlphaFold
Open accessPublished version of a preprint
Abstract
The protein structure field is experiencing a revolution. From the increased throughput of techniques to determine experimental structures, to developments such as cryo-EM that allow us to find the structures of large protein complexes or, more recently, the development of artificial intelligence tools, such as AlphaFold, that can predict with high accuracy the folding of proteins for which the availability of homology templates is limited. Here we quantify the effect of the recently released AlphaFold database of protein structural models in our knowledge on human proteins. Our results indicate that our current baseline for structural coverage of 48%, considering experimentally-derived or template-based homology models, elevates up to 76% when including AlphaFold predictions. At the same time the fraction of dark proteome is reduced from 26% to just 10% when AlphaFold models are considered. Furthermore, although the coverage of disease-associated genes and mutations was near complete before AlphaFold release (69% of Clinvar pathogenic mutations and 88% of oncogenic mutations), AlphaFold models still provide an additional coverage of 3% to 13% of these critically important sets of biomedical genes and mutations. Finally, we show how the contribution of AlphaFold models to the structural coverage of non-human organisms, including important pathogenic bacteria, is significantly larger than that of the human proteome. Overall, our results show that the sequence-structure gap of human proteins has almost disappeared, an outstanding success of direct consequences for the knowledge on the human genome and the derived medical applications.
Overview
The claims and statistics of this paper haven’t been checked yet.
Run the check — free, no account needed. It reads the open-access text and checks the sources it cites.
Integrity signals
Registry
Cites
Statistics
Figures
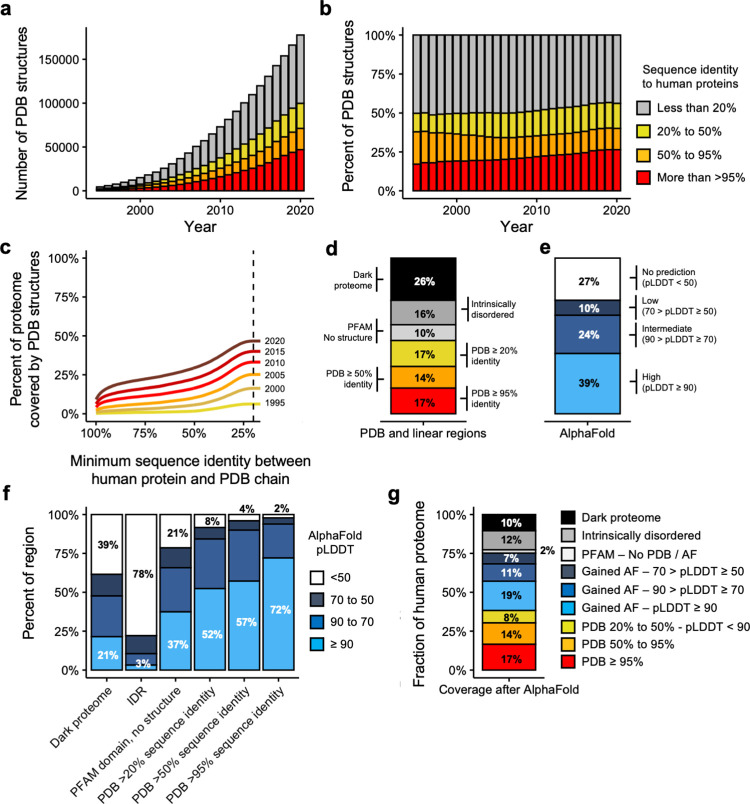
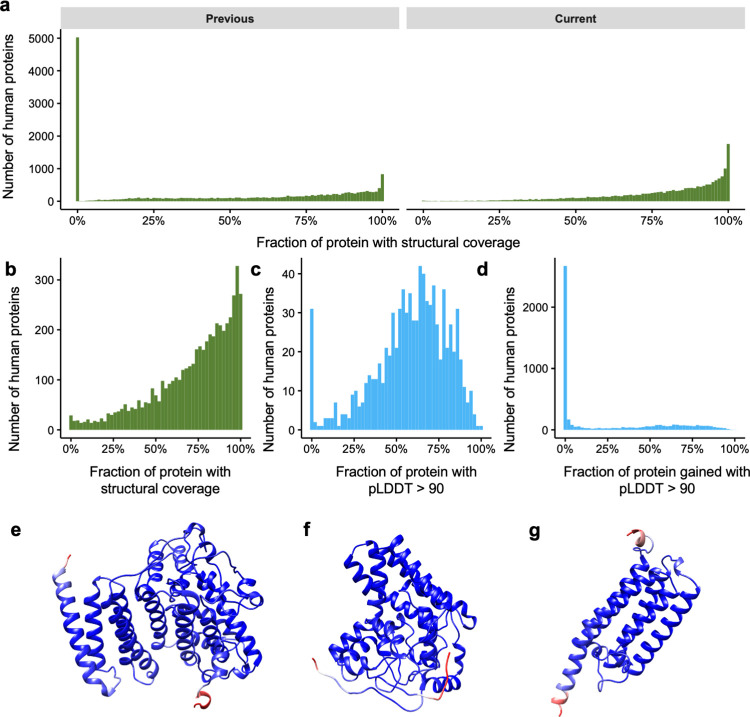
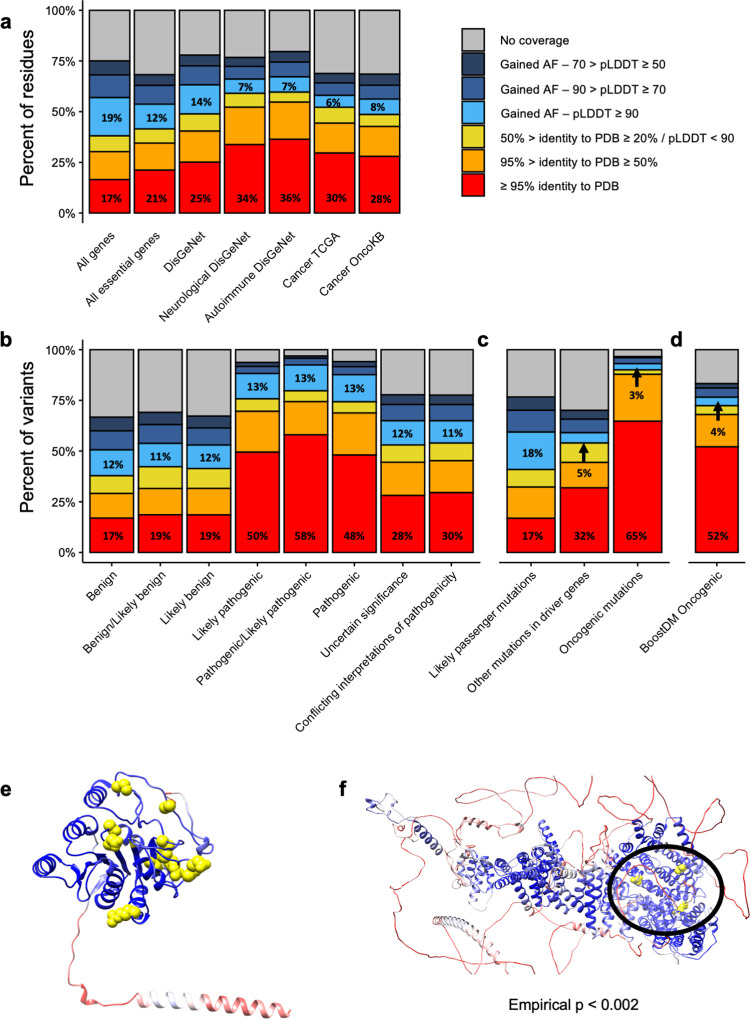
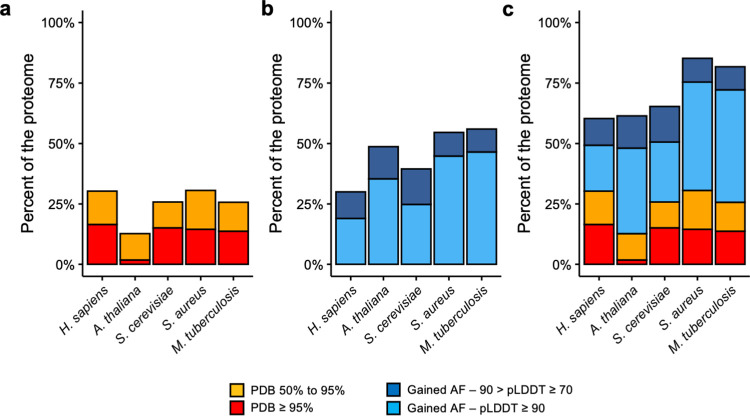
Verification
Claims the paper makes
The claims and statistics of this paper haven’t been checked yet.
Run the check — free, no account needed. It reads the open-access text and checks the sources it cites.
Claims other papers make about this one
Each is checked against this paper’s own text: does it say what the citing paper says it does?
In the citing paper
“after AlphaFold2, the structural coverage of the human proteome increased from 48% to 76% of the total residues).131”
From Advancing Targeted Protein Degradation via Multiomics Profiling and Artificial Intelligence (2023) · cites this paper as [131]
Self-check
Percentages, sums and reported differences re-computed from the paper’s own numbers.
The self-check needs the paper’s full text.
Citations
Cites
Basic local alignment search tool
Altschul, S. F., Gish, W., Miller, W., Myers, E. W., & Lipman, D. J. (1990) · Journal of Molecular Biology · doi:10.1006/jmbi.1990.9999 · Cited by 98,669
UCSF Chimera—A visualization system for exploratory research and analysis
Pettersen, E. F., Goddard, T. D., Huang, C. C., Couch, G. S., Greenblatt, D. M., Meng, E. C., & Ferrin, T. E. (2004) · Journal of Computational Chemistry · doi:10.1002/jcc.20084 · Cited by 46,047
Highly accurate protein structure prediction with AlphaFold
Jumper, J., Evans, R., Pritzel, A., Green, T., Figurnov, M., Ronneberger, O., Tunyasuvunakool, K., Bates, R., Žídek, A., Potapenko, A., et al. (2021) · Nature · doi:10.1038/s41586-021-03819-2 · Cited by 43,764
Berman, H. M. (2000) · Nucleic Acids Research · doi:10.1093/nar/28.1.235 · Cited by 40,196
Comparative Protein Modelling by Satisfaction of Spatial Restraints
Šali, A., & Blundell, T. L. (1993) · Journal of Molecular Biology · doi:10.1006/jmbi.1993.1626 · Cited by 12,977
Analysis of protein-coding genetic variation in 60,706 humans
Exome Aggregation Consortium, Lek, M., Karczewski, K. J., Minikel, E. V., Samocha, K. E., Banks, E., Fennell, T., O’Donnell-Luria, A. H., Ware, J. S., Hill, A. J., et al. (2016) · Nature · doi:10.1038/nature19057 · Cited by 9,587
The Ensembl Variant Effect Predictor
McLaren, W., Gil, L., Hunt, S. E., Riat, H. S., Ritchie, G. R. S., Thormann, A., Flicek, P., & Cunningham, F. (2016) · Genome Biology · doi:10.1186/s13059-016-0974-4 · Cited by 8,099
Pfam: The protein families database in 2021
Mistry, J., Chuguransky, S., Williams, L., Qureshi, M., Salazar, G. A., Sonnhammer, E. L. L., Tosatto, S. C. E., Paladin, L., Raj, S., Richardson, L. J., et al. (2021) · Nucleic Acids Research · doi:10.1093/nar/gkaa913 · Cited by 7,452
UniProt: the universal protein knowledgebase in 2021
The UniProt Consortium, Bateman, A., Martin, M.-J., Orchard, S., Magrane, M., Agivetova, R., Ahmad, S., Alpi, E., Bowler-Barnett, E. H., Britto, R., et al. (2021) · Nucleic Acids Research · doi:10.1093/nar/gkaa1100 · Cited by 6,372
Accurate prediction of protein structures and interactions using a 3-track network
Baek, M., DiMaio, F., Anishchenko, I., Dauparas, J., Ovchinnikov, S., Lee, G. R., Wang, J., Cong, Q., Kinch, L. N., Schaeffer, R. D., et al. (2021) · doi:10.1101/2021.06.14.448402 · Cited by 5,549
Cited by
Sorted by citations
Dali server: structural unification of protein families
Holm, L. (2022) · Nucleic Acids Research · doi:10.1093/nar/gkac387 · Cited by 934
Terwilliger, T. C., Liebschner, D., Croll, T. I., Williams, C. J., McCoy, A. J., Poon, B. K., Afonine, P. V., Oeffner, R. D., Richardson, J. S., Read, R. J., et al. (2024) · Nature Methods · doi:10.1038/s41592-023-02087-4 · Cited by 411
Before and after AlphaFold2: An overview of protein structure prediction
Bertoline, L. M. F., Lima, A. N., Krieger, J. E., & Teixeira, S. K. (2023) · Frontiers in Bioinformatics · doi:10.3389/fbinf.2023.1120370 · Cited by 330
AlphaFold, Artificial Intelligence (AI), and Allostery
Nussinov, R., Zhang, M., Liu, Y., & Jang, H. (2022) · The Journal of Physical Chemistry B · doi:10.1021/acs.jpcb.2c04346 · Cited by 190
Intrinsic protein disorder and conditional folding in AlphaFoldDB
Piovesan, D., Monzon, A. M., & Tosatto, S. C. E. (2022) · Protein Science · doi:10.1002/pro.4466 · Cited by 160
DisProt in 2024: improving function annotation of intrinsically disordered proteins
Aspromonte, M. C., Nugnes, M. V., Quaglia, F., Bouharoua, A., Sagris, V., Promponas, V. J., Chasapi, A., Fichó, E., Balatti, G. E., Parisi, G. D., et al. (2023) · Nucleic Acids Research · doi:10.1093/nar/gkad928 · Cited by 147
AlphaFold2 reveals commonalities and novelties in protein structure space for 21 model organisms
Bordin, N., Sillitoe, I., Nallapareddy, V., Rauer, C., Lam, S. D., Waman, V. P., Sen, N., Heinzinger, M., Littmann, M., Kim, S., et al. (2023) · Communications Biology · doi:10.1038/s42003-023-04488-9 · Cited by 103
Bartolec, T. K., Vázquez-Campos, X., Norman, A. R., Luong, C., Johnson, M., Payne, R. J., Wilkins, M. R., Mackay, J. P., & Low, J. K. K. (2023) · Proceedings of the National Academy of Sciences · doi:10.1073/pnas.2219418120 · Cited by 83
Machine learning solutions for predicting protein–protein interactions
Casadio, R., Martelli, P. L., & Savojardo, C. (2022) · Wiley Interdisciplinary Reviews Computational Molecular Science · doi:10.1002/wcms.1618 · Cited by 83
Piper, S. J., Johnson, R. M., Wootten, D. L., & Sexton, P. M. (2022) · Chemical Reviews · doi:10.1021/acs.chemrev.1c00837 · Cited by 78
Novel machine learning approaches revolutionize protein knowledge
Bordin, N., Dallago, C., Heinzinger, M., Kim, S., Littmann, M., Rauer, C., Steinegger, M., Rost, B., & Orengo, C. (2023) · Trends in Biochemical Sciences · doi:10.1016/j.tibs.2022.11.001 · Cited by 72
Overview of AlphaFold2 and breakthroughs in overcoming its limitations
Wang, L., Wen, Z., Liu, S.-W., Zhang, L., Finley, C., Lee, H., & Fan, H. (2024) · Computers in Biology and Medicine · doi:10.1016/j.compbiomed.2024.108620 · Cited by 56
Advancing Targeted Protein Degradation via Multiomics Profiling and Artificial Intelligence
Duran-Frigola, M., Cigler, M., & Winter, G. E. (2023) · Journal of the American Chemical Society · doi:10.1021/jacs.2c11098 · Cited by 50
Structure-Based Drug Design with a Deep Hierarchical Generative Model
Weller, J. A., & Rohs, R. (2024) · Journal of Chemical Information and Modeling · doi:10.1021/acs.jcim.4c01193 · Cited by 47
Malhotra, Y., John, J., Yadav, D., Sharma, D., Vanshika, Rawal, K., Mishra, V., & Chaturvedi, N. (2025) · Computers in Biology and Medicine · doi:10.1016/j.compbiomed.2025.109842 · Cited by 42
Artificial intelligence powers protein-folding predictions
Eisenstein, M. S. (2021) · Nature · doi:10.1038/d41586-021-03499-y · Cited by 42
Liu, Y., Yeung, W. S. B., Chiu, P. C. N., & Cao, D. (2022) · Frontiers in Genetics · doi:10.3389/fgene.2022.981005 · Cited by 44
Caswell, R. C., Gunning, A. C., Owens, M., Ellard, S., & Wright, C. F. (2022) · Genome Medicine · doi:10.1186/s13073-022-01082-2 · Cited by 42
Malbranke, C., Bikard, D., Cocco, S., Monasson, R., & Tubiana, J. (2023) · Current Opinion in Structural Biology · doi:10.1016/j.sbi.2023.102571 · Cited by 40
McCafferty, C. L., Pennington, E. L., Papoulas, O., Taylor, D. W., & Marcotte, E. M. (2023) · Communications Biology · doi:10.1038/s42003-023-04773-7 · Cited by 35
Digging into the 3D Structure Predictions of AlphaFold2 with Low Confidence: Disorder and Beyond
Bruley, A., Mornon, J., Duprat, É., & Callebaut, I. (2022) · Biomolecules · doi:10.3390/biom12101467 · Cited by 37
Classification of domains in predicted structures of the human proteome
Schaeffer, R. D., Zhang, J., Kinch, L. N., Pei, J., Cong, Q., & Grishin, N. V. (2023) · Proceedings of the National Academy of Sciences · doi:10.1073/pnas.2214069120 · Cited by 36
Beyond sequence: Structure-based machine learning
Durairaj, J., de Ridder, D., & van Dijk, A. D. J. (2022) · Computational and Structural Biotechnology Journal · doi:10.1016/j.csbj.2022.12.039 · Cited by 32
Mutz, P., Resch, W., Faure, G., Senkevich, T. G., Koonin, E. V., & Moss, B. (2023) · mBio · doi:10.1128/mbio.00408-23 · Cited by 26
Sen, N., Anishchenko, I., Bordin, N., Sillitoe, I., Velankar, S., Baker, D., & Orengo, C. (2022) · Briefings in Bioinformatics · doi:10.1093/bib/bbac187 · Cited by 25
ECOD domain classification of 48 whole proteomes from AlphaFold Structure Database using DPAM2
Schaeffer, R. D., Zhang, J., Medvedev, K. E., Kinch, L. N., Cong, Q., & Grishin, N. V. (2024) · PLOS Computational Biology · doi:10.1371/journal.pcbi.1011586 · Cited by 22
The druggable genome: Twenty years later
Radoux, C. J., Vianello, F., McGreig, J. E., Desai, N., & Bradley, A. R. (2022) · Frontiers in Bioinformatics · doi:10.3389/fbinf.2022.958378 · Cited by 26
Structural coverage of the human interactome
Kosoglu, K., Aydin, Z., Tuncbag, N., Gursoy, A., & Keskin, O. (2023) · Briefings in Bioinformatics · doi:10.1093/bib/bbad496 · Cited by 21
Badonyi, M., & Marsh, J. A. (2025) · Nature Communications · doi:10.1038/s41467-025-63234-3 · Cited by 19
“Although pathogenic missense mutations are highly enriched in structured regions 96 , this limitation excludes certainvariants,e.g.,thoseinshortlinearmotifs 97 .”
Deciphering the functional landscape of phosphosites with deep neural network
Liang, Z. T., Liu, T., Li, Q., Zhang, G., Zhang, B., Du, X.-K., Liu, J., Chen, Z., Ding, H., Hu, G., et al. (2023) · Cell Reports · doi:10.1016/j.celrep.2023.113048 · Cited by 19
VHH Structural Modelling Approaches: A Critical Review
Vishwakarma, P., Vattekatte, A. M., Shinada, N. K., Diharce, J., Martins, C., Cadet, F., Gardebien, F., Etchebest, C., Nadaradjane, A. A., & de Brevern, A. G. (2022) · International Journal of Molecular Sciences · doi:10.3390/ijms23073721 · Cited by 19
GalaxySagittarius-AF: Predicting Targets for Drug-Like Compounds in the Extended Human 3D Proteome
Kwon, S., Jung, N., Yang, J., & Seok, C. (2024) · Journal of Molecular Biology · doi:10.1016/j.jmb.2024.168617 · Cited by 18
An ensemble 3D deep-learning model to predict protein metal-binding site
Mohamadi, A., Cheng, T., Jin, L., Wang, J., Sun, H., & Koohi‐Moghadam, M. (2022) · Cell Reports Physical Science · doi:10.1016/j.xcrp.2022.101046 · Cited by 18
Protein structure-based evaluation of missense variants: Resources, challenges and future directions
David, A., & Sternberg, M. J. E. (2023) · Current Opinion in Structural Biology · doi:10.1016/j.sbi.2023.102600 · Cited by 18
An outlook on structural biology after A lpha F old: tools, limits and perspectives
Rosignoli, S., Pacelli, M., Manganiello, F., & Paiardini, A. (2024) · FEBS Open Bio · doi:10.1002/2211-5463.13902 · Cited by 21
Fukunishi, Y., Higo, J., & Kasahara, K. (2022) · Biophysical Reviews · doi:10.1007/s12551-022-01015-8 · Cited by 18
The protein structurome of Orthornavirae and its dark matter
Mutz, P., Camargo, A. P., Sahakyan, H., Neri, U., Butković, A., Wolf, Y. I., Krupovìč, M., Dolja, V. V., & Koonin, E. V. (2024) · mBio · doi:10.1128/mbio.03200-24 · Cited by 18
Toward the appropriate interpretation of Alphafold2
Xu, T., Xu, Q., & Li, J. (2023) · Frontiers in Artificial Intelligence · doi:10.3389/frai.2023.1149748 · Cited by 16
Mining folded proteomes in the era of accurate structure prediction
Bayly-Jones, C., & Whisstock, J. C. (2022) · PLOS Computational Biology · doi:10.1371/journal.pcbi.1009930 · Cited by 16
Bruley, A., Bitard‐Feildel, T., Callebaut, I., & Duprat, É. (2022) · Proteins Structure Function and Bioinformatics · doi:10.1002/prot.26441 · Cited by 18
Ramasamy, P., Zuallaert, J., Martens, L., & Vranken, W. F. (2026) · Protein Science · doi:10.1002/pro.70376 · Cited by 15
Manen-Freixa, L., & Antolín, A. A. (2024) · Expert Opinion on Drug Discovery · doi:10.1080/17460441.2024.2376643 · Cited by 15
Evaluation of AlphaFold2 Structures for Hit Identification across Multiple Scenarios
Gu, S., Yang, Y., Zhao, Y., Qiu, J., Wang, X., Tong, H. H. Y., Liu, L., Wan, X., Liu, H., Hou, T., et al. (2024) · Journal of Chemical Information and Modeling · doi:10.1021/acs.jcim.3c01976 · Cited by 14
No dance, no partner! A tale of receptor flexibility in docking and virtual screening
Basciu, A., Callea, L., Motta, S., Bonvin, A. M. J. J., Bonati, L., & Vargiu, A. V. (2022) · Annual reports in medicinal chemistry · doi:10.1016/bs.armc.2022.08.006 · Cited by 14
Rosenkranz, A. A., & Slastnikova, T. A. (2023) · Pharmaceutics · doi:10.3390/pharmaceutics15030987 · Cited by 14
Integrating Large-Scale Protein Structure Prediction into Human Genetics Research
Marrero, M. C., Jänes, J., Baptista, D., & Beltrão, P. (2024) · Annual Review of Genomics and Human Genetics · doi:10.1146/annurev-genom-120622-020615 · Cited by 13
McCaffrey, P., Jackups, R., Seheult, J. N., Zaydman, M. A., Balis, U. J., Thaker, H. M., Rashidi, H. H., & Gullapalli, R. R. (2024) · Archives of Pathology & Laboratory Medicine · doi:10.5858/arpa.2024-0208-ra · Cited by 14
ProCyon: A multimodal foundation model for protein phenotypesPreprint
Queen, O., Huang, Y., Calef, R., Giunchiglia, V., Chen, T., Dasoulas, G., Tai, L., Abbadessa, G., Howell, O., Li, M. M., et al. (2024) · bioRxiv (Cold Spring Harbor Laboratory) · doi:10.1101/2024.12.10.627665 · Cited by 14
Zhao, H.-F., Zhang, H., She, Z., Gao, Z., Wang, Q., Geng, Z. Z., & Dong, Y. (2023) · International Journal of Molecular Sciences · doi:10.3390/ijms24032740 · Cited by 12
Combining NMR, SAXS and SANS to characterize the structure and dynamics of protein complexes
Delhommel, F., Martínez‐Lumbreras, S., & Sattler, M. (2022) · Methods in enzymology on CD-ROM/Methods in enzymology · doi:10.1016/bs.mie.2022.09.020 · Cited by 11
Hunter, G. A., & Ferreira, G. C. (2022) · Frontiers in Molecular Biosciences · doi:10.3389/fmolb.2022.920668 · Cited by 11
An agnostic analysis of the human AlphaFold2 proteome using local protein conformations
de Brevern, A. G. (2022) · Biochimie · doi:10.1016/j.biochi.2022.11.009 · Cited by 12
Predicting therapeutic and side effects from drug binding affinities to human proteome structures
Sawada, R., Sakajiri, Y., Shibata, T., & Yamanishi, Y. (2024) · iScience · doi:10.1016/j.isci.2024.110032 · Cited by 12
PyPCN: protein contact networks in PyMOL
Rosignoli, S., Paola, L. D., & Paiardini, A. (2023) · Bioinformatics · doi:10.1093/bioinformatics/btad675 · Cited by 10
Structural biology in variant interpretation: Perspectives and practices from two studies
Varga, M. J., Richardson, M. E., & Chamberlin, A. C. (2025) · The American Journal of Human Genetics · doi:10.1016/j.ajhg.2025.03.010 · Cited by 10
Chakraborty, C., Bhattacharya, M., & Lee, S.-S. (2026) · Frontiers in Artificial Intelligence · doi:10.3389/frai.2026.1739303 · Cited by 11
Hatano, Y., Ishihara, T., & Onodera, O. (2023) · BMC Bioinformatics · doi:10.1186/s12859-023-05338-5 · Cited by 10
Li, S., Ren, P., Wang, L., Han, Q., Li, F., Li, H., & Bai, F. (2025) · Acta Pharmacologica Sinica · doi:10.1038/s41401-024-01444-z · Cited by 9
Wu, W., Cui, C., Zhu, Y., Chen, J., Zhuang, Q., Wang, Y., Liu, Z., Gao, H., Ou, G.-Z., Liu, C., et al. (2026) · Cell Research · doi:10.1038/s41422-026-01220-0 · Cited by 9
Sakamoto, K., Asano, S., Ago, Y., & Hirokawa, T. (2022) · Biochemical and Biophysical Research Communications · doi:10.1016/j.bbrc.2022.10.071 · Cited by 9
Cen, L., Ng, T. K., Ji, J., Lin, J., Yao, Y., Yang, R., Dong, G., Cao, Y., Chen, C., Yao, S., et al. (2023) · Database · doi:10.1093/database/baad083 · Cited by 9
Targeting transcription factors through an IMiD independent zinc finger domain
Liu, B. H., Liu, M., Radhakrishnan, S., Dai, M.-Y., Jaladanki, C. K., Gao, C., Tang, J. P., Kumari, K., Go, M. L., Vu, K. A. L., et al. (2025) · EMBO Molecular Medicine · doi:10.1038/s44321-025-00241-3 · Cited by 8
“These models have been useful in drug discovery (Flower and Hurley, 2021), identifying pathogenic mutations (Bryant et al, 2022), and to investigate protein – protein interactions (Porta-Pardo et al, 2022).”
Deep Learning Approaches for the Prediction of Protein Functional Sites
Pitarch, B., & Pazos, F. (2025) · Molecules · doi:10.3390/molecules30020214 · Cited by 7
Bias in the AlphaFold3 prediction of ligand-induced domain motion in enzymes
Yu, H., Bekar-Cesaretli, A. A., Lazou, M., Kozakov, D., Joseph‐McCarthy, D., & Vajda, S. (2026) · Proceedings of the National Academy of Sciences · doi:10.1073/pnas.2530709123 · Cited by 7
Structural and functional prediction, evaluation, and validation in the post-sequencing era
Li, C., Luo, Y., Xie, Y., Zhang, Z., Liu, Y., Zou, L., & Xiao, F. (2023) · Computational and Structural Biotechnology Journal · doi:10.1016/j.csbj.2023.12.031 · Cited by 8
Ceasar, S. A., & Ebeed, H. T. (2024) · Protein and Peptide Letters · doi:10.2174/0109298665335283241003092139 · Cited by 7
Krokengen, O. C., Raasakka, A., & Kursula, P. (2023) · Biochemistry and Biophysics Reports · doi:10.1016/j.bbrep.2023.101474 · Cited by 7
Rueda, A. J. V., Bulgarelli, F. L., Palópoli, N., & Parisi, G. D. (2023) · Database · doi:10.1093/database/baad010 · Cited by 7
Biochemical methods for producing and characterising recombinant spider silks
Maraldo, A., Torpey, J. H., Evans, S. L., Rawal, A., Yarger, J. L., Isaacson, R. L., Marquis, C. P., & Blamires, S. J. (2025) · Frontiers in Arachnid Science · doi:10.3389/frchs.2024.1488680 · Cited by 7
Advancing In Silico Drug Design with Bayesian Refinement of AlphaFold Models
Sen, S., Hoff, S., Morozova, T. I., Schnapka, V., & Bonomi, M. (2026) · Journal of Chemical Theory and Computation · doi:10.1021/acs.jctc.6c00868 · Cited by 6
AI-based AlphaFold2 significantly expands the structural space of the autophagy pathway
Malhotra, N., Khatri, S., Kumar, A., Arun, A., Daripa, P., Fatihi, S., Sureshkumar, V., Jain, N., & Thukral, L. (2023) · Autophagy · doi:10.1080/15548627.2023.2238578 · Cited by 6
Proteome-scale prediction of molecular mechanisms underlying dominant genetic diseases
Badonyi, M., & Marsh, J. A. (2023) · doi:10.1101/2023.09.08.556798 · Cited by 6
Drugging the entire human proteome: Are we there yet?
Smith, M. D., Quarles, L. D., Demerdash, O., & Smith, J. C. (2024) · Drug Discovery Today · doi:10.1016/j.drudis.2024.103891 · Cited by 5
Embracing artificial intelligence design for better radiopharmaceuticals
Tao, J., Kong, X., Yang, Z., & Zhu, H. (2024) · iRadiology · doi:10.1002/ird3.76 · Cited by 5
Medvedev, K. E., Schaeffer, R. D., Chen, K. S.-M., & Grishin, N. V. (2023) · Scientific Reports · doi:10.1038/s41598-023-39273-5 · Cited by 5
Chuah, A., Li, S., Do, A., Field, M., & Andrews, D. (2022) · Bioinformatics · doi:10.1093/bioinformatics/btac465 · Cited by 5
Deep generative models of LDLR protein structure to predict variant pathogenicity
James, J. K., Norland, K., Johar, A., & Kullo, I. J. (2023) · Journal of Lipid Research · doi:10.1016/j.jlr.2023.100455 · Cited by 5
Pellegrini, S., Dove-Estrella, O., Muiños, F., López-Bigas, N., & González-Pérez, A. (2025) · Nucleic Acids Research · doi:10.1093/nar/gkaf776 · Cited by 4
Trends Innovations Challenges in Employing Interdisciplinary Approaches to Biomedical Sciences
Ganeshkumar, M., Ayyadhury, S., & Murugan, E. (2024) · Springer eBooks · doi:10.1007/978-981-97-1777-4_20 · Cited by 4
What the protein!? Computational methods for predicting microbial protein functionsPreprint
Grigson, S. R., & Edwards, R. P. (2023) · OSF Preprints (OSF Preprints) · doi:10.31219/osf.io/jhmta · Cited by 4
Artificial Intelligence Learns Protein PredictionPreprint
Heinzinger, M., & Rost, B. (2024) · Cold Spring Harbor Perspectives in Biology · doi:10.1101/cshperspect.a041458 · Cited by 4
Safi, H., Schmitt, A., Tollec, A., Belmudes, L., Colmant, A. M. G., Poirot, O., Santini, S., Legendre, M., Couté, Y., Bisio, H., et al. (2026) · The EMBO Journal · doi:10.1038/s44318-026-00770-8 · Cited by 3
Zielińska, A., Fornalik, M., Szczepaniak, M., Gimła, M., Lemanska, A., Cielecka‐Piontek, J., & Souto, E. B. (2026) · Briefings in Bioinformatics · doi:10.1093/bib/bbag203 · Cited by 3
Advancements in characterization of protein dynamics with machine learning
Madani, M., & Tarakanova, A. (2026) · npj Soft Matter · doi:10.1038/s44431-026-00025-w · Cited by 3
Discovering predisposing genes for hereditary breast cancer using deep learning
Passi, G., Lieberman, S., Zahdeh, F., Murik, O., Renbaum, P., Beeri, R., Linial, M., May, D., Levy‐Lahad, E., & Schneidman‐Duhovny, D. (2024) · Briefings in Bioinformatics · doi:10.1093/bib/bbae346 · Cited by 3
Radhakrishna, K., Rajshekhar, P. K., Arshitha, R., Patil, K., Dhannura, S., & Gowd, K. H. (2025) · Toxicon · doi:10.1016/j.toxicon.2025.108402 · Cited by 3
Han, K., Kim, H.-K., Kim, M.-H., Pak, M.-H., Pak, S.-J., Choe, M.-M., & Kim, C.-S. (2025) · International Journal of Biological Macromolecules · doi:10.1016/j.ijbiomac.2025.141801 · Cited by 3
Systematic Validation of AlphaFold-Predicted Interactomes with LUCIAPreprint
Zhang, T., Kraft, J., Soh, T. K., Kansy, M., Jonsson, I., & Bosse, J. B. (2026) · bioRxiv (Cold Spring Harbor Laboratory) · doi:10.64898/2026.04.02.716051 · Cited by 3
Schlembach, M. C., & Wrublewski, D. (2025) · Science & Technology Libraries · doi:10.1080/0194262x.2025.2468333 · Cited by 2
Yuan, Z., Shen, T., Xu, S. Y., Yu, L., Pang, B., Gan, B., Feng, Q., Ren, R., & Sun, S. (2024) · Acta Materia Medica · doi:10.15212/amm-2024-0047 · Cited by 2
Rodríguez‐Sotres, R., & Aguayo‐Ortiz, R. (2025) · Educación Química · doi:10.22201/fq.18708404e.2025.1.89902 · Cited by 2
Hydrophobic cluster analysis at protein and proteome scales
Callebaut, I., & Mornon, J. (2025) · Biochimie · doi:10.1016/j.biochi.2025.07.013 · Cited by 2
Kenny, S. E., Antaw, F., Locke, W. J., Howard, C. B., Korbie, D. J., & Trau, M. (2022) · Life · doi:10.3390/life12030363 · Cited by 2
Tahzima, R., Charon, J., Díaz, A., Jonghe, K. D., Massart, S., Michon, T., & Vranken, W. (2025) · Frontiers in Virology · doi:10.3389/fviro.2025.1501616 · Cited by 1
Gogoi, A., Babu, M., Gangadhar, A., Shirin, R., Thomas, D. A., Jayaram, J., Thakkar, P. C., & Datta, A. (2025) · Ageing Research Reviews · doi:10.1016/j.arr.2025.102937 · Cited by 1
Rational design of pathway modification for secondary metabolites
Vijay, N., Stalin, N., Ahlawat, Y. K., & Sharma, N. (2025) · Elsevier eBooks · doi:10.1016/b978-0-443-40529-7.00010-x · Cited by 1
Metadata
- Authors
- Porta-Pardo, E., Ruiz-Serra, V., Valentini, S., & Valencia, A.
- Affiliations
- University of Trento (IT)
- Institució Catalana de Recerca i Estudis Avançats (ES)
- Corresponding author
- Valencia, Alfonso
- Venue
- PLOS Computational Biology
- Publisher
- Public Library of Science (PLoS)
- Published
- 2022-01-24
- Volume
- 18
- Issue
- 1
- Pages
- e1009818
- ISSN
- 1553-734X (ISSN-L)
- 1553-7358
- PMC
- PMC8812986
- OpenAlex
- W4226027101
- Cited by
- 131
- References
- 59
- Citations by year
- 2026: 15 · 2025: 21 · 2024: 29 · 2023: 28 · 2022: 37
- FWCI
- 10.70
- Type
- journal article
- Language
- en
- Update notices
- new_version (2022-02-03)
- Open access
- gold
- doi.org
- Licence
- Locations
- PLoS Computational Biology (publishedVersion, cc-by)
- bioRxiv (Cold Spring Harbor Laboratory) (acceptedVersion, cc-by)
- PubMed Central (publishedVersion, cc-by)
- PubMed (publishedVersion)
- Iris (University of Trento) (submittedVersion, cc-by)
- Dipòsit Digital de Documents de la UAB (Universitat Autònoma de Barcelona) (submittedVersion, cc-by)
- DOAJ (DOAJ: Directory of Open Access Journals) (submittedVersion, cc-by-sa)
- UPCommons institutional repository (Universitat Politècnica de Catalunya) (submittedVersion, cc-by)
- Funders
- “la Caixa” Foundation (LCF/BQ/PI18/11630003)
- Spanish Ministry of Science (RYC2019-026415-I)
- Institució Catalana de Recerca i Estudis Avançats
- Topics
- Life Sciences › Biochemistry, Genetics and Molecular Biology › Molecular Biology › Protein Structure and Dynamics
- Life Sciences › Biochemistry, Genetics and Molecular Biology › Structural Biology › Enzyme Structure and Function
- Life Sciences › Biochemistry, Genetics and Molecular Biology › Molecular Biology › Machine Learning in Bioinformatics
- Keywords
- AlphaFold, protein structure prediction, structural coverage, human proteome, dark proteome, homology model, disease-associated mutations, oncogenic mutations, pathogenic bacteria, protein structure model
- MeSH terms
- Humans, Models, Molecular, Protein Folding, Proteome, Proteomics
About these checks
Registry, retraction, Cites and statistics results are computed, not judged, with one exception: a printed reference that no index lists is read once by a model before it counts as a citation error. Claims are extracted by a model and kept only when their quote appears verbatim in the text; each cited source is then checked, with a model’s help, for whether it says what the claim relies on. Those verdicts can be wrong — read the claim’s quote and the cited source before relying on one.
Statistics and arithmetic are recomputed, not judged.
Confidence bands are shown only for fields calibrated on our annotated test set. None is calibrated yet, so no band is shown.
What counts as a claim ›How we measure confidence ›How we check this ›
Are you an author, or do you see a problem with this page? Request a review
