

DNA Specificity Determinants Associate with Distinct Transcription Factor Functions
Open accessThe DOI matches its Crossref record; 53 of the 53 references it cites were found in a registry or an index.
Abstract
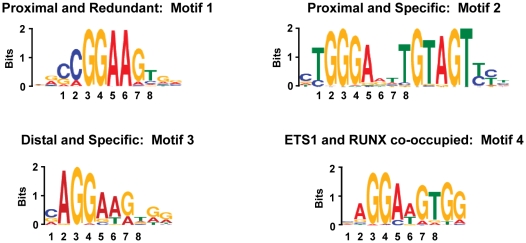
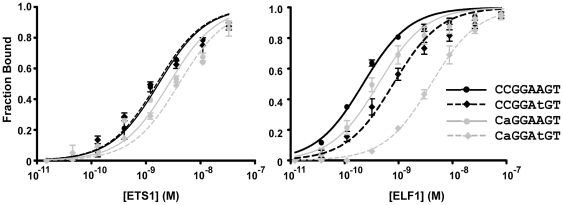
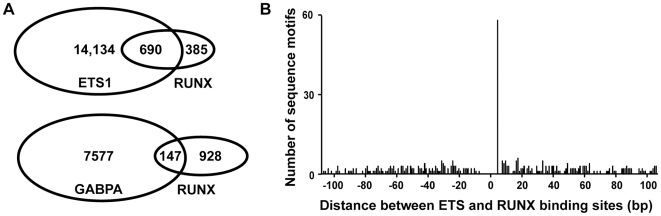
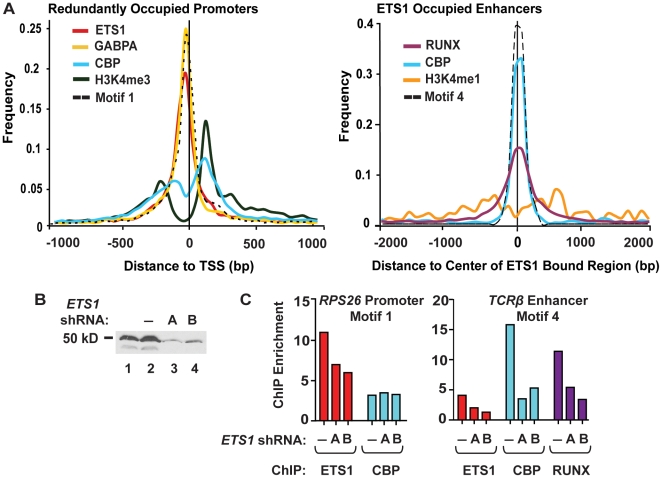
To elucidate how genomic sequences build transcriptional control networks, we need to understand the connection between DNA sequence and transcription factor binding and function. Binding predictions based solely on consensus predictions are limited, because a single factor can use degenerate sequence motifs and because related transcription factors often prefer identical sequences. The ETS family transcription factor, ETS1, exemplifies these challenges. Unexpected, redundant occupancy of ETS1 and other ETS proteins is observed at promoters of housekeeping genes in T cells due to common sequence preferences and the presence of strong consensus motifs. However, ETS1 exhibits a specific function in T cell activation; thus, unique transcriptional targets are predicted. To uncover the sequence motifs that mediate specific functions of ETS1, a genome-wide approach, chromatin immunoprecipitation coupled with high-throughput sequencing (ChIP-seq), identified both promoter and enhancer binding events in Jurkat T cells. A comparison with DNase I sensitivity both validated the dataset and also improved accuracy. Redundant occupancy of ETS1 with the ETS protein GABPA occurred primarily in promoters of housekeeping genes, whereas ETS1 specific occupancy occurred in the enhancers of T cell-specific genes. Two routes to ETS1 specificity were identified: an intrinsic preference of ETS1 for a variant of the ETS family consensus sequence and the presence of a composite sequence that can support cooperative binding with a RUNX transcription factor. Genome-wide occupancy of RUNX factors corroborated the importance of this partnership. Furthermore, genome-wide occupancy of co-activator CBP indicated tight co-localization with ETS1 at specific enhancers, but not redundant promoters. The distinct sequences associated with redundant versus specific ETS1 occupancy were predictive of promoter or enhancer location and the ontology of nearby genes. These findings demonstrate that diversity of DNA binding motifs may enable variable transcription factor function at different genomic sites.
Overview
The claims and statistics of this paper haven’t been checked yet.
Free: it reads the open-access text and checks the first 5 claims that cite a source we can check. Create a free account to check every claim.
Integrity signals
Registry
Cites
Statistics
Figures


Verification
Claims the paper makes
The claims and statistics of this paper haven’t been checked yet.
Free: it reads the open-access text and checks the first 5 claims that cite a source we can check. Create a free account to check every claim.
Claims other papers make about this one
Each is checked against this paper’s own text: does it say what the citing paper says it does?
The cited source says what the claim attributes to it.
In the citing paper
“This selection would be necessary at enhancers, where ERG (62) and ETS1 specificity (65) is observed, but not at redundant promoter-binding sites where the ETS-binding sequence can be protected from DNA methylation as a result of proximity to, or inclusion in, hypomethylated CpG islands.”
From Genomic and biochemical insights into the specificity of ETS transcription factors (2011) · cites this paper as [65]
The cited source says what the claim attributes to it.
In the citing paper
“Thus, the ETS/RUNX sequence motif is predictive of the function of nearby genes (65).”
From Genomic and biochemical insights into the specificity of ETS transcription factors (2011) · cites this paper as [65]
In the citing paper
“Quantitative DNA-binding studies indicate that the affinity of different ETS proteins for the same consensus sequence many vary by only ~10-fold, whereas the affinity of the same protein for variant consensus sites differs by ~5- to 80-fold (53, 56, 65).”
From Genomic and biochemical insights into the specificity of ETS transcription factors (2011) · cites this paper as [65]
In the citing paper
“ERK2 phosphorylates Thr38, as well as a nonconsensus acceptor Ser41, within the unstructured N-terminal region of ETS1, immediately adjacent to its PNT domain.”
From Genomic and biochemical insights into the specificity of ETS transcription factors (2011) · cites this paper as [65]
In the citing paper
“The reported overlap for ETS1 and GABPA shows most GABPA-bound regions are also occupied by ETS1 in Jurkat cells (65, 136).”
From Genomic and biochemical insights into the specificity of ETS transcription factors (2011) · cites this paper as [65]
6 more claims about this paper
Create a free account to see every claim other papers make about this one.
Self-check
Percentages, sums and reported differences re-computed from the paper’s own numbers.
The self-check needs the paper’s full text.
Citations
Cites
DNA methylation patterns and epigenetic memory
Bird, A. (2002) · Genes & Development · doi:10.1101/gad.947102 · Cited by 7,124 · cited 1×
“. The CpG islands at housekeeping promoters are generally hypomethylated, whereas CpG dinucleotides distributed in lower density throughout the genome are likely to be methylated”
BackgroundHigh-Resolution Profiling of Histone Methylations in the Human Genome
Barski, A., Cuddapah, S., Cui, K., Roh, T.-Y., Schones, D. E., Wang, Z., Wei, G., Chepelev, I., & Zhao, K. (2007) · Cell · doi:10.1016/j.cell.2007.05.009 · Cited by 6,845
Fitting a mixture model by expectation maximization to discover motifs in biopolymers.
Bailey, T. L., & Elkan, C. (1994) · PubMed · Cited by 5,806
Heintzman, N. D., Stuart, R. K., Hon, G., Fu, Y., Ching, C. W., Hawkins, R. D., Barrera, L. O., Van Calcar, S., Qu, C., Ching, K. A., et al. (2007) · Nature Genetics · doi:10.1038/ng1966 · Cited by 3,398 · cited 4×
“p300 has a strong correlation with enhancers [21,30,46].”
BackgroundInfluentialGenome-scale DNA methylation maps of pluripotent and differentiated cells
Meissner, A., Mikkelsen, T. S., Gu, H., Wernig, M., Hanna, J., Sivachenko, A., Zhang, X., Bernstein, B. E., Nusbaum, C., Jaffe, D. B., et al. (2008) · Nature · doi:10.1038/nature07107 · Cited by 2,536
ChIP-seq accurately predicts tissue-specific activity of enhancers
Visel, A., Blow, M. J., Li, Z., Zhang, T., Akiyama, J. A., Holt, A., Plajzer-Frick, I., Shoukry, M., Wright, C., Chen, F., et al. (2009) · Nature · doi:10.1038/nature07730 · Cited by 1,639 · cited 2×
“p300 has a strong correlation with enhancers [21,30,46].”
BackgroundLarge-scale analysis of the human and mouse transcriptomes
Su, A. I., Cooke, M. P., Ching, K. A., Hakak, Y., Walker, J. R., Wiltshire, T., Orth, A. P., Vega, R. G., Sapinoso, L. M., Moqrich, A., et al. (2002) · Proceedings of the National Academy of Sciences · doi:10.1073/pnas.012025199 · Cited by 1,466 · cited 1×
“Tissue specific gene lists were derived from the GNF SymAtlas database [52] and were based on the level of mRNA in T cells or pancreas compared to the median in all surveyed tissues with cutoffs (20-fold higher for T cells, 5fold higher for pancreas) that returned similar sized lists.”
MethodHigh-Resolution Mapping and Characterization of Open Chromatin across the Genome
Boyle, A. P., Davis, S., Shulha, H. P., Meltzer, P., Margulies, E. H., Weng, Z., Furey, T. S., & Crawford, G. E. (2008) · Cell · doi:10.1016/j.cell.2007.12.014 · Cited by 1,415 · cited 1×
“Jurkat cell line) identifies DNase I accessible regions as mapped by high-throughput sequencing and ChIP-chip”
BackgroundGenome-wide mapping of HATs and HDACs reveals distinct functions in active and inactive genes
Wang, Z., Zang, C., Cui, K., Schones, D. E., Barski, A., Peng, W., & Zhao, K. (2009) · Cell · doi:10.1016/j.cell.2009.06.049 · Cited by 1,344 · cited 1×
“p300 has a strong correlation with enhancers [21,30,46].”
BackgroundHertz, G. Z., & Stormo, G. D. (1999) · Bioinformatics · doi:10.1093/bioinformatics/15.7.563 · Cited by 1,243 · cited 4×
“PATSER score cutoffs used were Motif 1:9; Motif 2:12; Motif 4:10.3.”
BackgroundInfluential
Cited by
Annotation of functional variation in personal genomes using RegulomeDB
Boyle, A. P., Hong, E. L., Hariharan, M., Cheng, Y., Schaub, M. A., Kasowski, M., Karczewski, K. J., Park, J., Hitz, B. C., Weng, S., et al. (2012) · Genome Research · doi:10.1101/gr.137323.112 · Cited by 2,722
“Inaddition, we have included transcriptionfactor ChIP-seq data availablefrom the NCBI Sequence Read Archive (Hollenhorst et al. 2009; Jolma et al. 2010; Verzi et al. 2010; Wei et al. 2010; Hu et al. 2011; Lo et al. 2011; Novershtern et al. 2011; Palii et al. 2011; Yu et al. 2011).”
MethodGenome-wide analysis of ETS-family DNA-binding in vitro and in vivo
Wei, G., Badis, G., Berger, M. F., Kivioja, T., Palin, K., Enge, M., Bonke, M., Jolma, A., Varjosalo, M., Gehrke, A. R., et al. (2010) · The EMBO Journal · doi:10.1038/emboj.2010.106 · Cited by 568
“ELK1 or ELK4 can bind DNA together with SRF (Dalton and Treisman, 1992; Cooper et al, 2007; Boros et al, 2009), FLI1 associates with SMAD3 (Ravasi et al, 2010) and ETS1 can bind to composite sites with PAX5 (Garvie et al, 2001) and RUNX1 (Hollenhorst et al, 2007, 2009).”
InfluentialGenomic and biochemical insights into the specificity of ETS transcription factors
Hollenhorst, P. C., McIntosh, L. P., & Graves, B. J. (2011) · Annual Review of Biochemistry · doi:10.1146/annurev.biochem.79.081507.103945 · Cited by 490
Self-citationGordân, R., Shen, N., Dror, I., Zhou, T., Horton, J., Rohs, R., & Bulyk, M. L. (2013) · Cell Reports · doi:10.1016/j.celrep.2013.03.014 · Cited by 355
Sanda, T., Lawton, L. N., Barrasa, M. I., Fan, Z. P., Kohlhammer, H., Gutierrez, A., Ma, W., Tatarek, J., Ahn, Y., Kelliher, M. A., et al. (2012) · Cancer Cell · doi:10.1016/j.ccr.2012.06.007 · Cited by 334
“By comparing the ChIP-seq binding profiles for TAL1 complex members determined in our study with those described by three other groups (Hollenhorst et al., 2009; Palii et al., 2011b; Valouev et al., 2008), we determined that ETS1 occupancy correlates with the binding of other members of the TAL1 complex, as compared w…”
Yang, J.-H., Li, J.-H., Jiang, S., Zhou, H., & Qu, L.-H. (2013) · Nucleic Acids Research · doi:10.1093/nar/gks1060 · Cited by 310
“GSE14664 GSM365926 MCF-7 cells ERalpha (4) GSM365927 MCF-7 cells ERalpha (4) GSM365928 MCF-7 cells ERalpha (4) GSE19551 GSM487425 K562 Jun (5) GSM487426 K562 Fos (5) GSM487427 K562 Myc (5) GSE18829 GSM467647 K562 GATA1 (6) GSM467648 K562 GATA2 (6) GSE17954 GSM449525 Jurkat ETS1 (7) GSM449526 Jurkat RUNX (7) GSM449527…”
Oler, A. J., Alla, R. K., Roberts, D. N., Wong, A., Hollenhorst, P. C., Chandler, K. J., Cassiday, P. A., Nelson, C. A., Hagedorn, C. H., Graves, B. J., et al. (2010) · Nature Structural & Molecular Biology · doi:10.1038/nsmb.1801 · Cited by 286
Self-citationWinter, C. M., Austin, R. S., Blanvillain-Baufumé, S., Reback, M. A., Monniaux, M., Wu, M.-F., Sang, Y., Yamaguchi, A., Yamaguchi, N., Parker, J. E., et al. (2011) · Developmental Cell · doi:10.1016/j.devcel.2011.03.019 · Cited by 266
“This factor might assist in recruitment by interacting with a nearby sequence and forming a heterodimeric complex with a LFY monomer (see Hollenhorst et al., 2009) or, alternatively, by modifying the affinity of the LFY homodimer for the secondary binding motif.”
BackgroundA SIRT7-Dependent Acetylation Switch of GABPβ1 Controls Mitochondrial Function
Ryu, D., Jo, Y. S., Lo Sasso, G., Stein, S., Zhang, H., Perino, A., Lee, J. U., Zeviani, M., Romand, R., Hottiger, M. O., et al. (2014) · Cell Metabolism · doi:10.1016/j.cmet.2014.08.001 · Cited by 263
“(H) Area-proportional Venn diagram representing common genes between SIRT7-ChIP-seq (Barber et al., 2012), GABPa-ChIP-seq (Hollenhorst et al., 2009), and the human mitochondrial transcriptome data (Mercer et al., 2011).”
BackgroundMethodInfluentialWang, H., Zou, J., Zhao, B., Johannsen, E., Ashworth, T., Wong, H., Pear, W. S., Schug, J., Blacklow, S. C., Arnett, K. L., et al. (2011) · Proceedings of the National Academy of Sciences · doi:10.1073/pnas.1109023108 · Cited by 233
“ETS factors and RUNX factors bind widely to Jurkat TLL cell genomes (12, 13), are required during early stages of T-cell development (14), and interact with Notch1 in early hematopoiesis (15), but little is known about ZNF143.”
BackgroundThe role of the transcription factor Ets1 in carcinoma
Dittmer, J. (2015) · Seminars in Cancer Biology · doi:10.1016/j.semcancer.2015.09.010 · Cited by 212
Mutant p53 cooperates with ETS2 to promote etoposide resistance
Do, P. M., Varanasi, L., Fan, S., Li, C., Kubacka, I., Newman, V., Chauhan, K., Daniels, S. R., Boccetta, M., Garrett, M. R., et al. (2012) · Genes & Development · doi:10.1101/gad.181685.111 · Cited by 196
“Since the promoters of these genes contain EBSs and they have been described as ETS target genes (Hollenhorst et al. 2009), we can only speculate that mtp53 might be recruited to these genes via interactions with other ETS family members or through a distinct mechanism.”
BackgroundResultInfluentialOct4 switches partnering from Sox2 to Sox17 to reinterpret the enhancer code and specify endoderm
Aksoy, I., Jauch, R., Chen, J., Dyla, M., Divakar, U., Bogu, G. K., Teo, R., Leng Ng, C. K., Herath, W., Lili, S., et al. (2013) · The EMBO Journal · doi:10.1038/emboj.2013.31 · Cited by 194
“Several genomic, biochemical, and structural studies point to direct TF interactions and indicate that such partnerships can alter the genomic binding and even the sequence specificity of the participating factors (Hollenhorst et al , 2009; Slattery et al , 2011).”
Genetic determinants of co-accessible chromatin regions in activated T cells across humans
Gate, R. E., Cheng, C. S., Aiden, A. P., Siba, A., Tabaka, M., Lituiev, D., Machol, I., Gordon, M. G., Subramaniam, M., Shamim, M., et al. (2018) · Nature Genetics · doi:10.1038/s41588-018-0156-2 · Cited by 181
“2d), which could be due to an enrichment of Th-specific peaks for T reg enhancers known to be bound by the ETS/RUNX complex 37,38 .”
Twigg, S. R. F., Vorgia, E., McGowan, S. J., Peraki, I., Fenwick, A. L., Sharma, V. P., Allegra, M., Zaragkoulias, A., Akha, E. S., Knight, S. J. L., et al. (2013) · Nature Genetics · doi:10.1038/ng.2539 · Cited by 173
Oncogenic ETS proteins mimic activated RAS/MAPK signaling in prostate cells
Hollenhorst, P. C., Ferris, M. W., Hull, M. A., Chae, H., Kim, S., & Graves, B. J. (2011) · Genes & Development · doi:10.1101/gad.17546311 · Cited by 154
Self-citationLettice, L. A., Williamson, I., Wiltshire, J. H., Peluso, S., Devenney, P. S., Hill, A. E., Essafi, A., Hagman, J., Mort, R., Grimes, G., et al. (2012) · Developmental Cell · doi:10.1016/j.devcel.2011.12.010 · Cited by 153
“GABPa and ELF1 were of particular interest, given that recent analysis of ETS1 binding in vivo showed co-occupation by these factors at a substantial subset of sites (Hollenhorst et al., 2007, 2009).”
InfluentialLarge-Scale Quality Analysis of Published ChIP-seq Data
Marinov, G. K., Kundaje, A., Park, P. J., & Wold, B. J. (2014) · G3 Genes|Genomes|Genetics · doi:10.1534/g3.113.008680 · Cited by 147
Ramirez, K., Chandler, K. J., Spaulding, C., Zandi, S., Sigvardsson, M., Graves, B. J., & Kee, B. L. (2012) · Immunity · doi:10.1016/j.immuni.2012.04.006 · Cited by 173
“ChIP sequencing was described in Hollenhorst et al. (2009).”
InfluentialSelf-citationMolecular mechanisms of ETS transcription factor-mediated tumorigenesis
Kar, A., & Gutierrez‐Hartmann, A. (2013) · Critical Reviews in Biochemistry and Molecular Biology · doi:10.3109/10409238.2013.838202 · Cited by 169
“It has been found that members of Class II are sensitive to an adenine-to-thymine substitution at position 7 (Mo et al., 1998), while SPI preferably binds to core GGA sites preceded by an adenine-rich sequence (Bosselut et al., 1993; Hollenhorst et al., 2009; Oettgen et al., 2000).”
BackgroundPalii, C. G., Perez-Iratxeta, C., Yao, Z., Cao, Y., Dai, F., Davison, J., Atkins, H., Allan, D., Dilworth, F. J., Gentleman, R., et al. (2011) · The EMBO Journal · doi:10.1038/emboj.2010.342 · Cited by 140
“Analysis of the Ets motifs found under TAL1 peaks in Jurkat cells revealed an enrichment for the recently identified ETS1-specific motif but not for the ‘redundant’ Ets motif, which can be bound by either ETS1 or the other ETS-family member GABPA (Hollenhorst et al, 2009).”
BackgroundInfluentialETS1 is a genome-wide effector of RAS/ERK signaling in epithelial cells
Plotnik, J. P., Budka, J. A., Ferris, M. W., & Hollenhorst, P. C. (2014) · Nucleic Acids Research · doi:10.1093/nar/gku929 · Cited by 127
“An overlap of ETS1, GABPA, ELK4 and ELF1 binding sites (Figure 4A) revealed a pattern similar to that identified in T cells (17), with GABPA binding primarily in promoter sequences (<300 bp to TSS) that were co-occupied by other ETS factors (redundant sites), and the other ETS proteins having a mixture of redundant pr…”
BackgroundResultInfluentialSelf-citationZhang, X., Gamble, M. J., Stadler, S. C., Cherrington, B. D., Causey, C. P., Thompson, P. R., Roberson, M. S., Kraus, W. L., & Coonrod, S. A. (2011) · PLoS Genetics · doi:10.1371/journal.pgen.1002112 · Cited by 119
“This motif was originally identified as a binding site for the oncogene, Elk-1, and has since been found to be bound by other ETS family members such as Ets1 and GABPa [30–32].”
BackgroundPatel, M., Simon, J. M., Iglesia, M. D., Wu, S. B., McFadden, A. W., Lieb, J. D., & Davis, I. J. (2012) · Genome Research · doi:10.1101/gr.125666.111 · Cited by 114
“However, ETS motifs in composite sites with AP1 were preceded by an A. Similar motif variation had been observed in the tandem binding sites of ETS1 with RUNX1 (Hollenhorst et al. 2009).”
BackgroundConerly, M. L., Yao, Z., Zhong, J. W., Groudine, M. T., & Tapscott, S. J. (2016) · Developmental Cell · doi:10.1016/j.devcel.2016.01.021 · Cited by 136
Inducible chromatin priming is associated with the establishment of immunological memory in T cells
Bevington, S. L., Cauchy, P., Piper, J., Bertrand, E., Lalli, N., Jarvis, R. C., Gilding, L. N., Ott, S., Bonifer, C., & Cockerill, P. N. (2016) · The EMBO Journal · doi:10.15252/embj.201592534 · Cited by 110
“This is made more likely by the fact that pDHSs bind co-localizing, constitutively expressed TFs such as RUNX1 and ETS-1 which can bind in a concerted fashion to composite ETS/RUNX elements (Hollenhorst et al , 2009).”
InfluentialSpatially clustered loci with multiple enhancers are frequent targets of HIV-1 integration
Lucic, B., Chen, H.-C., Kuzman, M., Zorita, E., Wegner, J., Minneker, V., Wang, W., Fronza, R., Laufs, S., Schmidt, M., et al. (2019) · Nature Communications · doi:10.1038/s41467-019-12046-3 · Cited by 107
Mokrý, M., Middendorp, S., Wiegerinck, C. L., Witte, M., Teunissen, H., Meddens, C., Cuppen, E. P. J. G., Clevers, H. C., & Nieuwenhuis, E. E. S. (2013) · Gastroenterology · doi:10.1053/j.gastro.2013.12.003 · Cited by 117
Pencovich, N., Jaschek, R., Tanay, A., & Groner, Y. (2011) · Blood · doi:10.1182/blood-2010-07-295113 · Cited by 103
Understanding the Role of ETS-Mediated Gene Regulation in Complex Biological Processes
Findlay, V. J., LaRue, A. C., Turner, D. P., Watson, P. M., & Watson, D. K. (2013) · Advances in cancer research · doi:10.1016/b978-0-12-407190-2.00001-0 · Cited by 125
Dadi, S., Noir, S. L., Payet‐Bornet, D., Lhermitte, L., Cabeza, J. Z., Bergeron, J., Villarèse, P., Vachez, E., Dik, W. A., Millien, C., et al. (2012) · Cancer Cell · doi:10.1016/j.ccr.2012.02.013 · Cited by 118
“This suppressive function for TLX on Ea activity via ETS1 does not exclude protein-protein interaction with and mediation of a suppressive effect by, other TFs, such as RUNX1 (Hollenhorst et al., 2009).”
BackgroundTranscriptional regulation of Hepatic Stellate Cell activation in NASH
Marcher, A.-B., Bendixen, S. M., Terkelsen, M. K., Hohmann, S. S., Hansen, M. H., Larsen, B. D., Mandrup, S., Dimke, H., Detlefsen, S., & Ravnskjaer, K. (2019) · Scientific Reports · doi:10.1038/s41598-019-39112-6 · Cited by 95
Rapid Evolutionary Rewiring of a Structurally Constrained Eye Enhancer
Swanson, C. I., Schwimmer, D. B., & Barolo, S. (2011) · Current Biology · doi:10.1016/j.cub.2011.05.056 · Cited by 94
“This is consistent with mapped Runx and Ets sites in vertebrate genomes, which are frequently associated with one another in target enhancers, but not with a single rigid arrangement or spacing [59–61].”
The RUNX1–PU.1 axis in the control of hematopoiesis
Imperato, M. R., Cauchy, P., Obier, N., & Bonifer, C. (2015) · International Journal of Hematology · doi:10.1007/s12185-015-1762-8 · Cited by 94
“In CD4+ single positive (SP) and CD4+/CD8+ double positive (DP) T-cells, genome-wide studies have conferred a key role of RUNX1 in the modulation of the expression of these genes via distal elements [67, 68].”
BackgroundAn integrated ChIP-seq analysis platform with customizable workflows
Giannopoulou, E. G., & Elemento, O. (2011) · BMC Bioinformatics · doi:10.1186/1471-2105-12-277 · Cited by 92
“RUNX1 is a TF associated with several types of leukemia and is known to bind to T cell receptor enhancers [43].”
BackgroundMethodResultInfluentialDeciphering the Sox-Oct partner code by quantitative cooperativity measurements
Ng, C. K. L., Li, N. X., Chee, S., Prabhakar, S., Kolatkar, P. R., & Jauch, R. (2012) · Nucleic Acids Research · doi:10.1093/nar/gks153 · Cited by 89
“Nucleic acids research, 40(11), 4933-4941.”
Wen, T., Barham, W. J., Li, Y., Zhang, H., Gicobi, J. K., Hirdler, J. B., Liu, X., Ham, H., Martinez, K., Lucien, F., et al. (2021) · Cancer Immunology Research · doi:10.1158/2326-6066.cir-21-0539 · Cited by 90
“ETS1 is known to regulate genes involved in both T- and NK-cell differentiation and activation (40-42).”
BackgroundThe chromatin landscape at the HIV-1 provirus integration site determines viral expression
Vansant, G., Chen, H.-C., Zorita, E., Trejbalová, K., Miklík, D., Filion, G., & Debyser, Z. (2020) · Nucleic Acids Research · doi:10.1093/nar/gkaa536 · Cited by 78
“Additional ChIP-Seq data for H3K36me3, H3K79me3, H3K27ac, H3K4me1, RNAPII, H3K4me3, H3K9me3 (GSE65687) (56), H3K79me2 (GSE60104) (57), Med1 (GSE59657) (58) and CBP (GSE17954) (59) were downloaded from GEO.”
ELK1 Uses Different DNA Binding Modes to Regulate Functionally Distinct Classes of Target Genes
Odrowaz, Z., & Sharrocks, A. D. (2012) · PLoS Genetics · doi:10.1371/journal.pgen.1002694 · Cited by 83
The CLN3 gene and protein: What we know
Mirza, M., Vainshtein, A., DiRonza, A., Chandrachud, U., Haslett, L. J., Palmieri, M., Storch, S., Groh, J., Dobzinski, N., Napolitano, G., et al. (2019) · Molecular Genetics & Genomic Medicine · doi:10.1002/mgg3.859 · Cited by 74
Champhekar, A., Damle, S. S., Freedman, G., Carotta, S., Nutt, S. L., & Rothenberg, E. V. (2015) · Genes & Development · doi:10.1101/gad.259879.115 · Cited by 74
“Notch signals triggered by the Delta-like 4 (DL4) ligand expressed on thymic stromal cells drive this processbypromoting theT-lineage fate andblocking access to alternate lineages (Ikawaet al. 2006; Rothenberg 2007; Hozumi et al. 2008).”
BackgroundFredriksson, N. J., Elliott, K., Filges, S., Van den Eynden, J., Ståhlberg, A., & Larsson, E. (2017) · PLOS Genetics · doi:10.1371/journal.pgen.1006773 · Cited by 73
Mouri, K., Guo, M. H., de Boer, C. G., Lissner, M. M., Harten, I. A., Newby, G. A., DeBerg, H. A., Platt, W. F., Gentili, M., Liu, D. R., et al. (2022) · Nature Genetics · doi:10.1038/s41588-022-01056-5 · Cited by 76
Reeder, J. E., Kwak, Y.-T., McNamara, R. P., Forst, C. V., & D’Orso, I. (2015) · eLife · doi:10.7554/elife.08955 · Cited by 86
“We found that Tat and ETS1 co-occupy the CD69 promoter but not gene body (Figure 9B), consistent with the motif enrichment analysis and a previous ETS1 ChIP-seq dataset (Hollenhorst et al., 2009).”
BackgroundMethodResultInfluentialDNA Binding by the ETS Protein TEL (ETV6) Is Regulated by Autoinhibition and Self-association
Green, S. M., Coyne, H. J., McIntosh, L. P., & Graves, B. J. (2010) · Journal of Biological Chemistry · doi:10.1074/jbc.m109.096958 · Cited by 69
Self-citationZhong, Y., Walker, S. K., Pritykin, Y., Leslie, C. S., Rudensky, A. Y., & van der Veeken, J. (2021) · Nature Immunology · doi:10.1038/s41590-021-01086-x · Cited by 73
Emergent Properties of EWS/FLI Regulation via GGAA Microsatellites in Ewing's Sarcoma
Gangwal, K., Close, D., Enriquez, C. A., Hill, C. P., & Lessnick, S. L. (2010) · Genes & Cancer · doi:10.1177/1947601910361495 · Cited by 67
Khanna, A., Okkeri, J., Bilgen, T., Tiirikka, T., Vihinen, M., Visakorpi, T., & Westermarck, J. (2011) · PLoS ONE · doi:10.1371/journal.pone.0017979 · Cited by 67
The Forkhead Transcription Factor FOXK2 Promotes AP-1-Mediated Transcriptional Regulation
Ji, Z., Donaldson, I. J., Liu, J., Hayes, A., Zeef, L. A. H., & Sharrocks, A. D. (2012) · Molecular and Cellular Biology · doi:10.1128/mcb.05504-11 · Cited by 73
“However, unlike other cooperatively acting transcription factor pairs like RUNX1-ETS1 (22), no strict spacing between FOXK2 and AP-1 binding sites is apparent, which would impose stereospecific constraints on the interaction surfaces provided by each transcription factor.”
BackgroundRickman, D. S., Chen, Y.-B., Banerjee, S., Pan, Y., Yu, J., Vuong, T., Perner, S., Lafargue, C. J., Mertz, K. D., Setlur, S. R., et al. (2010) · Neoplasia · doi:10.1593/neo.10866 · Cited by 62
Cieślak, A., Charbonnier, G., Tesio, M., Mathieu, È.-L., Belhocine, M., Touzart, A., Smith, C. L., Hypolite, G., Andrieu, G. P., Martens, J. H. A., et al. (2020) · The Journal of Experimental Medicine · doi:10.1084/jem.20192360 · Cited by 69
Chromosome I Controls Chromosome II Replication in Vibrio cholerae
Baek, J. H., & Chattoraj, D. K. (2014) · PLoS Genetics · doi:10.1371/journal.pgen.1004184 · Cited by 62
Genomic Analysis Reveals a Novel Nuclear Factor-κB (NF-κB)-binding Site in Alu-repetitive Elements
Αντωνάκη, Α., Demetriades, C., Polyzos, A., Banos, A., Vatsellas, G., Lavigne, M. D., Apostolou, E., Mantouvalou, E., Papadopoulou, D., Mosialos, G., et al. (2011) · Journal of Biological Chemistry · doi:10.1074/jbc.m111.234161 · Cited by 74
Obier, N., Cauchy, P., Assi, S. A., Gilmour, J., Lie‐A‐Ling, M., Lichtinger, M., Hoogenkamp, M., Noailles, L., Cockerill, P. N., Lacaud, G., et al. (2016) · Development · doi:10.1242/dev.139857 · Cited by 63
“This composite motif likely indicates direct interaction between AP-1 and TEAD, as was identified from other composite motifs previously (Chen et al., 1998; Cockerill et al., 1995; Hollenhorst et al., 2009).”
BackgroundHernando, H., Shannon-Lowe, C., Islam, A. B., Al-Shahrour, F., Rodríguez-Ubreva, J., Rodríguez-Cortez, V. C., Javierre, B. M., Mangas, C., Fernández, A. F., Parra, M., et al. (2013) · Genome Biology · doi:10.1186/gb-2013-14-1-r3 · Cited by 55
“RUNX ChIPseq target data were obtained from the study of Hollenhorst and colleagues [57] (Jurkat cell line, GEO Database ID: GSE17954).”
Sharma, N. L., Massie, C. E., Butter, F., Mann, M., Bon, H., Ramos‐Montoya, A., Menon, S., Stark, R., Lamb, A. D. G., Scott, H. E., et al. (2014) · Nucleic Acids Research · doi:10.1093/nar/gku281 · Cited by 60
“As has previously been shown for other ETS factors (53,54), there were many common binding sites for GABP and ERG in Jurkat cells, although far less redundant promoter occupancy was identified in VCaPs (28.”
BackgroundMethodStructures of the Ets Protein DNA-binding Domains of Transcription Factors Etv1, Etv4, Etv5, and Fev
Cooper, C. D. O., Newman, J. A., Aitkenhead, H., Allerston, C. K., & Gileadi, O. (2015) · Journal of Biological Chemistry · doi:10.1074/jbc.m115.646737 · Cited by 62
“A number of other factors influence Ets DNA binding, including interaction with other transcription factors to recognize combined operators in a cooperativemanner (34), cooperative binding of palindromic sequences by dimerization (35), and the presence of auto-inhibitory regions surrounding the Ets domain (36–38).”
BackgroundGenome-Wide Binding Map of the HIV-1 Tat Protein to the Human Genome
Marban, C., Su, T., Ferrari, R., Li, B., Vatakis, D. N., Pellegrini, M. A., Zack, J. A., Rohr, O., & Kurdistani, S. K. (2011) · PLoS ONE · doi:10.1371/journal.pone.0026894 · Cited by 60
“We found five datasets that examined global distributions of ETS1, CBP, RUNX1, H3K4 tri-methylation (H3K4me3) and H3K27me3 in Jurkat cells (GSE23080, GSE17954 [18]).”
BackgroundStructural basis of Ets1 activation by Runx1
Shrivastava, T., Mino, K., Babayeva, N. D., Baranovskaya, O. I., Rizzino, A., & Tahirov, T. H. (2014) · Leukemia · doi:10.1038/leu.2014.111 · Cited by 51
Laufer, B. I., Hwang, H., Jianu, J. M., Mordaunt, C. E., Korf, I. F., Hertz‐Picciotto, I., & LaSalle, J. M. (2020) · Human Molecular Genetics · doi:10.1093/hmg/ddaa218 · Cited by 57
“Notably, an ETS:RUNX motif, which refers to regions co-occupied by the two factors, was enriched within the hypermethylated DS CHD DMRs and also within the hypomethylated DS DMRs from the previous comparisons (22).”
BackgroundETS-4 Is a Transcriptional Regulator of Life Span in Caenorhabditis elegans
Thyagarajan, B., Blaszczak, A. G., Chandler, K. J., Watts, J. L., Johnson, W. E., & Graves, B. J. (2010) · PLoS Genetics · doi:10.1371/journal.pgen.1001125 · Cited by 51
“Although this frequency did not represent an enrichment of conserved ETS sites compared to other randomly selected TSS-proximal regions (data not shown), we suspect this represents the general importance of ETS factors in many control regions and not the lack of biological relevance of these sites on ETS-4 regulated g…”
BackgroundSelf-citationGenome-wide Runx2 occupancy in prostate cancer cells suggests a role in regulating secretion
Little, G. H., Noushmehr, H., Baniwal, S. K., Berman, B. P., Coetzee, G. A., & Frenkel, B. (2011) · Nucleic Acids Research · doi:10.1093/nar/gkr1219 · Cited by 69
Cauchy, P., Maqbool, M. A., Zacarias-Cabeza, J., Vanhille, L., Koch, F., Fenouil, R., Gut, M., Gut, I., Santana, M. A., Griffon, A., et al. (2016) · Nucleic Acids Research · doi:10.1093/nar/gkv1475 · Cited by 50
“Further, while single-stage associations of TFs with Ets1 as co-factor have been described (22,26,29), the dynamics of these have not been investigated with Ets1 as the centerpiece.”
BackgroundResultInfluentialChen, X. X., Ji, Z., Webber, A., & Sharrocks, A. D. (2015) · Nucleic Acids Research · doi:10.1093/nar/gkv1120 · Cited by 47
“It is generally assumed that specificity of action is generated through mechanisms that ensure the binding of a unique family member to a given site, either through selective expression in a cell or through other mechanisms such as cooperative binding with other transcription factors as exemplified by members of the E…”
BackgroundInteraction of Ets-1 with HDAC1 Represses IL-10 Expression in Th1 Cells
Lee, C., Kwon, H., Sahoo, A., Hwang, W., So, J., Hwang, J., Chae, C.-S., Kim, G.-C., Kim, J., So, H., et al. (2012) · The Journal of Immunology · doi:10.4049/jimmunol.1101614 · Cited by 51
“(45) reported an enrichment of Ets-1 in regulatory elements of the Il10 locus through ChIP-seq analysis in human Jurkat T cell.”
BackgroundHmga2 is a direct target gene of RUNX1 and regulates expansion of myeloid progenitors in mice
Lam, K., Muselman, A., Du, R., Harada, Y., Scholl, A. G., Yan, M., Matsuura, S., Weng, S., Harada, H., & Zhang, D.-E. (2014) · Blood · doi:10.1182/blood-2014-02-554543 · Cited by 46
Odrowaz, Z., & Sharrocks, A. D. (2012) · PLoS ONE · doi:10.1371/journal.pone.0049892 · Cited by 51
The transcriptional programme controlled by Runx1 during early embryonic blood development
Tanaka, Y., Joshi, A., Wilson, N. K., Kinston, S., Nishikawa, S., & Göttgens, B. (2012) · Developmental Biology · doi:10.1016/j.ydbio.2012.03.024 · Cited by 51
“Moreover, of 839 Runx1 candidate target genes identified by Hollenhorst et al. (2009) in the human leukaemia cell line Jurkat , 503 overlapped with the candidate Runx1 target genes defined here, thus demonstrating a very significant overlap (P-value 1.2e 10) (Supplementary Fig.”
BackgroundO’Hara, S. P., Splinter, P. L., Trussoni, C. E., Guicciardi, M. E., Splinter, N. P., Alsuraih, M., Nasser‐Ghodsi, N., Stollenwerk, D., Gores, G. J., & LaRusso, N. F. (2019) · Journal of Biological Chemistry · doi:10.1074/jbc.ra119.010176 · Cited by 43
“Although the physical interaction between phospho-ETS1 and p300 has been described previously (44, 45), as has the likely requirement of ETS1 for the occupancy of CBP at enhancer regions in activated T-cells (39), our data presented herein suggests that ETS1 directs p300 to the BCL-xL locus during senescence induction.”
BackgroundRAS/ERK pathway transcriptional regulation through ETS/AP-1 binding sites
Hollenhorst, P. C. (2012) · Small GTPases · doi:10.4161/sgtp.19630 · Cited by 52
Self-citationCooper, C. D. O., Newman, J. A., & Gileadi, O. (2014) · Biochemical Society Transactions · doi:10.1042/bst20130227 · Cited by 49
Heinz, S., & Glass, C. K. (2011) · Current topics in microbiology and immunology · doi:10.1007/82_2011_142 · Cited by 46
Selvaraj, N., Budka, J. A., Ferris, M. W., Jerde, T. J., & Hollenhorst, P. C. (2014) · Molecular Cancer · doi:10.1186/1476-4598-13-61 · Cited by 46
Self-citationProteasome system dysregulation and treatment resistance mechanisms in major depressive disorder
Minelli, A., Magri, C., Barbon, A., Bonvicini, C., Segala, M., Congiu, C., Bignotti, S., Milanesi, E., Trabucchi, L., Cattane, N., et al. (2015) · Translational Psychiatry · doi:10.1038/tp.2015.180 · Cited by 45
Tserel, L., Kolde, R., Rebane, A., Kisand, K. E., Org, T., Peterson, H., Vilo, J., & Peterson, P. (2010) · BMC Genomics · doi:10.1186/1471-2164-11-642 · Cited by 49
“It is likely that the presence of these transcription factors binding sites reflects their activity in recruitment of histone modifier proteins to the promoters [21,22].”
BackgroundGuturu, H., Doxey, A. C., Wenger, A. M., & Bejerano, G. (2013) · Philosophical Transactions of the Royal Society B: Biological Sciences · doi:10.1098/rstb.2013.0029 · Cited by 36
Griffin, J. W. D., Liu, Y., Bradshaw, P. C., & Wang, K. (2018) · Journal of Molecular Neuroscience · doi:10.1007/s12031-018-1035-0 · Cited by 38
Gluck, C. B., Glathar, A. R., Tsompana, M., Nowak, N. J., Garrett‐Sinha, L. A., Buck, M. J., & Sinha, S. (2019) · PLoS Genetics · doi:10.1371/journal.pgen.1008250 · Cited by 44
“The interesting observation that ETS1 shows a contrasting bias of enriched binding to promoters for house-keeping genes and to distal enhancers that are likely to drive tissue-specific gene expression programs is consistent with previous ETS1 ChIPseq results from other cell types[45].”
ResultMethods for Analysis of Transcription Factor DNA-Binding Specificity In Vitro
Jolma, A., & Taipale, J. (2011) · Sub-cellular biochemistry/Subcellular biochemistry · doi:10.1007/978-90-481-9069-0_7 · Cited by 48
“in vitro methods, and the differences cannot be explained by the factors described above, it is likely that the TF in question binds to DNA as a dimer with other factors, or contains additional determinants of specificity that are not present in the domain used for the in vitro analysis [35, 42, 43].”
BackgroundJankowski, A., Szczurek, E., Jauch, R., Tiuryn, J., & Prabhakar, S. (2013) · Genome Research · doi:10.1101/gr.154922.113 · Cited by 35
Homotypic cooperativity and collective binding are determinants of bHLH specificity and function
Shively, C. A., Liu, J., Chen, X., Loell, K., & Mitra, R. D. (2019) · Proceedings of the National Academy of Sciences · doi:10.1073/pnas.1818015116 · Cited by 33
ETS1 regulates the expression of ATXN2
Scoles, D. R., Pflieger, L. T., Thai, K. K., Hansen, S. T., Dansithong, W., & Pulst, S.-M. (2012) · Human Molecular Genetics · doi:10.1093/hmg/dds349 · Cited by 40
Batf stabilizes Th17 cell development via impaired Stat5 recruitment of Ets1‐Runx1 complexes
Pham, D., Silberger, D. J., Nguyen, K. N., Gao, M., Weaver, C. T., & Hatton, R. D. (2023) · The EMBO Journal · doi:10.15252/embj.2021109803 · Cited by 35
“2023 The Authors The EMBO Journal 42: e109803 | 2023 7 of 23 8 of 23 The EMBO Journal 42: e109803 | 2023 2023 The Authors 2023 The Authors The EMBO Journal 42: e109803 | 2023 9 of 23 bound regions colocalize with Ets1 at active enhancer elements genome-wide, due in part to Runx1’s direct interaction with and abrogatio…”
BackgroundInfluentialTACO: a general-purpose tool for predicting cell-type–specific transcription factor dimers
Jankowski, A., Prabhakar, S., & Tiuryn, J. (2014) · BMC Genomics · doi:10.1186/1471-2164-15-208 · Cited by 36
“Ranked 1st is the known ETS – RUNX dimer [14], which was found in ChIP-seq peaks for PU.1, a transcription factor from the ETS family.”
Selvaraj, N., Budka, J. A., Ferris, M. W., Plotnik, J. P., & Hollenhorst, P. C. (2014) · Molecular and Cellular Biology · doi:10.1128/mcb.00982-14 · Cited by 34
“The AGGAAG motif is consistent with an enhancer-enriched binding motif that can be bound by multiple ETS factors (17, 34).”
BackgroundSelf-citationGenome-wide repression of eRNA and target gene loci by the ETV6-RUNX1 fusion in acute leukemia
Teppo, S., Laukkanen, S., Liuksiala, T., Nordlund, J., Oittinen, M., Teittinen, K. J., Grönroos, T., St-Onge, P., Sinnett, D., Syvänen, A., et al. (2016) · Genome Research · doi:10.1101/gr.193649.115 · Cited by 34
“A previous work indicated that RUNX1 and ETS factors can also occupy a shared ETS-RUNX motif (Hollenhorst et al. 2009).”
Broos, S., Soete, A., Hooghe, B., Moran, R. J., Roy, F. M. V., & Bleser, P. D. (2013) · Nucleic Acids Research · doi:10.1093/nar/gkt288 · Cited by 35
“Most models are built from available ENCODE data of tier 1 cell lines, except for Esrrb (15), ETS1 (16), KLF4 (15), NANOG (15), Nmyc (15), STAT3 (15), TBP (17), Tfcp2l1 (15), TP53 (18) and Zfx (15).”
MethodRegulation of Tcrb Gene Assembly by Genetic, Epigenetic, and Topological Mechanisms
Majumder, K., Bassing, C. H., & Oltz, E. M. (2015) · Advances in immunology · doi:10.1016/bs.ai.2015.07.001 · Cited by 33
Budka, J. A., Ferris, M. W., Capone, M. J., & Hollenhorst, P. C. (2018) · Genes & Cancer · doi:10.18632/genesandcancer.182 · Cited by 30
“Previous analyses of ETS factor binding patterns have identified high affinity ETS binding sequences in the promoters of many housekeeping genes that can non-specifically bind any ETS factor, while the binding sites associated with tissue specific functions of individual ETS factors occur mostly in enhancers [40, 41].”
BackgroundSelf-citationSpi-1/PU.1 activates transcription through clustered DNA occupancy in erythroleukemia
Ridinger-Saison, M., Boeva, V., Rimmelé, P., Kulakovskiy, I., Gallais, I., Levavasseur, B., Paccard, C., Legoix-Né, P., Morlé, F., Nicolas, A., et al. (2012) · Nucleic Acids Research · doi:10.1093/nar/gks659 · Cited by 28
“It has been shown that distinct cooperative partnership dictates the specificity of the transcriptional regulation by two different ETS TFs, ETS1 and GABPa, expressed in the same cell type (11,12).”
BackgroundLessons on transcriptional control from the serum response network
Galbraith, M. D., & Espinosa, J. M. (2011) · Current Opinion in Genetics & Development · doi:10.1016/j.gde.2011.01.011 · Cited by 30
“In a second study using ChIP-Seq, they made the interesting observation that whereas ETS1 and GABPA actually co-occupy active promoters of housekeeping genes, ETS1 specifically occupies the enhancers of genes important for T cell function [23 ].”
MethodPoon, G. M. K. (2012) · Journal of Biological Chemistry · doi:10.1074/jbc.m112.342345 · Cited by 34
Bevington, S. L., Cauchy, P., & Cockerill, P. N. (2016) · BioEssays · doi:10.1002/bies.201600184 · Cited by 33
“2C) [13], and many of these motifs exist as the composite motif CAGGAAGTGGT which supports co-operative binding of ETS-1 and RUNX1 in T cells [49].”
BackgroundUchiumi, F., Miyazaki, S., & Tanuma, S.-I. (2011) · Cellular and Molecular Life Sciences · doi:10.1007/s00018-011-0674-x · Cited by 31
“Recent genome-wide analysis of human promoters revealed that Elk1 and Ets1 bound regions are frequently occupied with SRF [115], and CBP [134], respectively.”
BackgroundSignatures of DNA target selectivity by ETS transcription factors
Poon, G. M. K., & Kim, H. M. (2017) · Transcription · doi:10.1080/21541264.2017.1302901 · Cited by 30
Genome-Wide Identification of Target Genes for the Key B Cell Transcription Factor Ets1
Saelee, P., Kearly, A., Nutt, S. L., & Garrett‐Sinha, L. A. (2017) · Frontiers in Immunology · doi:10.3389/fimmu.2017.00383 · Cited by 28
“org April 2017 | Volume 8 | Article 383 members of the Ets gene family, but to bind specifically to distal T cell enhancers (108).”
BackgroundPalstra, R.-J. T. S., Crignis, E. D., Röling, M. D., van Staveren, T., Kan, T. W., van IJcken, W. F. J., Mueller, Y. M., Katsikis, P. D., & Mahmoudi, T. (2018) · Science Advances · doi:10.1126/sciadv.1701729 · Cited by 31
Lichtinger, M., Hoogenkamp, M., Krysinska, H., Ingram, R., & Bonifer, C. (2010) · Blood Cells Molecules and Diseases · doi:10.1016/j.bcmd.2010.02.009 · Cited by 30
Plotnik, J. P., & Hollenhorst, P. C. (2017) · Nucleic Acids Research · doi:10.1093/nar/gkx039 · Cited by 24
“(E) Transwell migration of DU145 ETS1 KO previously shown that ETS1 can bind to two classes of binding sites; sites bound by many different ETS factors, which tend to be in the proximal promoters of housekeeping genes (redundant sites), and sites bound more specifically by ETS1, which tend to be in distal enhancers of…”
BackgroundSelf-citationLiu, L., Liu, Y., Zhang, T., Wu, H., Lin, M., Wang, C., Zhan, Y., Zhou, Q., Qiao, B., Sun, X., et al. (2016) · Journal of Experimental & Clinical Cancer Research · doi:10.1186/s13046-015-0279-6 · Cited by 24
“The sequence of ETS-1 shRNA has been previously provided [19].”
Metadata
- Authors
- Hollenhorst, P. C., Chandler, K. J., Poulsen, R. L., Johnson, W. E., Speck, N. A., & Graves, B. J.
- Affiliations
- University of Utah (US)
- Brigham Young University (US)
- Abramson Cancer Center (US)
- Corresponding author
- Graves, Barbara J.
- Venue
- PLoS Genetics
- Publisher
- Public Library of Science (PLoS)
- Published
- 2009-12-18
- Volume
- 5
- Issue
- 12
- Pages
- e1000778
- ISSN
- 1553-7390 (ISSN-L)
- 1553-7404
- PMC
- PMC2787013
- OpenAlex
- W2127600515
- Cited by
- 198
- References
- 53
- Citations by year
- 2026: 4 · 2025: 4 · 2024: 8 · 2023: 7 · 2022: 3 · 2021: 13 · 2020: 7 · 2019: 11 · 2018: 8 · 2017: 9 · 2016: 13 · 2015: 16 · 2014: 18 · 2013: 16 · 2012: 23
- FWCI
- 8.18
- Type
- journal article
- Language
- en
- Open access
- gold
- doi.org
- Locations
- PLoS Genetics (publishedVersion, cc-by)
- Europe PMC (PubMed Central) (publishedVersion, cc-by)
- PubMed Central (publishedVersion, cc-by)
- PubMed (publishedVersion)
- DOAJ (DOAJ: Directory of Open Access Journals) (submittedVersion, cc-by-sa)
- Figshare (submittedVersion, cc-by)
- Funders
- Huntsman Cancer Institute
- National Institutes of Health (CA42014)
- National Heart, Lung, and Blood Institute (HL089969, R01HL089969)
- National Cancer Institute (R01CA058343, CA42014, P30CA042014)
- National Institute of General Medical Sciences (GM 38663, R01GM038663)
- Topics
- Life Sciences › Biochemistry, Genetics and Molecular Biology › Molecular Biology › Genomics and Chromatin Dynamics
- Life Sciences › Biochemistry, Genetics and Molecular Biology › Molecular Biology › Chromatin Remodeling and Cancer
- Life Sciences › Biochemistry, Genetics and Molecular Biology › Molecular Biology › Gene Regulatory Network Analysis
- Keywords
- ETS1, ETS transcription factors, DNA sequence specificity, transcription factor binding motifs, enhancer binding, promoter binding, T cell activation, GABPA, RUNX, DNase I sensitivity, housekeeping genes, chromatin occupancy
- MeSH terms
- Base Sequence, Binding Sites, Enhancer Elements, Genetic, Humans, Lymphocyte Activation, Promoter Regions, Genetic, Protein Binding, T-Lymphocytes, Transcription Factors, Genome, Human, Jurkat Cells, Core Binding Factor alpha Subunits, Proto-Oncogene Protein c-ets-1, GA-Binding Protein Transcription Factor, Gene Regulatory Networks
About these checks
Registry, retraction, Cites and statistics results are computed, not judged, with one exception: a printed reference that no index lists is read once by a model before it counts as a citation error. Claims are extracted by a model and kept only when their quote appears verbatim in the text; each cited source is then checked, with a model’s help, for whether it says what the claim relies on. Those verdicts can be wrong — read the claim’s quote and the cited source before relying on one.
Statistics and arithmetic are recomputed, not judged.
Confidence bands are shown only for fields calibrated on our annotated test set. None is calibrated yet, so no band is shown.
What counts as a claim ›How we measure confidence ›How we check this ›
Are you an author, or do you see a problem with this page? Request a review
Data sources
Bibliographic data: Semantic Scholar, OpenAlex, Crossref.
Contains information from the Semantic Scholar Academic Graph Datasets, made available under the ODC Attribution License (ODC-BY 1.0).
Semantic Scholar’s data is described in: Kinney, R., et al. (2023). The Semantic Scholar Open Data Platform. arXiv:2301.10140.
