

A Comprehensive Map of Mobile Element Insertion Polymorphisms in Humans
Open accessThe DOI matches its Crossref record; 76 of the 78 references it cites were found in a registry or an index.
Abstract
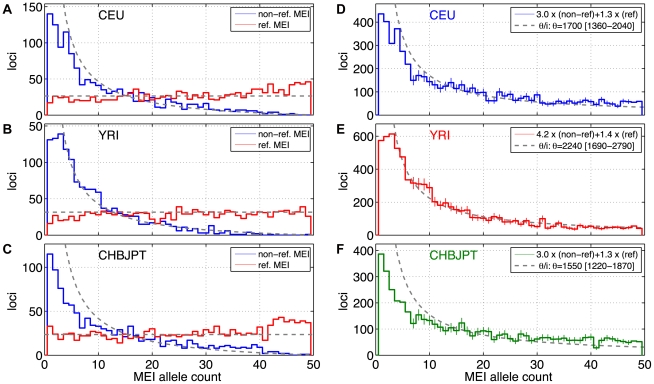
As a consequence of the accumulation of insertion events over evolutionary time, mobile elements now comprise nearly half of the human genome. The Alu, L1, and SVA mobile element families are still duplicating, generating variation between individual genomes. Mobile element insertions (MEI) have been identified as causes for genetic diseases, including hemophilia, neurofibromatosis, and various cancers. Here we present a comprehensive map of 7,380 MEI polymorphisms from the 1000 Genomes Project whole-genome sequencing data of 185 samples in three major populations detected with two detection methods. This catalog enables us to systematically study mutation rates, population segregation, genomic distribution, and functional properties of MEI polymorphisms and to compare MEI to SNP variation from the same individuals. Population allele frequencies of MEI and SNPs are described, broadly, by the same neutral ancestral processes despite vastly different mutation mechanisms and rates, except in coding regions where MEI are virtually absent, presumably due to strong negative selection. A direct comparison of MEI and SNP diversity levels suggests a differential mobile element insertion rate among populations.
Overview
The claims and statistics of this paper haven’t been checked yet.
Free: it reads the open-access text and checks the first 5 claims that cite a source we can check. Create a free account to check every claim.
Integrity signals
Registry
Cites
Statistics
Figures




Verification
Claims the paper makes
The claims and statistics of this paper haven’t been checked yet.
Free: it reads the open-access text and checks the first 5 claims that cite a source we can check. Create a free account to check every claim.
Claims other papers make about this one
Each is checked against this paper’s own text: does it say what the citing paper says it does?
The source backs part of the claim, not all of it — or backs it for a different population, condition or comparison.
In the citing paper
“Most germline KNR insertions (~75%) are present in a single copy per cell as well, since most are in the heterozygous state in individuals of the population.”
From Resolving rates of mutation in the brain using single-neuron genomics (2016) · cites this paper as Stewart et al., 2011
Experimental — accuracy not yet measuredIn the citing paper
“This shows that most KNR insertions in an individual are heterozygous and present in a single copy per cell.”
From Resolving rates of mutation in the brain using single-neuron genomics (2016) · cites this paper as Stewart et al., 2011
Self-check
Percentages, sums and reported differences re-computed from the paper’s own numbers.
The self-check needs the paper’s full text.
Citations
Cites
The Art of Computer Programming
Knuth, D. E. (1968) · Cited by 16,337
Statistical method for testing the neutral mutation hypothesis by DNA polymorphism.
Tajima, F. (1989) · Genetics · doi:10.1093/genetics/123.3.585 · Cited by 13,941
<tt>BLAT</tt> —The <tt>BLAST</tt> -Like Alignment Tool
Kent, W. J. (2002) · Genome Research · doi:10.1101/gr.229202 · Cited by 8,480 · cited 3×
“We then used BLAT [49] to map assembled contigs back to the build 36.3 human reference to identify the boundaries of the inserted sequence.”
MethodInfluentialBase-Calling of Automated Sequencer Traces Using Phred. I. Accuracy Assessment
Ewing, B., Hillier, L., Wendl, M. C., & Green, P. (1998) · Genome Research · doi:10.1101/gr.8.3.175 · Cited by 6,967
Base-Calling of Automated Sequencer Traces Using Phred. II. Error Probabilities
Ewing, B., & Green, P. (1998) · Genome Research · doi:10.1101/gr.8.3.186 · Cited by 5,439 · cited 1×
“The allele count spectra were compared to the standard neutral model”
MethodPrinciples of Population Genetics.
Cormack, R. M., Hartl, D. L., & Clark, A. G. (1990) · Biometrics · doi:10.2307/2531471 · Cited by 5,242
Global variation in copy number in the human genome
Redon, R., Ishikawa, S., Fitch, K. R., Feuk, L., Perry, G. H., Andrews, T. D., Fiegler, H., Shapero, M. H., Carson, A. R., Chen, W., et al. (2006) · Nature · doi:10.1038/nature05329 · Cited by 4,288
On the number of segregating sites in genetical models without recombination
Watterson, G. A. (1975) · Theoretical Population Biology · doi:10.1016/0040-5809(75)90020-9 · Cited by 3,915
Evolutionary Rate at the Molecular Level
KIMURA, M. (1968) · Nature · doi:10.1038/217624a0 · Cited by 3,737
Accurate whole human genome sequencing using reversible terminator chemistry
Bentley, D. R., Balasubramanian, S., Swerdlow, H. P., Smith, G. P., Milton, J., Brown, C. G., Hall, K. P., Evers, D. J., Barnes, C. L., Bignell, H. R., et al. (2008) · Nature · doi:10.1038/nature07517 · Cited by 3,684
Repbase Update, a database of eukaryotic repetitive elements
Jurka, J., Kapitonov, V. V., Pavlicek, A., Klonowski, P., Kohany, O., & Walichiewicz, J. (2005) · Cytogenetic and Genome Research · doi:10.1159/000084979 · Cited by 3,370
The Estimation of Animal Abundance and Related Parameters.
Cormack, R. M., & Seber, G. A. F. (1984) · Biometrics · doi:10.2307/2531423 · Cited by 3,289
Browning, S. R., & Browning, B. L. (2007) · The American Journal of Human Genetics · doi:10.1086/521987 · Cited by 3,210
Mapping short DNA sequencing reads and calling variants using mapping quality scores
Li, H., Ruan, J., & Durbin, R. (2008) · Genome Research · doi:10.1101/gr.078212.108 · Cited by 2,638
Initial sequence of the chimpanzee genome and comparison with the human genome
The Chimpanzee Sequencing and Analysis Consortium (2005) · Nature · doi:10.1038/nature04072 · Cited by 2,459
The Art of Computer Programming
Worlton, W. J. (1968) · Nuclear Science and Engineering · doi:10.13182/nse68-a19548 · Cited by 2,251
Ye, K., Schulz, M. H., Long, Q., Apweiler, R., & Ning, Z. (2009) · Bioinformatics · doi:10.1093/bioinformatics/btp394 · Cited by 2,022
Gutenkunst, R. N., Hernandez, R. D., Williamson, S. H., & Bustamante, C. D. (2009) · PLoS Genetics · doi:10.1371/journal.pgen.1000695 · Cited by 1,906 · cited 4×
“SNP studies that the shape of the allele frequency spectrum is modulated by demographic history, and that this shape is characteristically different for European, African, and Asian populations [56,57].”
BackgroundMethodInfluentialThe UCSC Genome Browser database: update 2011
Fujita, P. A., Rhead, B., Zweig, A. S., Hinrichs, A. S., Karolchik, D., Cline, M. S., Goldman, M., Barber, G. P., Clawson, H., Coelho, A., et al. (2011) · Nucleic Acids Research · doi:10.1093/nar/gkq963 · Cited by 1,811
The Diploid Genome Sequence of an Individual Human
Levy, S., Sutton, G., Ng, P. C., Feuk, L., Halpern, A. L., Walenz, B. P., Axelrod, N., Huang, J., Kirkness, E. F., Denisov, G., et al. (2007) · PLoS Biology · doi:10.1371/journal.pbio.0050254 · Cited by 1,778 · cited 11×
“These approaches have been augmented by comparisons of the NCBI and the HuRef genomes [22,23], large scale fosmid-end sequences [24], and targeted sequencing of element-specific PCR products [25–28].”
BackgroundMethodInfluentialThe impact of retrotransposons on human genome evolution
Cordaux, R., & Batzer, M. A. (2009) · Nature Reviews Genetics · doi:10.1038/nrg2640 · Cited by 1,703
Self-citationAbyzov, A., Urban, A. E., Snyder, M., & Gerstein, M. (2011) · Genome Research · doi:10.1101/gr.114876.110 · Cited by 1,658 · cited 1×
“All but one of the reference MEI were found by one or more of the RP or SR deletion detection algorithms that were part of the released 1000GP deletion call set [30,38–42] with a small overlapping contribution from algorithms based on assembly or read depth methods [43,44] (Figure 1d, Table S3).”
MethodSelf-citationART: a next-generation sequencing read simulator
Huang, W., Li, L., Myers, J. R., & Marth, G. T. (2012) · Bioinformatics · doi:10.1093/bioinformatics/btr708 · Cited by 1,596
Self-citationBreakDancer: an algorithm for high-resolution mapping of genomic structural variation
Chen, K., Wallis, J. W., McLellan, M. D., Larson, D. E., Kalicki, J. M., Pohl, C. S., McGrath, S. D., Wendl, M. C., Zhang, Q., Locke, D. P., et al. (2009) · Nature Methods · doi:10.1038/nmeth.1363 · Cited by 1,479
Alu repeats and human genomic diversity
Batzer, M. A., & Deininger, P. L. (2002) · Nature Reviews Genetics · doi:10.1038/nrg798 · Cited by 1,470
Self-citationEstimate of the Mutation Rate per Nucleotide in Humans
Nachman, M. W., & Crowell, S. L. (2000) · Genetics · doi:10.1093/genetics/156.1.297 · Cited by 1,209
Paired-End Mapping Reveals Extensive Structural Variation in the Human Genome
Korbel, J. O., Urban, A. E., Affourtit, J. P., Godwin, B., Grubert, F., Simons, J. F., Kim, P. M., Palejev, D., Carriero, N. J., Du, L., et al. (2007) · Science · doi:10.1126/science.1149504 · Cited by 1,163
Self-citationMapping copy number variation by population-scale genome sequencing
1000 Genomes Project, Mills, R. E., Walter, K., Stewart, C., Handsaker, R. E., Chen, K., Alkan, C., Abyzov, A., Yoon, S. C., Ye, K., et al. (2011) · Nature · doi:10.1038/nature09708 · Cited by 1,140
Self-citationMapping and sequencing of structural variation from eight human genomes
Kidd, J. M., Cooper, G. M., Donahue, W. F., Hayden, H. S., Sampas, N., Graves, T., Hansen, N., Teague, B., Alkan, C., Antonacci, F., et al. (2008) · Nature · doi:10.1038/nature06862 · Cited by 1,119
Hot L1s account for the bulk of retrotransposition in the human population
Brouha, B., Schustak, J., Badge, R. M., Lutz-Prigge, S., Farley, A. H., Moran, J. V., & Kazazian, H. H. (2003) · Proceedings of the National Academy of Sciences · doi:10.1073/pnas.0831042100 · Cited by 1,073 · cited 4×
“A full-length L1 is a sequence of roughly 6 kb in length and the most active L1 sub-family in the human lineage is L1HS [8,9].”
BackgroundInfluentialLINE-mediated retrotransposition of marked Alu sequences
Dewannieux, M., Esnault, C., & Heidmann, T. (2003) · Nature Genetics · doi:10.1038/ng1223 · Cited by 1,023
High frequency retrotransposition in cultured mammalian cells
Moran, J. V., Holmes, S. E., Naas, T. P., DeBerardinis, R. J., Boeke, J. D., & Kazazian, H. H. (1996) · Cell · doi:10.1016/s0092-8674(00)81998-4 · Cited by 1,022
Statistical Properties of Segregating Sites
Fu, Y. X. (1995) · Theoretical Population Biology · doi:10.1006/tpbi.1995.1025 · Cited by 939
Kazazian, H. H., Wong, C., Youssoufian, H., Scott, A. F., Phillips, D. G., & Antonarakis, S. E. (1988) · Nature · doi:10.1038/332164a0 · Cited by 929
The regulated retrotransposon transcriptome of mammalian cells
Faulkner, G. J., Kimura, Y., Daub, C. O., Wani, S., Plessy, C., Irvine, K. M., Schroder, K., Cloonan, N., Steptoe, A. L., Lassmann, T., et al. (2009) · Nature Genetics · doi:10.1038/ng.368 · Cited by 828
L1 retrotransposition in human neural progenitor cells
Coufal, N. G., Garcia-Perez, J. L., Peng, G. E., Yeo, G. W., Mu, Y., Lovci, M. T., Morell, M., O’Shea, K. S., Moran, J. V., & Gage, F. H. (2009) · Nature · doi:10.1038/nature08248 · Cited by 814 · cited 2×
“4] %, followed by L1s (17 [10–27] %), and SVAs (27 [8–55] %) with 95% confidence intervals.”
BackgroundChen, F.-C., & Li, W.-H. (2001) · The American Journal of Human Genetics · doi:10.1086/318206 · Cited by 720
An initial map of insertion and deletion (INDEL) variation in the human genome
Mills, R. E., Luttig, C. T., Larkins, C. E., Beauchamp, A., Tsui, C., Pittard, W. S., & Devine, S. E. (2006) · Genome Research · doi:10.1101/gr.4565806 · Cited by 673 · cited 1×
“[4,47] from 1000GP samples NA12878 and NA12156 matched”
BackgroundLINE-1 Retrotransposition Activity in Human Genomes
Beck, C. R., Collier, P., Macfarlane, C., Malig, M., Kidd, J. M., Eichler, E. E., Badge, R. M., & Moran, J. V. (2010) · Cell · doi:10.1016/j.cell.2010.05.021 · Cited by 632
Sensitive and accurate detection of copy number variants using read depth of coverage
Yoon, S., Xuan, Z., Makarov, V., Ye, K., & Sebat, J. (2009) · Genome Research · doi:10.1101/gr.092981.109 · Cited by 627
Calibrating a coalescent simulation of human genome sequence variation
Schaffner, S. F., Foo, C., Gabriel, S., Reich, D., Daly, M. J., & Altshuler, D. (2005) · Genome Research · doi:10.1101/gr.3709305 · Cited by 616
The UCSC Genome Browser database: update 2010
Rhead, B., Karolchik, D., Kuhn, R. M., Hinrichs, A. S., Zweig, A. S., Fujita, P. A., Diekhans, M., Smith, K. E., Rosenbloom, K. R., Raney, B. J., et al. (2010) · Nucleic Acids Research · doi:10.1093/nar/gkp939 · Cited by 568
Natural mutagenesis of human genomes by endogenous retrotransposons
Iskow, R. C., McCabe, M. T., Mills, R. E., Torene, S., Pittard, W. S., Neuwald, A. F., Van Meir, E. G., Vertino, P. M., & Devine, S. E. (2010) · Cell · doi:10.1016/j.cell.2010.05.020 · Cited by 551
Which transposable elements are active in the human genome?
Mills, R. E., Bennett, E. A., Iskow, R. C., & Devine, S. E. (2007) · Trends in Genetics · doi:10.1016/j.tig.2007.02.006 · Cited by 511
Complete Khoisan and Bantu genomes from southern Africa
Schuster, S. C., Miller, W., Ratan, A., Tomsho, L. P., Giardine, B., Kasson, L. R., Harris, R. S., Petersen, D. C., Zhao, F., Qi, J., et al. (2010) · Nature · doi:10.1038/nature08795 · Cited by 499
Automated Finishing with Autofinish
Gordon, D., Desmarais, C., & Green, P. (2001) · Genome Research · doi:10.1101/gr.171401 · Cited by 376
SVA Elements: A Hominid-specific Retroposon Family
Wang, H., Xing, J., Grover, D., Hedges, D. J., Han, K., Walker, J. A., & Batzer, M. A. (2005) · Journal of Molecular Biology · doi:10.1016/j.jmb.2005.09.085 · Cited by 371
Self-citationSVA Elements Are Nonautonomous Retrotransposons that Cause Disease in Humans
Ostertag, E. M., Goodier, J. L., Zhang, Y., & Kazazian, H. H. (2003) · The American Journal of Human Genetics · doi:10.1086/380207 · Cited by 347
Discovery and genotyping of genome structural polymorphism by sequencing on a population scale
Handsaker, R. E., Korn, J. M., Nemesh, J., & McCarroll, S. A. (2011) · Nature Genetics · doi:10.1038/ng.768 · Cited by 343
Recent common ancestry of human Y chromosomes: Evidence from DNA sequence data
Thomson, R., Pritchard, J. K., Shen, P., Oefner, P. J., & Feldman, M. W. (2000) · Proceedings of the National Academy of Sciences · doi:10.1073/pnas.97.13.7360 · Cited by 337
Human Genomic Deletions Mediated by Recombination between Alu Elements
Sen, S. K., Han, K., Wang, J., Lee, J., Wang, H., Callinan, P. A., Dyer, M., Cordaux, R., Liang, P., & Batzer, M. A. (2006) · The American Journal of Human Genetics · doi:10.1086/504600 · Cited by 336
Self-citationTowards a comprehensive structural variation map of an individual human genome
Pang, A. W., MacDonald, J. R., Pinto, D., Wei, J., Rafiq, M. A., Conrad, D. F., Park, H., Hurles, M. E., Lee, C., Venter, J. C., et al. (2010) · Genome Biology · doi:10.1186/gb-2010-11-5-r52 · Cited by 335
Marth, G. T., Czabarka, E., Murvai, J., & Sherry, S. T. (2004) · Genetics · doi:10.1534/genetics.166.1.351 · Cited by 327
Self-citationMaster genes in mammalian repetitive DNA amplification
Deininger, P. L., Batzer, M. A., Hutchison, C. A., & Edgell, M. H. (1992) · Trends in Genetics · doi:10.1016/0168-9525(92)90262-3 · Cited by 316
Self-citationMobile elements create structural variation: Analysis of a complete human genome
Xing, J., Zhang, Y., Han, K., Salem, A. H., Sen, S. K., Huff, C. D., Zhou, Q., Kirkness, E. F., Levy, S., Batzer, M. A., et al. (2009) · Genome Research · doi:10.1101/gr.091827.109 · Cited by 311
Self-citationEwing, A. D., & Kazazian, H. H. (2010) · Genome Research · doi:10.1101/gr.106419.110 · Cited by 303
Combinatorial Algorithms for Structural Variation Detection in High Throughput Sequenced Genomes
Hormozdiari, F., Alkan, C., Eichler, E. E., & Sahinalp, S. C. (2009) · Lecture Notes in Computer Science · doi:10.1007/978-3-642-02008-7_16 · Cited by 298
Mutation analysis in the BRCA2 gene in primary breast cancers
Miki, Y., Katagiri, T., Kasumi, F., Yoshimoto, T., & Nakamura, Y. (1996) · Nature Genetics · doi:10.1038/ng0696-245 · Cited by 284
Mobile Interspersed Repeats Are Major Structural Variants in the Human Genome
Huang, C. R. L., Schneider, A. M., Lu, Y., Niranjan, T., Shen, P., Robinson, M. A., Steranka, J. P., Valle, D., Civin, C. I., Wang, T., et al. (2010) · Cell · doi:10.1016/j.cell.2010.05.026 · Cited by 251
Evolutionary history of 7SL RNA-derived SINEs in Supraprimates
Kriegs, J. O., Churakov, G., Jurka, J., Brosius, J., & Schmitz, J. (2007) · Trends in Genetics · doi:10.1016/j.tig.2007.02.002 · Cited by 238
Progress in understanding the biology of the human mutagen LINE-1
Babushok, D. V., & Kazazian, H. H. (2007) · Human Mutation · doi:10.1002/humu.20486 · Cited by 208
dbRIP: A highly integrated database of retrotransposon insertion polymorphisms in humans
Wang, J., Song, L., Grover, D., Azrak, S., Batzer, M. A., & Liang, P. (2006) · Human Mutation · doi:10.1002/humu.20307 · Cited by 198
Self-citationBurgess, R., & Yang, Z. (2008) · Molecular Biology and Evolution · doi:10.1093/molbev/msn148 · Cited by 184
Estimating the retrotransposition rate of human Alu elements
Cordaux, R., Hedges, D. J., Herke, S. W., & Batzer, M. A. (2006) · Gene · doi:10.1016/j.gene.2006.01.019 · Cited by 164
Self-citationRecently Mobilized Transposons in the Human and Chimpanzee Genomes
Mills, R. E., Bennett, E. A., Iskow, R. C., Luttig, C. T., Tsui, C., Pittard, W. S., & Devine, S. E. (2006) · The American Journal of Human Genetics · doi:10.1086/501028 · Cited by 161
LINE dancing in the human genome: transposable elements and disease
Belancio, V. P., Deininger, P. L., & Roy-Engel, A. M. (2009) · Genome Medicine · doi:10.1186/gm97 · Cited by 146
L1 recombination-associated deletions generate human genomic variation
Han, K., Lee, J., Meyer, T. J., Remedios, P., Goodwin, L., & Batzer, M. A. (2008) · Proceedings of the National Academy of Sciences · doi:10.1073/pnas.0807866105 · Cited by 144
Self-citationWhole-genome resequencing allows detection of many rare LINE-1 insertion alleles in humans
Ewing, A. D., & Kazazian, H. H. (2011) · Genome Research · doi:10.1101/gr.114777.110 · Cited by 138
Estimating Ancestral Population Sizes and Divergence Times
Wall, J. D. (2003) · Genetics · doi:10.1093/genetics/163.1.395 · Cited by 135
Retrotransposition of Alu elements: how many sources?
Cordaux, R., Hedges, D. J., & Batzer, M. A. (2004) · Trends in Genetics · doi:10.1016/j.tig.2004.07.012 · Cited by 116
Self-citationMeasurements of spontaneous rates of mutations in the recent past and the near future
Kondrashov, F. A., & Kondrashov, A. S. (2010) · Philosophical Transactions of the Royal Society B: Biological Sciences · doi:10.1098/rstb.2009.0286 · Cited by 110
Alu repeat discovery and characterization within human genomes
Hormozdiari, F., Alkan, C., Ventura, M., Hajirasouliha, I., Malig, M., Hach, F., Yorukoglu, D., Dao, P., Bakhshi, M., Sahinalp, S. C., et al. (2011) · Genome Research · doi:10.1101/gr.115956.110 · Cited by 100
Fine-scaled human genetic structure revealed by SNP microarrays
Xing, J., Watkins, W. S., Witherspoon, D. J., Zhang, Y., Guthery, S. L., Thara, R., Mowry, B. J., Bulayeva, K., Weiss, R. B., & Jorde, L. B. (2009) · Genome Research · doi:10.1101/gr.085589.108 · Cited by 93
Self-citationMobile element scanning (ME-Scan) by targeted high-throughput sequencing
Witherspoon, D. J., Xing, J., Zhang, Y., Watkins, W. S., Batzer, M. A., & Jorde, L. B. (2010) · BMC Genomics · doi:10.1186/1471-2164-11-410 · Cited by 91
Self-citationKonkel, M. K., Wang, J., Liang, P., & Batzer, M. A. (2006) · Gene · doi:10.1016/j.gene.2006.07.040 · Cited by 37
Self-citationClustering with local equivalence relations
Youssef, S. (1987) · Computer Physics Communications · doi:10.1016/0010-4655(87)90184-6 · Cited by 12
Research works printed but not linked: 1
- Genomes Project Consortium 2010 Towards a comprehensive map of human sequence variation. Nature
Cited by
An integrated map of structural variation in 2,504 human genomes
Sudmant, P. H., Rausch, T., Gardner, E. J., Handsaker, R. E., Abyzov, A., Huddleston, J., Zhang, Y., Ye, K., Jun, G., Hsi-Yang Fritz, M., et al. (2015) · Nature · doi:10.1038/nature15394 · Cited by 2,354
Self-citationPersonal omics profiling reveals dynamic molecular and medical phenotypes
Chen, R., Mias, G. I., Li-Pook-Than, J., Jiang, L., Lam, H. Y. K., Chen, R., Miriami, E., Karczewski, K. J., Hariharan, M., Dewey, F. E., et al. (2012) · Cell · doi:10.1016/j.cell.2012.02.009 · Cited by 1,291
Self-citationMapping copy number variation by population-scale genome sequencing
1000 Genomes Project, Mills, R. E., Walter, K., Stewart, C., Handsaker, R. E., Chen, K., Alkan, C., Abyzov, A., Yoon, S. C., Ye, K., et al. (2011) · Nature · doi:10.1038/nature09708 · Cited by 1,140
Self-citationResolving the complexity of the human genome using single-molecule sequencing
Chaisson, M. J. P., Huddleston, J., Dennis, M. Y., Sudmant, P. H., Malig, M., Hormozdiari, F., Antonacci, F., Surti, U., Sandstrom, R., Boitano, M., et al. (2015) · Nature · doi:10.1038/nature13907 · Cited by 783
Landscape of Somatic Retrotransposition in Human Cancers
Lee, E., Iskow, R., Yang, L., Gokcumen, O., Haseley, P., Luquette, L. J., Lohr, J. G., Harris, C. C., Ding, L., Wilson, R. K., et al. (2012) · Science · doi:10.1126/science.1222077 · Cited by 762
Metadata
- Authors
- Stewart, C., Kural, D., Strömberg, M. P., Walker, J. A., Konkel, M. K., Stütz, A. M., Urban, A. E., Grubert, F., Lam, H. Y. K., Lee, W.-P., Busby, M., Indap, A. R., Garrison, E., Huff, C., Xing, J., Snyder, M. P., Jorde, L. B., Batzer, M. A., Korbel, J. O., Marth, G. T., & 1000 Genomes Project
- Affiliations
- Boston College (US)
- Louisiana State University (US)
- European Molecular Biology Laboratory (DE)
- Stanford University (US)
- University of Utah (US)
- ORCID
- Venue
- PLoS Genetics
- Publisher
- Public Library of Science (PLoS)
- Published
- 2011-08-18
- Volume
- 7
- Issue
- 8
- Pages
- e1002236
- ISSN
- 1553-7390 (ISSN-L)
- 1553-7404
- PMC
- PMC3158055
- OpenAlex
- W2091687746
- Cited by
- 307
- References
- 78
- Citations by year
- 2026: 3 · 2025: 8 · 2024: 4 · 2023: 13 · 2022: 17 · 2021: 13 · 2020: 33 · 2019: 29 · 2018: 20 · 2017: 26 · 2016: 24 · 2015: 28 · 2014: 29 · 2013: 32 · 2012: 22
- FWCI
- 33.82
- Type
- journal article
- Language
- en
- Open access
- gold
- doi.org
- Locations
- PLoS Genetics (publishedVersion, cc-by)
- Europe PMC (PubMed Central) (publishedVersion, cc-by)
- PubMed Central (publishedVersion, cc-by)
- PubMed (publishedVersion)
- Civil War Book Review (submittedVersion)
- DOAJ (DOAJ: Directory of Open Access Journals) (submittedVersion, cc-by-sa)
- Figshare (submittedVersion, cc-by)
- Funders
- Wellcome Trust (085532)
- National Institutes of Health
- National Human Genome Research Institute (HG005552, K99HG005846, R01HG004719, RC2HG005552, HG004719)
- National Institute of General Medical Sciences (R01GM059290, R01 GM59290)
- Topics
- Life Sciences › Biochemistry, Genetics and Molecular Biology › Genetics › Chromosomal and Genetic Variations
- Life Sciences › Biochemistry, Genetics and Molecular Biology › Genetics › Genomic variations and chromosomal abnormalities
- Life Sciences › Biochemistry, Genetics and Molecular Biology › Genetics › Genome Rearrangement Algorithms
- Keywords
- mobile element insertions, insertion polymorphism, Alu elements, LINE-1 retrotransposons, SVA retrotransposon, human genome, 1000 Genomes Project, population allele frequencies, mutation rate, population segregation, negative selection, hemophilia, neurofibromatosis, cancer
- MeSH terms
- DNA Transposable Elements, Gene Frequency, Genotype, Heterozygote, Humans, Genome, Human, Mutagenesis, Insertional, Polymorphism, Single Nucleotide, Mutation Rate
About these checks
Registry, retraction, Cites and statistics results are computed, not judged, with one exception: a printed reference that no index lists is read once by a model before it counts as a citation error. Claims are extracted by a model and kept only when their quote appears verbatim in the text; each cited source is then checked, with a model’s help, for whether it says what the claim relies on. Those verdicts can be wrong — read the claim’s quote and the cited source before relying on one.
Statistics and arithmetic are recomputed, not judged.
Confidence bands are shown only for fields calibrated on our annotated test set. None is calibrated yet, so no band is shown.
What counts as a claim ›How we measure confidence ›How we check this ›
Are you an author, or do you see a problem with this page? Request a review
Data sources
Bibliographic data: Semantic Scholar, OpenAlex, Crossref.
Contains information from the Semantic Scholar Academic Graph Datasets, made available under the ODC Attribution License (ODC-BY 1.0).
Semantic Scholar’s data is described in: Kinney, R., et al. (2023). The Semantic Scholar Open Data Platform. arXiv:2301.10140.
