

The DOI matches its Crossref record; 67 of the 68 references it cites were found in a registry or an index.
The Number of X Chromosomes Causes Sex Differences in Adiposity in Mice
Open accessAbstract
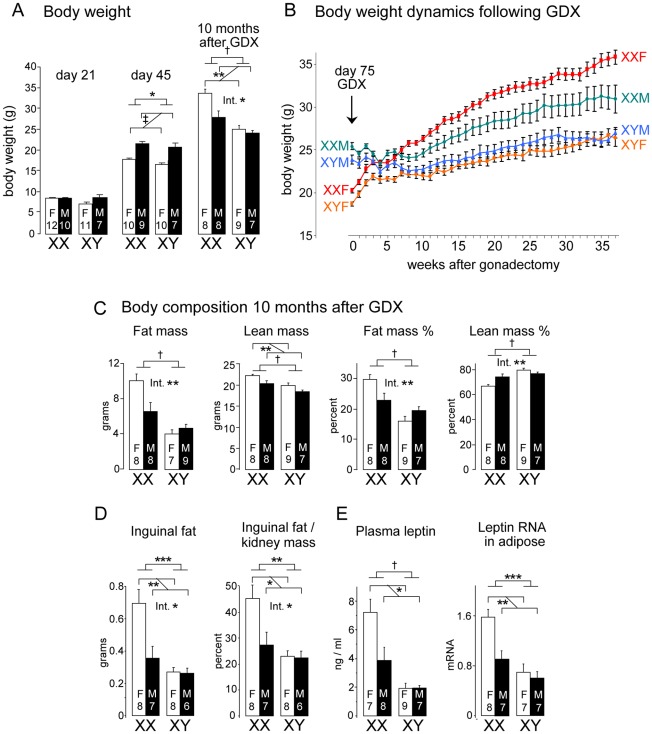
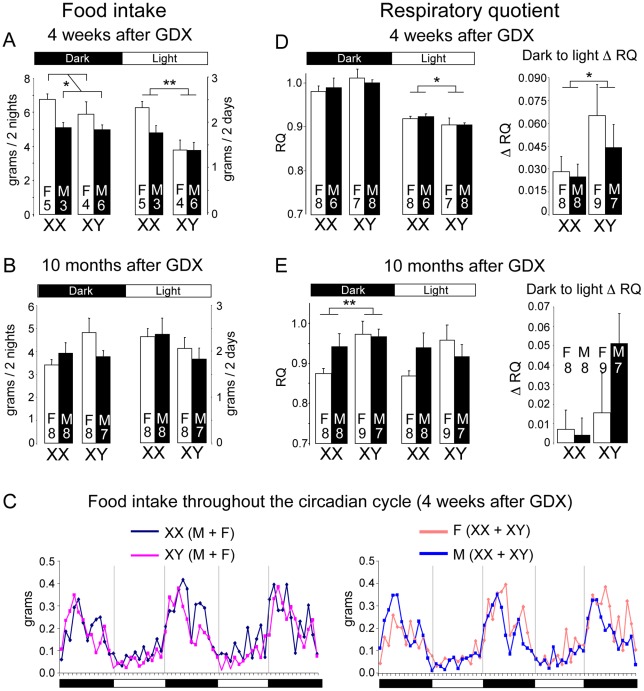
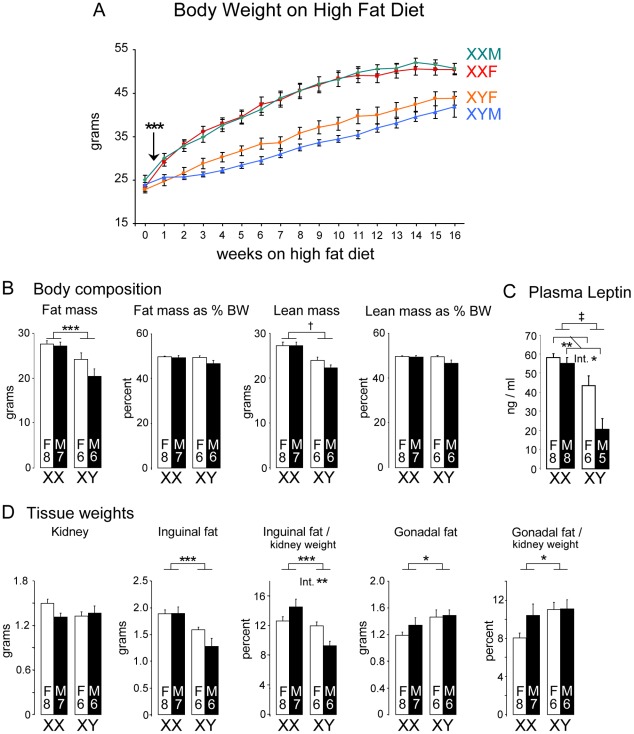
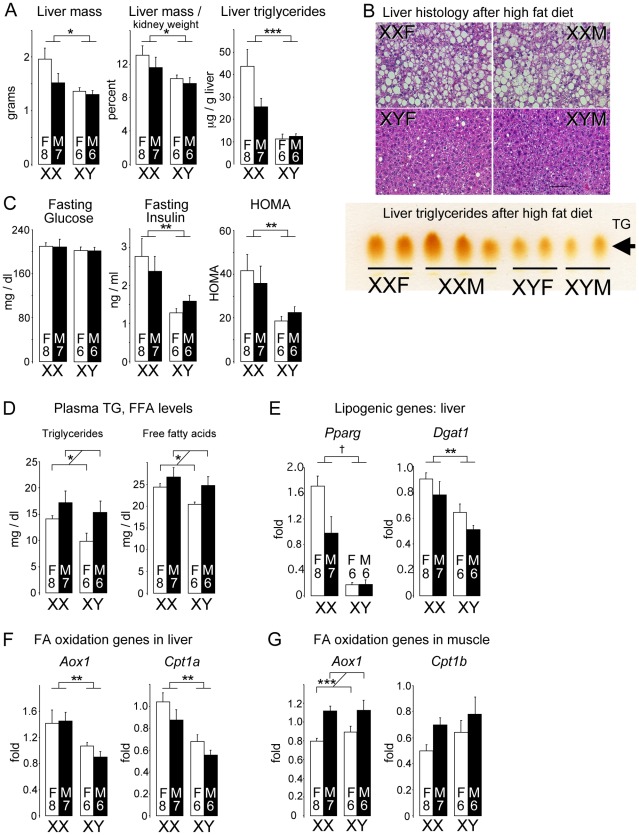
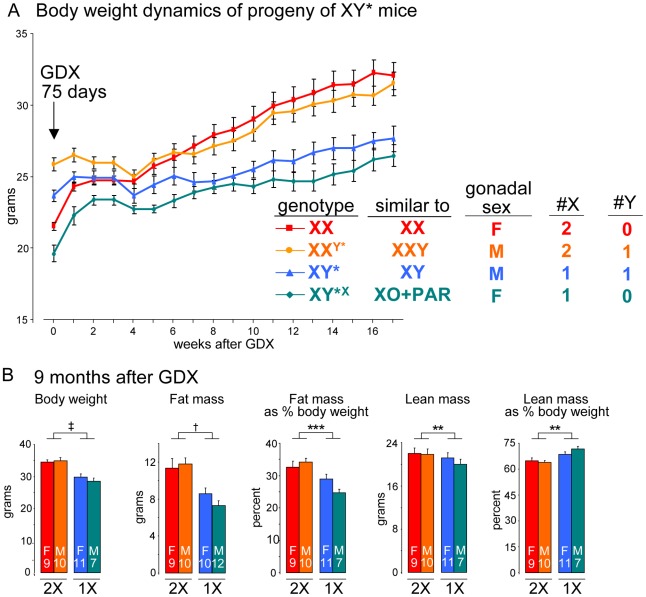
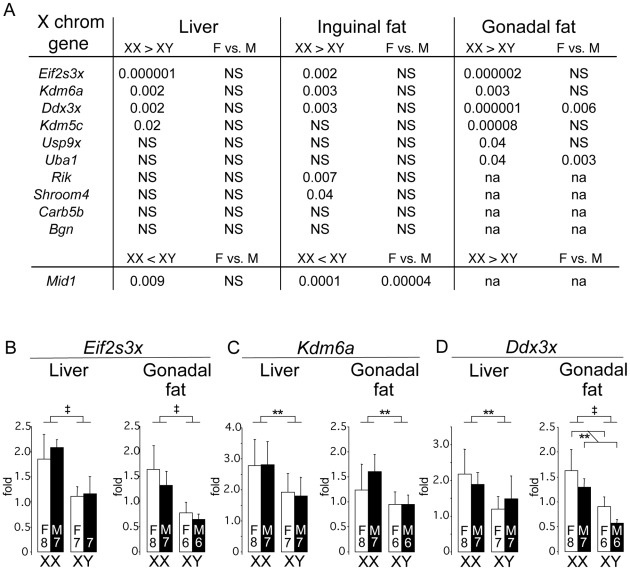
Sexual dimorphism in body weight, fat distribution, and metabolic disease has been attributed largely to differential effects of male and female gonadal hormones. Here, we report that the number of X chromosomes within cells also contributes to these sex differences. We employed a unique mouse model, known as the "four core genotypes," to distinguish between effects of gonadal sex (testes or ovaries) and sex chromosomes (XX or XY). With this model, we produced gonadal male and female mice carrying XX or XY sex chromosome complements. Mice were gonadectomized to remove the acute effects of gonadal hormones and to uncover effects of sex chromosome complement on obesity. Mice with XX sex chromosomes (relative to XY), regardless of their type of gonad, had up to 2-fold increased adiposity and greater food intake during daylight hours, when mice are normally inactive. Mice with two X chromosomes also had accelerated weight gain on a high fat diet and developed fatty liver and elevated lipid and insulin levels. Further genetic studies with mice carrying XO and XXY chromosome complements revealed that the differences between XX and XY mice are attributable to dosage of the X chromosome, rather than effects of the Y chromosome. A subset of genes that escape X chromosome inactivation exhibited higher expression levels in adipose tissue and liver of XX compared to XY mice, and may contribute to the sex differences in obesity. Overall, our study is the first to identify sex chromosome complement, a factor distinguishing all male and female cells, as a cause of sex differences in obesity and metabolism.
Overview
The claims and statistics of this paper haven’t been checked yet.
Run the check — free, no account needed. It reads the open-access text and checks the sources it cites.
Integrity signals
Registry
Cites
Statistics
Figures
Verification
Claims the paper makes
The claims and statistics of this paper haven’t been checked yet.
Run the check — free, no account needed. It reads the open-access text and checks the sources it cites.
Claims other papers make about this one
Each is checked against this paper’s own text: does it say what the citing paper says it does?
The cited source says what the claim attributes to it.
In the citing paper
“the four core genotypes mouse model which incorporates mice with four different combinations of gonads and sex chromosomes [66, 67], has helped identify the influence of sex chromosomes on physical traits, such as obesity and food intake [68, 69].”
From Integrating Transwomen and Female Athletes with Differences of Sex Development (DSD) into Elite Competition: The FIMS 2021 Consensus Statement (2021) · cites this paper as [68]
The cited source says what the claim attributes to it.
In the citing paper
“When placed on a high-fat diet, XX mice gained adiposity and developed fatty liver and insulin resistance regardless of their original gonadal sex.”
From Sex differences in metabolic homeostasis, diabetes, and obesity (2015) · cites this paper as [74]
The cited source says what the claim attributes to it.
In the citing paper
“Using this model, Chen et al. showed that male and female XX mice exhibit increased fat depots and increased food intake compared to XY mice.”
From Sex differences in metabolic homeostasis, diabetes, and obesity (2015) · cites this paper as [74]
Self-check
Percentages, sums and reported differences re-computed from the paper’s own numbers.
The self-check needs the paper’s full text.
Citations
Cites
Subcutaneous and visceral adipose tissue: their relation to the metabolic syndrome
Wajchenberg, B. L. (2000) · Endocrine Reviews · doi:10.1210/edrv.21.6.0415 · Cited by 2,961
Insulin Resistance and the Polycystic Ovary Syndrome: Mechanism and Implications for Pathogenesis
Dunaif, A. E. (1997) · Endocrine Reviews · doi:10.1210/edrv.18.6.0318 · Cited by 2,776
X-inactivation profile reveals extensive variability in X-linked gene expression in females
Carrel, L., & Willard, H. F. (2005) · Nature · doi:10.1038/nature03479 · Cited by 2,097
Human Fatty Liver Disease: Old Questions and New Insights
Cohen, J. C., Horton, J. D., & Hobbs, H. H. (2011) · Science · doi:10.1126/science.1204265 · Cited by 2,089
Circadian integration of metabolism and energetics
Bass, J., & Takahashi, J. S. (2010) · Science · doi:10.1126/science.1195027 · Cited by 1,910
Cnop, M., Havel, P. J., Utzschneider, K. M., Carr, D. B., Sinha, M. K., Boyko, E. J., Retzlaff, B. M., Knopp, R. H., Brunzell, J. D., & Kahn, S. E. (2003) · Diabetologia · doi:10.1007/s00125-003-1074-z · Cited by 1,483
Increased adipose tissue in male and female estrogen receptor-α knockout mice
Heine, P. A., Taylor, J. A., Iwamoto, G. A., Lubahn, D. B., & Cooke, P. S. (2000) · Proceedings of the National Academy of Sciences · doi:10.1073/pnas.97.23.12729 · Cited by 1,282
Diet-Induced Type II Diabetes in C57BL/6J Mice
Surwit, R. S., Kuhn, C. M., Cochrane, C., McCubbin, J. A., & Feinglos, M. N. (1988) · Diabetes · doi:10.2337/diab.37.9.1163 · Cited by 1,211
Insulin Resistance and the Polycystic Ovary Syndrome: Mechanism and Implications for Pathogenesis
Dunaif, A. E. (1997) · Endocrine Reviews · doi:10.1210/er.18.6.774 · Cited by 1,167
Increased visceral fat and decreased energy expenditure during the menopausal transition
Lovejoy, J. C., Champagne, C. M., de Jonge, L., Xie, H., & Smith, S. R. (2008) · International Journal of Obesity · doi:10.1038/ijo.2008.25 · Cited by 1,020 · cited 1×
“In humans and many other mammals, differences exist between males and females in the amounts and anatomical distribution of fat storage [5,6,7,8,9].”
Background
Cited by
Sorted by citations
Sex and Gender Differences in Risk, Pathophysiology and Complications of Type 2 Diabetes Mellitus
Kautzky-Willer, A., Harreiter, J., & Pacini, G. (2016) · Endocrine Reviews · doi:10.1210/er.2015-1137 · Cited by 2,043
Policy: NIH to balance sex in cell and animal studies
Clayton, J. A., & Collins, F. S. (2014) · Nature · doi:10.1038/509282a · Cited by 1,816
Obesity, Adipose Tissue and Vascular Dysfunction
Koenen, M., Hill, M. A., Cohen, P., & Sowers, J. R. (2021) · Circulation Research · doi:10.1161/circresaha.121.318093 · Cited by 979
Animal models of obesity and diabetes mellitus
Kleinert, M., Clemmensen, C., Hofmann, S. M., Moore, M. C., Renner, S., Woods, S. C., Huypens, P., Beckers, J., de Angelis, M. H., Schürmann, A., et al. (2018) · Nature Reviews Endocrinology · doi:10.1038/nrendo.2017.161 · Cited by 893
Sex differences in metabolic homeostasis, diabetes, and obesity
Mauvais-Jarvis, F. (2015) · Biology of Sex Differences · doi:10.1186/s13293-015-0033-y · Cited by 626
“that the X and Y chromosomes program sex differences in metabolic regulation [74].”
BackgroundSex differences in the physiology of eating
Asarian, L., & Geary, N. (2013) · American Journal of Physiology-Regulatory, Integrative and Comparative Physiology · doi:10.1152/ajpregu.00446.2012 · Cited by 513
Sex-specific differences in hypertension and associated cardiovascular disease
Colafella, K. M. M., & Denton, K. M. (2018) · Nature Reviews Nephrology · doi:10.1038/nrneph.2017.189 · Cited by 505
Age and Sex Are Critical Factors in Ischemic Stroke Pathology
Roy-O’Reilly, M. A., & McCullough, L. D. (2018) · Endocrinology · doi:10.1210/en.2018-00465 · Cited by 498
Leeners, B., Geary, N., Tobler, P. N., & Asarian, L. (2017) · Human Reproduction Update · doi:10.1093/humupd/dmw045 · Cited by 407
Gender and Sex Differences in Adipose Tissue
Chang, E. T., Varghese, M., & Singer, K. (2018) · Current Diabetes Reports · doi:10.1007/s11892-018-1031-3 · Cited by 414
Sex and gender differences in developmental programming of metabolism
Dearden, L., Bouret, S. G., & Ozanne, S. E. (2018) · Molecular Metabolism · doi:10.1016/j.molmet.2018.04.007 · Cited by 353
Sex Hormones and Sex Chromosomes Cause Sex Differences in the Development of Cardiovascular Diseases
Arnold, A. P., Cassis, L. A., Eghbali, M., Reue, K., & Sandberg, K. L. (2017) · Arteriosclerosis Thrombosis and Vascular Biology · doi:10.1161/atvbaha.116.307301 · Cited by 339
Self-citationFrank, A. P., Santos, R. D. S., Palmer, B. F., & Clegg, D. J. (2018) · Journal of Lipid Research · doi:10.1194/jlr.r086975 · Cited by 335
Sexual Dimorphism in Innate Immunity: The Role of Sex Hormones and Epigenetics
Shepherd, R., Cheung, A. S., Pang, K. C., Saffery, R., & Novakovic, B. (2021) · Frontiers in Immunology · doi:10.3389/fimmu.2020.604000 · Cited by 322
X chromosome regulation: diverse patterns in development, tissues and disease
Deng, X., Berletch, J. B., Nguyen, D. K., & Distèche, C. M. (2014) · Nature Reviews Genetics · doi:10.1038/nrg3687 · Cited by 316
Rich-Edwards, J. W., Kaiser, U. B., Chen, G. L., Manson, J. E., & Goldstein, J. M. (2018) · Endocrine Reviews · doi:10.1210/er.2017-00246 · Cited by 273
Genetic Basis for Sex Differences in Obesity and Lipid Metabolism
Link, J. C., & Reue, K. (2017) · Annual Review of Nutrition · doi:10.1146/annurev-nutr-071816-064827 · Cited by 306
Self-citationA general theory of sexual differentiation
Arnold, A. P. (2016) · Journal of Neuroscience Research · doi:10.1002/jnr.23884 · Cited by 292
Self-citationSex differences and the neurobiology of affective disorders
Rubinow, D. R., & Schmidt, P. J. (2018) · Neuropsychopharmacology · doi:10.1038/s41386-018-0148-z · Cited by 286
A Guide for the Design of Pre-clinical Studies on Sex Differences in Metabolism
Mauvais‐Jarvis, F., Arnold, A. P., & Reue, K. (2017) · Cell Metabolism · doi:10.1016/j.cmet.2017.04.033 · Cited by 284
Self-citationXX sex chromosome complement promotes atherosclerosis in mice
Alsiraj, Y., Chen, X., Thatcher, S. E., Temel, R. E., Cai, L., Blalock, E. M., Katz, W. S., Ali, H., Petriello, M. C., Deng, P., et al. (2019) · Nature Communications · doi:10.1038/s41467-019-10462-z · Cited by 268
Self-citationSex differences in obesity, lipid metabolism, and inflammation—A role for the sex chromosomes?
Zore, T., Palafox, M., & Reue, K. (2018) · Molecular Metabolism · doi:10.1016/j.molmet.2018.04.003 · Cited by 239
Self-citationGenetic Architecture of Insulin Resistance in the Mouse
Parks, B. W., Sallam, T., Mehrabian, M., Psychogios, N., Hui, S. T., Norheim, F., Castellani, L. W., Rau, C. D., Pan, C., Phun, J., et al. (2015) · Cell Metabolism · doi:10.1016/j.cmet.2015.01.002 · Cited by 249
Self-citationSex and gender differences in control of blood pressure
Maranon, R. O., & Reckelhoff, J. F. (2013) · Clinical Science · doi:10.1042/cs20130140 · Cited by 267
The regulation of adipose tissue health by estrogens
Steiner, B. M., & Berry, D. C. (2022) · Frontiers in Endocrinology · doi:10.3389/fendo.2022.889923 · Cited by 171
Sex Differences in Intestinal Carbohydrate Metabolism Promote Food Intake and Sperm Maturation
Hudry, B., de Goeij, E., Mineo, A., Gaspar, P., Hadjieconomou, D., Studd, C., Mokochinski, J. B., Kramer, H., Plaçais, P.-Y., Préat, T., et al. (2019) · Cell · doi:10.1016/j.cell.2019.07.029 · Cited by 164
Fried, S. K., Lee, M., & Karastergiou, K. (2015) · Obesity · doi:10.1002/oby.21133 · Cited by 167
Sex differences in adipose tissue
Fuente-Martín, E., Argente-Arizón, P., Ros, P., Argente, J., & Chowen, J. A. (2013) · Adipocyte · doi:10.4161/adip.24075 · Cited by 172
Muscogiuri, G., Verde, L., Vetrani, C., Barrea, L., Savastano, S., & Colao, A. (2023) · Journal of Endocrinological Investigation · doi:10.1007/s40618-023-02196-z · Cited by 164
Adipose Tissue Inflammation and Cardiovascular Disease: An Update
Rana, M. N., & Neeland, I. J. (2022) · Current Diabetes Reports · doi:10.1007/s11892-021-01446-9 · Cited by 177
Sex differences in energy metabolism: natural selection, mechanisms and consequences
Mauvais‐Jarvis, F. (2023) · Nature Reviews Nephrology · doi:10.1038/s41581-023-00781-2 · Cited by 174
Burgoyne, P. S., & Arnold, A. P. (2016) · Biology of Sex Differences · doi:10.1186/s13293-016-0115-5 · Cited by 154
Self-citationSex matters: The effects of biological sex on adipose tissue biology and energy metabolism
Valencak, T. G., Osterrieder, A., & Schulz, T. J. (2017) · Redox Biology · doi:10.1016/j.redox.2017.04.012 · Cited by 156
Koceva, A., Herman, R., Janež, A., Rakuša, M., & Jensterle, M. (2024) · International Journal of Molecular Sciences · doi:10.3390/ijms25137342 · Cited by 186
Sex differences in metabolism and cardiometabolic disorders
Krishnan, K. C., Mehrabian, M., & Lusis, A. J. (2018) · Current Opinion in Lipidology · doi:10.1097/mol.0000000000000536 · Cited by 153
Sex differences in the brain: a whole body perspective
Vries, G. J. D., & Forger, N. G. (2015) · Biology of Sex Differences · doi:10.1186/s13293-015-0032-z · Cited by 149
Wat, L. W., Chao, C. F., Bartlett, R., Buchanan, J. L., Millington, J. W., Chih, H. J., Chowdhury, Z. S., Biswas, P., Huang, V., Shin, L. J., et al. (2020) · PLoS Biology · doi:10.1371/journal.pbio.3000595 · Cited by 136
Circadian disruption in the pathogenesis of metabolic syndrome
Maury, E., Hong, H. K., & Bass, J. (2014) · Diabetes & Metabolism · doi:10.1016/j.diabet.2013.12.005 · Cited by 132
The evolution of sex differences in disease
Morrow, E. H. (2015) · Biology of Sex Differences · doi:10.1186/s13293-015-0023-0 · Cited by 135
Four Core Genotypes and XY* mouse models: Update on impact on SABV research
Arnold, A. P. (2020) · Neuroscience & Biobehavioral Reviews · doi:10.1016/j.neubiorev.2020.09.021 · Cited by 130
Self-citationX and Y Chromosome Complement Influence Adiposity and Metabolism in Mice
Chen, X., McClusky, R., Itoh, Y., Reue, K., & Arnold, A. P. (2013) · Endocrinology · doi:10.1210/en.2012-2098 · Cited by 133
Self-citationSex hormones, aging and cardiometabolic syndrome
Faulkner, J., & de Chantemèle, E. J. B. (2019) · Biology of Sex Differences · doi:10.1186/s13293-019-0246-6 · Cited by 124
X chromosome dosage of histone demethylase KDM5C determines sex differences in adiposity
Link, J. C., Wiese, C. B., Chen, X., Avetisyan, R., Ronquillo, E., Ma, F., Guo, X., Yao, J., Allison, M., Chen, Y.-D. I., et al. (2020) · Journal of Clinical Investigation · doi:10.1172/jci140223 · Cited by 121
Self-citationMetabolic impact of sex chromosomes
Link, J. C., Chen, X., Arnold, A. P., & Reue, K. (2013) · Adipocyte · doi:10.4161/adip.23320 · Cited by 120
Self-citationIlluminating the Mechanisms Underlying Sex Differences in Cardiovascular Disease
Reue, K., & Wiese, C. B. (2022) · Circulation Research · doi:10.1161/circresaha.122.320259 · Cited by 126
Self-citationSex Differences in Genomic Drivers of Adipose Distribution and Related Cardiometabolic Disorders
Lumish, H. S., O'Reilly, M. E., & Reilly, M. P. (2019) · Arteriosclerosis Thrombosis and Vascular Biology · doi:10.1161/atvbaha.119.313154 · Cited by 129
Just how conserved is vertebrate sex determination?
Cutting, A. D., Chue, J., & Smith, C. A. (2013) · Developmental Dynamics · doi:10.1002/dvdy.23944 · Cited by 118
The importance of having two X chromosomes
Arnold, A. P., Reue, K., Eghbali, M., Vilain, E., Chen, X., Ghahramani, N., Itoh, Y., Li, J., Link, J. C., Ngun, T., et al. (2016) · Philosophical Transactions of the Royal Society B: Biological Sciences · doi:10.1098/rstb.2015.0113 · Cited by 114
Self-citationSex Chromosome Effects on Male–Female Differences in Mammals
Snell, D. M., & Turner, J. M. A. (2018) · Current Biology · doi:10.1016/j.cub.2018.09.018 · Cited by 114
Gene-by-Sex Interactions in Mitochondrial Functions and Cardio-Metabolic Traits
Norheim, F., Hasin-Brumshtein, Y., Vergnes, L., Krishnan, K. C., Pan, C., Seldin, M. M., Hui, S. T. Y., Mehrabian, M., Zhou, Z., Gupta, S., et al. (2019) · Cell Metabolism · doi:10.1016/j.cmet.2018.12.013 · Cited by 110
Self-citationA Guide to Applying the Sex-Gender Perspective to Nutritional Genomics
Corella, D., Coltell, Ó., Portolés, O., Sotos‐Prieto, M., Fernández-Carrión, R., Sabio, J. B. R., Zanón‐Moreno, V., Mattei, J., Sorlí, J. V., & Ordovás, J. M. (2018) · Nutrients · doi:10.3390/nu11010004 · Cited by 113
Itoh, Y., Mackie, R., Kampf, K., Domadia, S., Brown, J. D., O’Neill, R., & Arnold, A. P. (2015) · BMC Research Notes · doi:10.1186/s13104-015-0986-2 · Cited by 109
Self-citationLi, J., Chen, X., McClusky, R., Ruiz-Sundstrom, M., Itoh, Y., Umar, S., Arnold, A. P., & Eghbali, M. (2014) · Cardiovascular Research · doi:10.1093/cvr/cvu064 · Cited by 106
Self-citationThe hypothalamus for whole-body physiology: from metabolism to aging
Liu, T., Xu, Y., Yi, C., Tong, Q., & Cai, D. (2021) · Protein & Cell · doi:10.1007/s13238-021-00834-x · Cited by 109
Shobeiri, P., Kalantari, A., Teixeira, A. L., & Rezaei, N. (2022) · Biology of Sex Differences · doi:10.1186/s13293-022-00422-6 · Cited by 113
Sex‐specific aging in animals: Perspective and future directions
Bronikowski, A. M., Meisel, R. P., Biga, P. R., Walters, J. R., Mank, J. E., Larschan, E., Wilkinson, G. S., Valenzuela, N., Conard, A. M., de Magalhães, J. P., et al. (2022) · Aging Cell · doi:10.1111/acel.13542 · Cited by 105
Corre, C., Friedel, M., Vousden, D. A., Metcalf, A., Spring, S., Qiu, L. R., Lerch, J. P., & Palmert, M. R. (2016) · Brain Structure and Function · doi:10.1007/s00429-014-0952-0 · Cited by 98
Increased High-Density Lipoprotein Cholesterol Levels in Mice With XX Versus XY Sex Chromosomes
Link, J. C., Chen, X., Prien, C., Borja, M. S., Hammerson, B., Oda, M. N., Arnold, A. P., & Reue, K. (2015) · Arteriosclerosis Thrombosis and Vascular Biology · doi:10.1161/atvbaha.115.305460 · Cited by 97
Self-citationLarge-Scale Transcriptomics Studies Provide Insight Into Sex Differences in Depression
Seney, M. L., Glausier, J. R., & Sibille, E. L. (2021) · Biological Psychiatry · doi:10.1016/j.biopsych.2020.12.025 · Cited by 100
Wankhade, U. D., Zhong, Y., Kang, P., Alfaro, M., Chintapalli, S. V., Piccolo, B. D., Mercer, K. E., Andres, A., Thakali, K. M., & Shankar, K. (2018) · Scientific Reports · doi:10.1038/s41598-018-34453-0 · Cited by 100
Preguiça, I., Alves, A., Nunes, S., Fernandes, R., Gomes, P., Viana, S., & Reis, F. (2020) · Obesity Reviews · doi:10.1111/obr.13081 · Cited by 123
Sex Differences in Brown Adipose Tissue Function: Sex Hormones, Glucocorticoids, and Their Crosstalk
Kaikaew, K., Grefhorst, A., & Visser, J. A. (2021) · Frontiers in Endocrinology · doi:10.3389/fendo.2021.652444 · Cited by 103
Arnold, A. P. (2014) · Experimental Neurology · doi:10.1016/j.expneurol.2014.01.021 · Cited by 94
Self-citationSex-specific regulation of immune responses by PPARs
Park, H.-J., & Choi, J. (2017) · Experimental & Molecular Medicine · doi:10.1038/emm.2017.102 · Cited by 88
Czaja-Stolc, S., Potrykus, M., Stankiewicz, M., Kaska, Ł., & Małgorzewicz, S. (2022) · Nutrients · doi:10.3390/nu14071457 · Cited by 88
TAp63 contributes to sexual dimorphism in POMC neuron functions and energy homeostasis
Wang, C., He, Y., Xu, P., Yang, Y., Saito, K., Xia, Y., Yan, X., Hinton, A. O., Jr., Yan, C., Ding, H., et al. (2018) · Nature Communications · doi:10.1038/s41467-018-03796-7 · Cited by 83
Mechanisms for sex differences in energy homeostasis
Wang, C., & Xu, Y. (2018) · Journal of Molecular Endocrinology · doi:10.1530/jme-18-0165 · Cited by 81
The role of estrogens in the adipose tissue milieu
Bracht, J. R., Vieira‐Potter, V. J., De Souza Santos, R., Öz, O. K., Palmer, B. F., & Clegg, D. J. (2020) · Annals of the New York Academy of Sciences · doi:10.1111/nyas.14281 · Cited by 80
Perirenal Adipose Tissue—Current Knowledge and Future Opportunities
Grigoraş, A., Balan, R. A., Căruntu, I.-D., Giuşcă, S. E., Lozneanu, L., Avădănei, E. R., Rusu, A., Riscanu, L., & Amălinei, C. (2021) · Journal of Clinical Medicine · doi:10.3390/jcm10061291 · Cited by 79
Sexual differentiation of brain and other tissues: Five questions for the next 50 years
Arnold, A. P. (2020) · Hormones and Behavior · doi:10.1016/j.yhbeh.2020.104691 · Cited by 75
Self-citationSex differences in stroke co-morbidities
Branyan, T. E., & Sohrabji, F. (2020) · Experimental Neurology · doi:10.1016/j.expneurol.2020.113384 · Cited by 76
Brettle, H., Tran, V., Drummond, G. R., Franks, A. E., Petrovski, S., Vinh, A., & Jelinic, M. (2022) · Frontiers in Immunology · doi:10.3389/fimmu.2022.971048 · Cited by 81
Gender Differences in Nonalcoholic Fatty Liver Disease
Mahtab, M. A., Ghosh, J., Bhatia, S. J., Nagral, A. S., Bangar, M., Menezes, S. B., Butt, N., Manchanayake, J., & Singh, S. P. (2022) · Euroasian Journal of Hepato-Gastroenterology · doi:10.5005/jp-journals-10018-1370 · Cited by 74
Sex Differences in Adipose Tissue CD8+ T Cells and Regulatory T Cells in Middle-Aged Mice
Ahnstedt, H. W., Roy-O’Reilly, M. A., Spychala, M. S., Mobley, A. S., Bravo-Alegria, J. B., Chauhan, A., Aronowski, J. A., Marrelli, S. P., & McCullough, L. D. (2018) · Frontiers in Immunology · doi:10.3389/fimmu.2018.00659 · Cited by 73
Genetic Mechanisms Leading to Sex Differences Across Common Diseases and Anthropometric Traits
Traglia, M., Bseiso, D. N. F., Gusev, A., Adviento, B., Park, D., Mefford, J., Zaitlen, N., & Weiss, L. A. (2016) · Genetics · doi:10.1534/genetics.116.193623 · Cited by 72
Abbott, A. D., Colman, R. J., Tiefenthaler, R., Dumesic, D. A., & Abbott, D. H. (2012) · PLoS ONE · doi:10.1371/journal.pone.0042372 · Cited by 72
Cell‐autonomous sex determination outside of the gonad
Arnold, A. P., Chen, X., Link, J. C., Itoh, Y., & Reue, K. (2013) · Developmental Dynamics · doi:10.1002/dvdy.23936 · Cited by 70
Self-citationReue, K. (2017) · Physiology & Behavior · doi:10.1016/j.physbeh.2017.02.040 · Cited by 69
Self-citationMouse model systems to study sex chromosome genes and behavior: Relevance to humans
Cox, K. H., Bonthuis, P. J., & Rissman, E. F. (2014) · Frontiers in Neuroendocrinology · doi:10.1016/j.yfrne.2013.12.004 · Cited by 60
Chromosome Imbalance as a Driver of Sex Disparity in Disease
Abramowitz, L. K., Stichelen, S. O.-V., & Hanover, J. A. (2014) · Journal of Genomics · doi:10.7150/jgen.8123 · Cited by 64
Chen, X., Wang, L., Loh, D. H., Colwell, C. S., Taché, Y., Reue, K., & Arnold, A. P. (2015) · Hormones and Behavior · doi:10.1016/j.yhbeh.2015.07.020 · Cited by 64
Self-citationWomen have more potential to induce browning of perirenal adipose tissue than men
van den Beukel, J. C., Grefhorst, A., Hoogduijn, M. J., Steenbergen, J., Mastroberardino, P. G., Dor, F. J. M. F., & Themmen, A. P. N. (2015) · Obesity · doi:10.1002/oby.21166 · Cited by 59
X chromosome agents of sexual differentiation
Arnold, A. P. (2022) · Nature Reviews Endocrinology · doi:10.1038/s41574-022-00697-0 · Cited by 59
Self-citationBlencowe, M., Chen, X., Zhao, Y., Itoh, Y., McQuillen, C. N., Han, Y., Shou, B. L., McClusky, R., Reue, K., Arnold, A. P., et al. (2022) · Genome Research · doi:10.1101/gr.275965.121 · Cited by 65
Self-citationZhu, J., Zhou, Y., Jin, B., & Shu, J. (2023) · Therapeutic Advances in Endocrinology and Metabolism · doi:10.1177/20420188231199359 · Cited by 72
Sex chromosome complement regulates expression of mood-related genes
Seney, M. L., Ekong, K. I., Ding, Y., Tseng, G. C., & Sibille, E. L. (2013) · Biology of Sex Differences · doi:10.1186/2042-6410-4-20 · Cited by 62
The sex of specific neurons controls female body growth in Drosophila
Sawala, A., & Gould, A. P. (2017) · PLoS Biology · doi:10.1371/journal.pbio.2002252 · Cited by 59
Rethinking sex determination of non-gonadal tissues
Arnold, A. P. (2019) · Current topics in developmental biology/Current Topics in Developmental Biology · doi:10.1016/bs.ctdb.2019.01.003 · Cited by 59
Self-citationSex and Gender Differences in Obesity: Biological, Sociocultural, and Clinical Perspectives
Kim, H., Kim, S., & Sung, M. (2025) · The World Journal of Men s Health · doi:10.5534/wjmh.250126 · Cited by 79
Sex as a Biological Variable in Nutrition Research: From Human Studies to Animal Models
Chen, Y., Kim, M., Paye, S. M., & Benayoun, B. A. (2022) · Annual Review of Nutrition · doi:10.1146/annurev-nutr-062220-105852 · Cited by 59
Prenatal Exposure to Bisphenol A Disrupts Mouse Fetal Liver Maturation in a Sex-Specific Manner
DeBenedictis, B., Guan, H., & Yang, K. (2015) · Journal of Cellular Biochemistry · doi:10.1002/jcb.25276 · Cited by 55
Sex differences in the effects of androgens acting in the central nervous system on metabolism
Morford, J. J., & Mauvais‐Jarvis, F. (2016) · Dialogues in Clinical Neuroscience · doi:10.31887/dcns.2016.18.4/fmauvais · Cited by 53
Deconstructing sex: Strategies for undoing binary thinking in neuroendocrinology and behavior
Massa, M. G., Aghi, K., & Hill, M. (2023) · Hormones and Behavior · doi:10.1016/j.yhbeh.2023.105441 · Cited by 53
Diet, gonadal sex, and sex chromosome complement influence white adipose tissue miRNA expression
Link, J. C., Hasin-Brumshtein, Y., Cantor, R. M., Chen, X., Arnold, A. P., Lusis, A. J., & Reue, K. (2017) · BMC Genomics · doi:10.1186/s12864-017-3484-1 · Cited by 52
Self-citationImmunometabolic Links between Estrogen, Adipose Tissue and Female Reproductive Metabolism
Eaton, S. A., & Sethi, J. K. (2019) · Biology · doi:10.3390/biology8010008 · Cited by 53
The genetics of pubertal timing in the general population
Cousminer, D. L., Widén, E., & Palmert, M. R. (2015) · Current Opinion in Endocrinology Diabetes and Obesity · doi:10.1097/med.0000000000000213 · Cited by 50
XX > XY?: The changing female advantage in life expectancy
Goldin, C. D., & Lleras‐Muney, A. (2019) · Journal of Health Economics · doi:10.1016/j.jhealeco.2019.102224 · Cited by 51
Role of the endothelin system in sexual dimorphism in cardiovascular and renal diseases
Gohar, E. Y., Giachini, F. R. C., Pollock, D. M., & Tostes, R. C. (2016) · Life Sciences · doi:10.1016/j.lfs.2016.02.093 · Cited by 48
Brennan, L., & Gibbons, H. (2019) · Proceedings of The Nutrition Society · doi:10.1017/s002966511900106x · Cited by 50
Sex hormones, the anticancer immune response, and therapeutic opportunities
Conforti, F., Pala, L., Mitri, D. D., Catania, C., Cocorocchio, E., Laszlo, D., Ceresoli, G. L., Locatelli, M., Facella, F., Pas, T. M. D., et al. (2025) · Cancer Cell · doi:10.1016/j.ccell.2025.02.013 · Cited by 48
Metadata
- Authors
- Chen, X., McClusky, R., Chen, J., Beaven, S. W., Tontonoz, P., Arnold, A. P., & Reue, K.
- Affiliations
- University of California, Los Angeles (US)
- Howard Hughes Medical Institute (US)
- Corresponding author
- Reue, Karen
- Venue
- PLoS Genetics
- Publisher
- Public Library of Science (PLoS)
- Published
- 2012-05-10
- Volume
- 8
- Issue
- 5
- Pages
- e1002709
- ISSN
- 1553-7390 (ISSN-L)
- 1553-7404
- PMC
- PMC3349739
- OpenAlex
- W1978661176
- Cited by
- 326
- References
- 68
- Citations by year
- 2026: 16 · 2025: 21 · 2024: 34 · 2023: 22 · 2022: 42 · 2021: 29 · 2020: 19 · 2019: 25 · 2018: 27 · 2017: 21 · 2016: 14 · 2015: 18 · 2014: 20 · 2013: 17 · 2012: 1
- FWCI
- 10.76
- Type
- journal article
- Language
- en
- Open access
- gold
- doi.org
- Locations
- PLoS Genetics (publishedVersion, cc-by)
- PubMed Central (publishedVersion, cc-by)
- PubMed (publishedVersion)
- DOAJ (DOAJ: Directory of Open Access Journals) (submittedVersion, cc-by-sa)
- eScholarship (California Digital Library) (submittedVersion)
- eScholarship (California Digital Library) (submittedVersion, cc-by)
- Figshare (submittedVersion, cc-by)
- Funders
- Howard Hughes Medical Institute
- National Heart, Lung, and Blood Institute (P01HL090553, P01 HL90553)
- National Institute of General Medical Sciences (GM 007185, T32GM007185)
- National Institute of Diabetes and Digestive and Kidney Diseases (R01 DK83561, R01DK083561)
- National Institute of Neurological Disorders and Stroke (R01NS043196)
- Topics
- Life Sciences › Biochemistry, Genetics and Molecular Biology › Genetics › Genetic and Clinical Aspects of Sex Determination and Chromosomal Abnormalities
- Life Sciences › Neuroscience › Endocrine and Autonomic Systems › Regulation of Appetite and Obesity
- Health Sciences › Medicine › Endocrinology, Diabetes and Metabolism › Sexual Differentiation and Disorders
- Keywords
- sex differences in obesity, X chromosome dosage, sex chromosome complement, adiposity, gonadal hormones, gonadectomy, X chromosome inactivation escape, high-fat diet, hepatic steatosis, insulin, lipid metabolism, dietary intake, adipose tissue, liver
- MeSH terms
- Animals, Female, Gonads, Insulin, Lipids, Male, Obesity, Sex Characteristics, X Chromosome, Y Chromosome, Weight Gain, Sex Determination Processes, Gonadal Hormones, Adiposity, Lipid Metabolism, Mice, Diet, High-Fat
About these checks
Registry, retraction, Cites and statistics results are computed, not judged, with one exception: a printed reference that no index lists is read once by a model before it counts as a citation error. Claims are extracted by a model and kept only when their quote appears verbatim in the text; each cited source is then checked, with a model’s help, for whether it says what the claim relies on. Those verdicts can be wrong — read the claim’s quote and the cited source before relying on one.
Statistics and arithmetic are recomputed, not judged.
Confidence bands are shown only for fields calibrated on our annotated test set. None is calibrated yet, so no band is shown.
What counts as a claim ›How we measure confidence ›How we check this ›
Are you an author, or do you see a problem with this page? Request a review
