

The DOI matches its Crossref record; 54 of the 55 references it cites were found in a registry or an index; 3 of the 39 sources its claims cite were checked for support.
Genetic Architecture of Skin and Eye Color in an African-European Admixed Population
Open accessAbstract
Variation in human skin and eye color is substantial and especially apparent in admixed populations, yet the underlying genetic architecture is poorly understood because most genome-wide studies are based on individuals of European ancestry. We study pigmentary variation in 699 individuals from Cape Verde, where extensive West African/European admixture has given rise to a broad range in trait values and genomic ancestry proportions. We develop and apply a new approach for measuring eye color, and identify two major loci (HERC2[OCA2] P = 2.3 × 10(-62), SLC24A5 P = 9.6 × 10(-9)) that account for both blue versus brown eye color and varying intensities of brown eye color. We identify four major loci (SLC24A5 P = 5.4 × 10(-27), TYR P = 1.1 × 10(-9), APBA2[OCA2] P = 1.5 × 10(-8), SLC45A2 P = 6 × 10(-9)) for skin color that together account for 35% of the total variance, but the genetic component with the largest effect (~44%) is average genomic ancestry. Our results suggest that adjacent cis-acting regulatory loci for OCA2 explain the relationship between skin and eye color, and point to an underlying genetic architecture in which several genes of moderate effect act together with many genes of small effect to explain ~70% of the estimated heritability.
Overview
AI snapshot
Written from the paper’s full text.
TL;DR
This study maps skin and eye color in 699 Cape Verdeans, an African-European admixed population, using genotype- and ancestry-based association approaches. It finds distinct genetic architectures: a few major loci plus average genomic ancestry explain much of skin color variation, while eye color is dominated by HERC2[OCA2] with a secondary SLC24A5 signal.
Key findings
- Two major eye-color loci were identified: HERC2[OCA2] rs12913832 (P = 2.3×10−62) and SLC24A5 (P = 9.6×10⁻⁹ in the abstract; Table 1 reports rs2470102 genotype P = 4.8×10⁻¹⁰), affecting both blue versus brown eyes and shades of brown.
- Four major skin-color loci were identified: SLC24A5 (P = 5.4×10⁻²⁷), TYR/GRM5 (P = 1.1×10⁻⁹), APBA2[OCA2] (P = 1.5×10⁻⁸), and SLC45A2 (P = 6×10⁻⁹); together they account for 35% of total skin-color variance, while average genomic ancestry accounts for ∼44%.
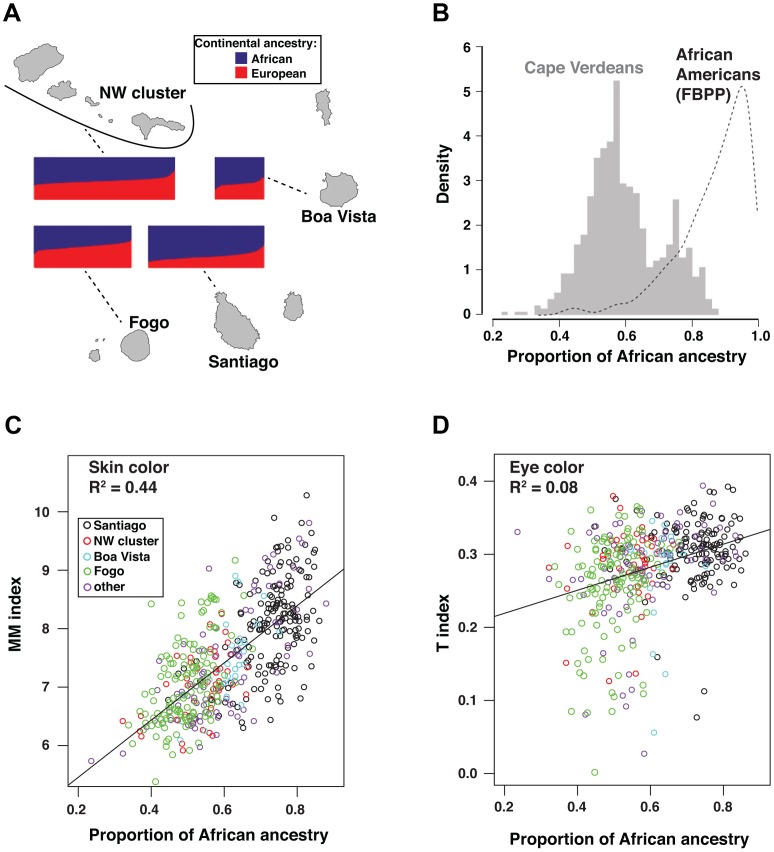
- Skin and eye color have different architectures: skin color correlates with African genomic ancestry at R² = 0.44, whereas eye color correlates weakly with ancestry (R² = 0.08) and with skin color (R² = 0.14).
- At 15q13.1, the eye-color signal in HERC2[OCA2] and the skin-color signal in APBA2[OCA2] are genetically separable, with weak linkage disequilibrium between peaks (R² = 0.112), suggesting adjacent cis-regulatory effects on OCA2.
Methods
- Studied 699 Cape Verdeans from six islands; final analyses used 685 individuals with skin reflectance and 625 with high-quality eye photographs. Genotyping used Illumina 1M, yielding 903,837 autosomal SNPs after QC.
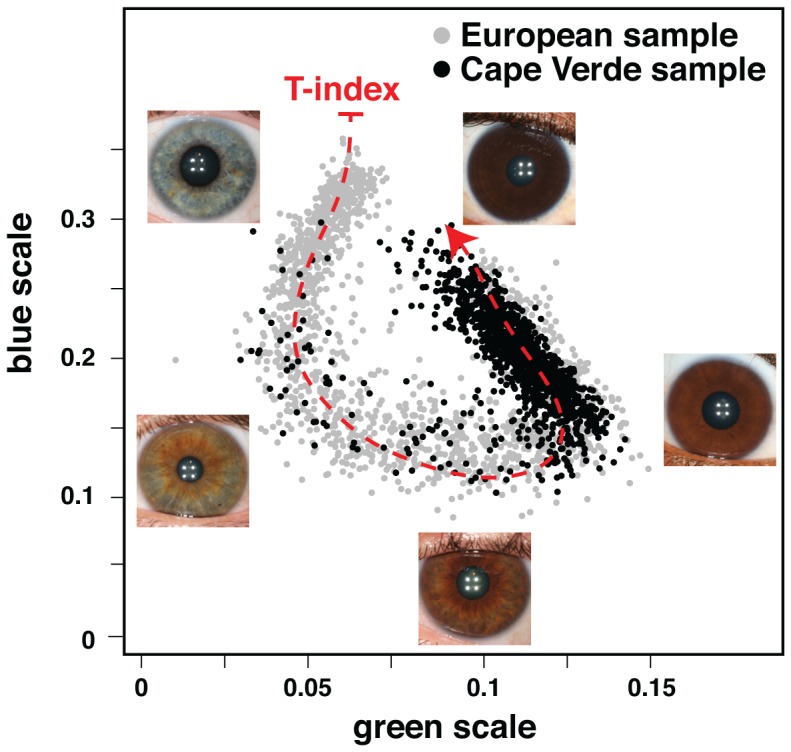
- Skin color was measured as a modified melanin (MM) index by reflectance spectroscopy on the upper inner arm; eye color was measured as a new quantitative “T index” derived from digital photographs and a principal curve.
- Association analyses used additive linear regression adjusted for sex and first three principal components, plus ancestry-based mapping with SABER+, EMMAX mixed models, imputation with MaCH, CMS selection scores, and power simulations.
Limitations
- The paper states that CEU and YRI are imperfect proxies for the true ancestral populations of Cape Verde, which likely include multiple Southern European and West African groups, and cautions that “European” and “African” should not imply homogeneity.
- The authors note that GCTA-style heritability estimation was not used because the genetic relationship matrix is inflated by population structure and pilot studies showed large sampling variability in this moderate-sized sample.
- The paper states that failure to replicate some previously reported loci (e.g., ASIP, KITLG, MC1R) could reflect limited ancestral allelic variation, incomplete ancestry correction in earlier studies, or effects too small to detect; the APBA2[OCA2] regulatory mechanism remains a hypothesis requiring functional validation.
Model-written summary. Check it against the paper before relying on it.
Integrity signals
Registry
Cites
Statistics
Figures
Verification
Claims the paper makes
56 Own result · 33 Not checked yet · 30 Own interpretation · 18 Own method · 9 No basis given · 1 Partly supported · accuracy not yet measured
The cited sources support only part of this claim — read each source’s verdict below.
In the paper
“This eye color locus was later refined to a small region 50 kb upstream of OCA2 in an intron of the HERC2 gene [7], [8], [10].”
§ Genetic Architecture of Skin and Eye Color in an African-European Admixed Population > Discussion
What the sources say
- Partly supportedcites [7] M Kayser, 2008, Three genome-wide association studies and a linkage analysis identify HERC2 as a human iris color gene, Am J Hum Genet sourceExperimental — accuracy not yet measured
The Discussion identifies an iris-color-associated variant in intron 12 of HERC2, supporting the HERC2 location. But it places that variant 169 kb upstream of OCA2, not 50 kb, and does not describe refinement to a small 50-kb region. The indexed copy provides no page number for this passage. (LLM, conf=0.88)
- Partly supportedcites [8] Liu F, Wollstein A, Hysi PG, Ankra-Badu GA, Spector TD, et al.. (2010) Digital quantification of human eye color highlights genetic association of three new loci. <comment>doi:10.1371/journal.pgen.1000934</comment> sourceExperimental — accuracy not yet measured
The Results (Genome-wide association studies; page unavailable) identify a strong eye-color association at HERC2/OCA2 and a particularly strong effect for a HERC2 SNP. Our copy does not state that the locus was refined to a small region 50 kb upstream of OCA2 or locate that region within a HERC2 intron. (LLM, conf=0.83)
- Partly supportedcites [10] RA Sturm, 2008, A single SNP in an evolutionary conserved region within intron 86 of the HERC2 gene determines human blue-brown eye color, Am J Hum Genet sourceExperimental — accuracy not yet measured
The Introduction describes fine mapping of the eye-color locus to a conserved region in HERC2 intron 86. The section on the adolescent twin collection places the associated SNP 21.1 kb upstream of OCA2’s first exon, not 50 kb upstream; that distance is not supported by this source. (LLM, conf=0.88)
plain- Asserted: passes — The authors put it forward as true.
- Checkable: passes — It can be checked against evidence.
- Load-bearing: unclear — It is unclear whether the paper’s conclusions depend on it.
- Based: passes — The paper gives a reason why it holds.
- Partly supported
A result the paper reports from its own data — it cites no other source for it, so there is none to check. The quote shows it is in the paper.
In the paper
“No additional loci were found in conditional analyses that adjust for the most significant SNPs in the known loci (four for skin and two for eye color).”
§ Genetic Architecture of Skin and Eye Color in an African-European Admixed Population > Results > Mapping loci associated with skin and eye color
plain- Asserted: passes — The authors put it forward as true.
- Checkable: passes — It can be checked against evidence.
- Load-bearing: passes — The paper’s conclusions depend on it.
- Based: passes — The paper gives a reason why it holds.
A result the paper reports from its own data — it cites no other source for it, so there is none to check. The quote shows it is in the paper.
In the paper
“For skin color, we used reflectance spectroscopy on the upper inner arm to calculate a modified melanin (MM) index, which appears normally distributed with a mean of 7.39 and standard deviation of 0.85 for the Cape Verde cohort.”
§ Genetic Architecture of Skin and Eye Color in an African-European Admixed Population > Results > Quantitative assessment of pigmentary phenotypes
hedged- Asserted: passes — The authors put it forward as true.
- Checkable: passes — It can be checked against evidence.
- Load-bearing: unclear — It is unclear whether the paper’s conclusions depend on it.
- Based: passes — The paper gives a reason why it holds.
A result the paper reports from its own data — it cites no other source for it, so there is none to check. The quote shows it is in the paper.
In the paper
“We observed that RGB reflectance values project onto an empirical curve that begins and ends, respectively, with very light blue, and very dark brown eyes”
§ Genetic Architecture of Skin and Eye Color in an African-European Admixed Population > Results > Quantitative assessment of pigmentary phenotypes
plaincorrelational- Asserted: passes — The authors put it forward as true.
- Checkable: passes — It can be checked against evidence.
- Load-bearing: passes — The paper’s conclusions depend on it.
- Based: passes — The paper gives a reason why it holds.
A result the paper reports from its own data — it cites no other source for it, so there is none to check. The quote shows it is in the paper.
In the paper
“the 15q13.1 association signal for eye color, which lies ∼50 kb upstream of OCA2 in an intronic region of HERC2”
§ Genetic Architecture of Skin and Eye Color in an African-European Admixed Population > Results > Refinement of pigmentation loci by imputation and conditional analysis
plain- Asserted: passes — The authors put it forward as true.
- Checkable: passes — It can be checked against evidence.
- Load-bearing: unclear — It is unclear whether the paper’s conclusions depend on it.
- Based: passes — The paper gives a reason why it holds.
A result the paper reports from its own data — it cites no other source for it, so there is none to check. The quote shows it is in the paper.
In the paper
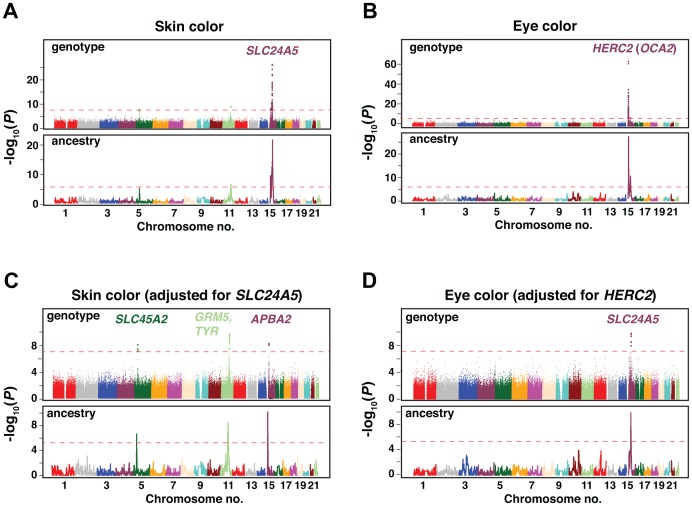
“In analyses adjusted only for principal components and sex, the signals at 15q21.1 (for skin color, Figure 3a) and 15q13.1 (for eye color, Figure 3b), dominate the significance plots.”
§ Genetic Architecture of Skin and Eye Color in an African-European Admixed Population > Results > Mapping loci associated with skin and eye color
plaincorrelationaln = 685- Asserted: passes — The authors put it forward as true.
- Checkable: passes — It can be checked against evidence.
- Load-bearing: passes — The paper’s conclusions depend on it.
- Based: passes — The paper gives a reason why it holds.
A result the paper reports from its own data — it cites no other source for it, so there is none to check. The quote shows it is in the paper.
In the paper
“there is only a weak correlation between skin and eye color in Cape Verdeans (R∧2 = 0.14)”
§ Genetic Architecture of Skin and Eye Color in an African-European Admixed Population > Results > Quantitative assessment of pigmentary phenotypes
plaincorrelational- Asserted: passes — The authors put it forward as true.
- Checkable: passes — It can be checked against evidence.
- Load-bearing: passes — The paper’s conclusions depend on it.
- Based: passes — The paper gives a reason why it holds.
A result the paper reports from its own data — it cites no other source for it, so there is none to check. The quote shows it is in the paper.
In the paper
“The correlation between skin color and African genomic ancestry (R∧2 = 0.44) is apparent both across and within (Table S1) islands clusters”
§ Genetic Architecture of Skin and Eye Color in an African-European Admixed Population > Results > Quantitative assessment of pigmentary phenotypes
plaincorrelational- Asserted: passes — The authors put it forward as true.
- Checkable: passes — It can be checked against evidence.
- Load-bearing: passes — The paper’s conclusions depend on it.
- Based: passes — The paper gives a reason why it holds.
- Rests on an assumption: HapMap CEU and YRI individuals adequately represent the European and African ancestral populations of Cape Verde.
The paper states this without a source or data behind it here, so there is nothing to check it against. The quote shows it is in the paper.
In the paper
“For example, in a model with 3 major skin color genes that act additively and equally, we predict an R∧2<0.3 between African genomic ancestry and skin color”
§ Genetic Architecture of Skin and Eye Color in an African-European Admixed Population > Results > Quantitative assessment of pigmentary phenotypes
plaincorrelational- Asserted: passes — The authors put it forward as true.
- Checkable: passes — It can be checked against evidence.
- Load-bearing: passes — The paper’s conclusions depend on it.
- Based: passes — The paper gives a reason why it holds.
A result the paper reports from its own data — it cites no other source for it, so there is none to check. The quote shows it is in the paper.
In the paper
“Overall, African genomic ancestry in Cape Verdeans ranges from 23.5% to 87.9%, with a median of 58%.”
§ Genetic Architecture of Skin and Eye Color in an African-European Admixed Population > Results > Genetic admixture in Cape Verdeans
plain- Asserted: passes — The authors put it forward as true.
- Checkable: passes — It can be checked against evidence.
- Load-bearing: passes — The paper’s conclusions depend on it.
- Based: passes — The paper gives a reason why it holds.
- Rests on an assumption: HapMap CEU and YRI individuals adequately represent the European and African ancestral populations of Cape Verde.
- It may state two separate claims as one. 58
- The quote only partly states this claim. 1
- Probably not a substantial claim. 23
A result the paper reports from its own data — it cites no other source for it, so there is none to check. The quote shows it is in the paper.
In the paper
“For genotype-based association, four skin color loci (5p13.3, 11q14.3, 15q13.1, and 15q21.1) and two eye color loci (15q13.1 and 15q21.1) met genome-wide criteria for significance, P<5.7×10⁻⁸”
§ Genetic Architecture of Skin and Eye Color in an African-European Admixed Population > Results > Mapping loci associated with skin and eye color
plaincorrelationaln = 685- Asserted: passes — The authors put it forward as true.
- Checkable: passes — It can be checked against evidence.
- Load-bearing: passes — The paper’s conclusions depend on it.
- Based: passes — The paper gives a reason why it holds.
It may state two separate claims as one.
A result the paper reports from its own data — it cites no other source for it, so there is none to check. The quote shows it is in the paper.
In the paper
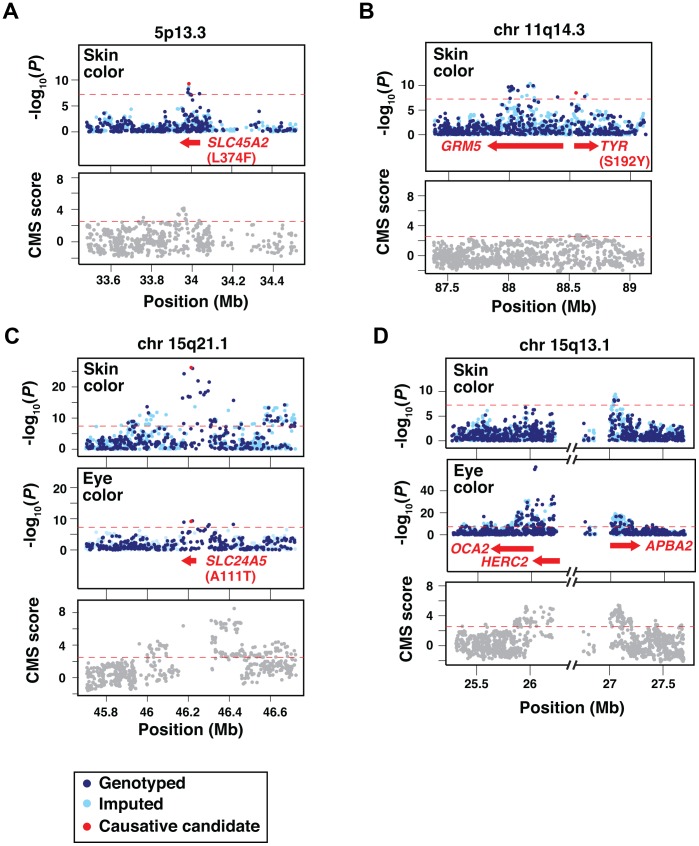
“the most strongly associated SNPs at 5p13.3 and 15q21.1 represent missense alterations in two well-known pigmentary genes, SLC45A2 L374F (Figure 4a) and SLC24A5 A111T (Figure 4c)”
§ Genetic Architecture of Skin and Eye Color in an African-European Admixed Population > Results > Refinement of pigmentation loci by imputation and conditional analysis
plaincorrelational- Asserted: passes — The authors put it forward as true.
- Checkable: passes — It can be checked against evidence.
- Load-bearing: passes — The paper’s conclusions depend on it.
- Based: passes — The paper gives a reason why it holds.
It may state two separate claims as one.
The paper states this without a source or data behind it here, so there is nothing to check it against. The quote shows it is in the paper.
In the paper
“GRM5 and APBA2 lie 396 kb upstream and 1025 kb upstream of TYR and OCA2, respectively”
§ Genetic Architecture of Skin and Eye Color in an African-European Admixed Population > Results > Refinement of pigmentation loci by imputation and conditional analysis
plain- Asserted: passes — The authors put it forward as true.
- Checkable: passes — It can be checked against evidence.
- Load-bearing: passes — The paper’s conclusions depend on it.
- Based: passes — The paper gives a reason why it holds.
It may state two separate claims as one.
In the paper
“in a randomly sampled African-American cohort from the Family Blood Pressure Study (FBPP) [21], African genomic ancestry ranges from 40.6% to 99.3%, with a median of 89.5%”
§ Genetic Architecture of Skin and Eye Color in an African-European Admixed Population > Results > Genetic admixture in Cape Verdeans
What the sources say
- Not checked yetcites [21] H Tang, 2006, Racial admixture and its impact on BMI and blood pressure in African and Mexican Americans, Hum Genet source
plain- Asserted: passes — The authors put it forward as true.
- Checkable: passes — It can be checked against evidence.
- Load-bearing: passes — The paper’s conclusions depend on it.
- Based: passes — The paper gives a reason why it holds.
The quote only partly states this claim.
- Rests on an assumption: HapMap CEU and YRI individuals adequately represent the European and African ancestral populations of Cape Verde.
A result the paper reports from its own data — it cites no other source for it, so there is none to check. The quote shows it is in the paper.
In the paper
“Across different islands, the distributions of African genomic ancestry exhibit substantial overlap in range but vary in their median values, from 50.5% in Fogo to 74.4% in the capital island of Santiago”
§ Genetic Architecture of Skin and Eye Color in an African-European Admixed Population > Results > Genetic admixture in Cape Verdeans
plaincorrelational- Asserted: passes — The authors put it forward as true.
- Checkable: passes — It can be checked against evidence.
- Load-bearing: unclear — It is unclear whether the paper’s conclusions depend on it.
- Based: passes — The paper gives a reason why it holds.
It may state two separate claims as one.
- Rests on an assumption: HapMap CEU and YRI individuals adequately represent the European and African ancestral populations of Cape Verde.
A result the paper reports from its own data — it cites no other source for it, so there is none to check. The quote shows it is in the paper.
In the paper
“The 5p13.3 and 11q14.3 regions affect only skin color (Figure 4a, 4b), whereas the chromosome 15 regions (15q13.1 and 15q21.1, Figure 4c, 4d) affect both skin and eye color.”
§ Genetic Architecture of Skin and Eye Color in an African-European Admixed Population > Results > Refinement of pigmentation loci by imputation and conditional analysis
plaindirect- Asserted: passes — The authors put it forward as true.
- Checkable: passes — It can be checked against evidence.
- Load-bearing: passes — The paper’s conclusions depend on it.
- Based: passes — The paper gives a reason why it holds.
It may state two separate claims as one.
A result the paper reports from its own data — it cites no other source for it, so there is none to check. The quote shows it is in the paper.
In the paper
“Ancestry-based association yields broader peaks than genotype-based association, but the distribution of significant regions is strikingly consistent for the two approaches, uncovering the identical set of six loci”
§ Genetic Architecture of Skin and Eye Color in an African-European Admixed Population > Results > Mapping loci associated with skin and eye color
plaincorrelational- Asserted: passes — The authors put it forward as true.
- Checkable: passes — It can be checked against evidence.
- Load-bearing: passes — The paper’s conclusions depend on it.
- Based: passes — The paper gives a reason why it holds.
It may state two separate claims as one.
- Rests on an assumption: HapMap CEU and YRI individuals adequately represent the European and African ancestral populations of Cape Verde.
A result the paper reports from its own data — it cites no other source for it, so there is none to check. The quote shows it is in the paper.
In the paper
“in analyses that consider TYR and GRM5 SNPs as covariates, both remain significant (P = 3.7×10⁻⁶ for rs10831496; P = 0.00012 for rs1042602).”
§ Genetic Architecture of Skin and Eye Color in an African-European Admixed Population > Results > Refinement of pigmentation loci by imputation and conditional analysis
plaincorrelational- Asserted: passes — The authors put it forward as true.
- Checkable: passes — It can be checked against evidence.
- Load-bearing: passes — The paper’s conclusions depend on it.
- Based: passes — The paper gives a reason why it holds.
It may state two separate claims as one.
A result the paper reports from its own data — it cites no other source for it, so there is none to check. The quote shows it is in the paper.
In the paper
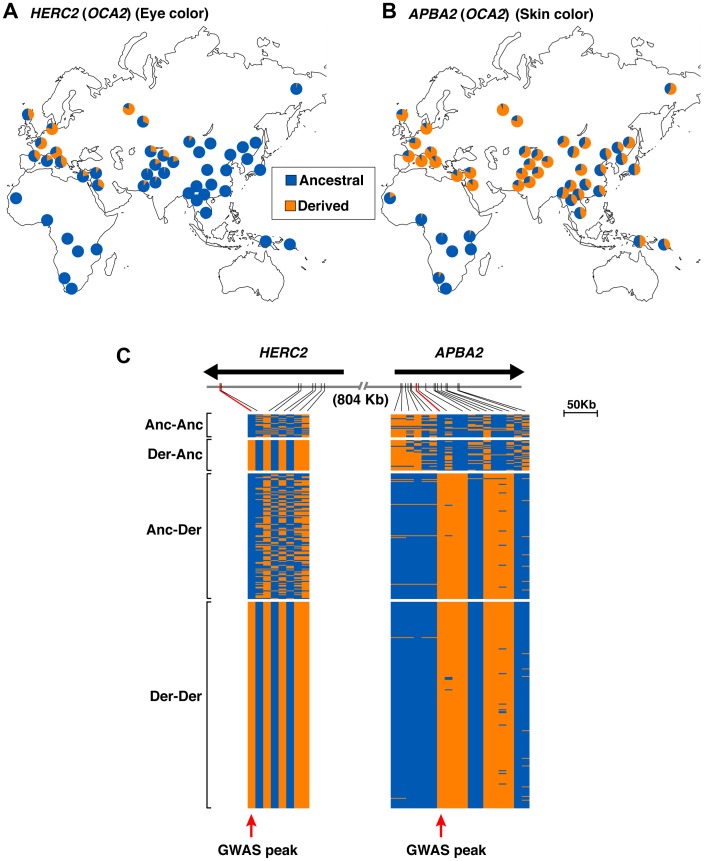
“Each derived allele is present on a single major extended haplotype (>160 kb in length for HERC2 (OCA2) and >90 kb in length for APBA2 [OCA2]), whereas the ancestral alleles are found on multiple, shorter, haplotypes.”
§ Genetic Architecture of Skin and Eye Color in an African-European Admixed Population > Results > Genetic and evolutionary relationships of eye and skin color genes at 15q13.1
plaincorrelational- Asserted: passes — The authors put it forward as true.
- Checkable: passes — It can be checked against evidence.
- Load-bearing: passes — The paper’s conclusions depend on it.
- Based: passes — The paper gives a reason why it holds.
It may state two separate claims as one.
A result the paper reports from its own data — it cites no other source for it, so there is none to check. The quote shows it is in the paper.
In the paper
“in conditional regression analyses where genotypes at both loci are included as covariates, HERC2 does not affect skin color if eye color is also included as a covariate (HERC2 P = 0.48, APBA2 P = 0.0009); conversely, APBA2 does not affect eye color if skin color is also included as a covariate (APBA2 P = 0.083, HERC2 P<2×10⁻¹⁶).”
§ Genetic Architecture of Skin and Eye Color in an African-European Admixed Population > Results > Refinement of pigmentation loci by imputation and conditional analysis
plain- Asserted: passes — The authors put it forward as true.
- Checkable: passes — It can be checked against evidence.
- Load-bearing: passes — The paper’s conclusions depend on it.
- Based: passes — The paper gives a reason why it holds.
It may state two separate claims as one.
A result the paper reports from its own data — it cites no other source for it, so there is none to check. The quote shows it is in the paper.
In the paper
“For eye color, the ancestral HERC2 (OCA2) allele is mostly dominant over the derived allele, consistent with the near recessive mode of inheritance of blue eye phenotype in Europeans”
§ Genetic Architecture of Skin and Eye Color in an African-European Admixed Population > Results > Genetic architecture of pigmentary variation in Cape Verde
plaindirect- Asserted: passes — The authors put it forward as true.
- Checkable: passes — It can be checked against evidence.
- Load-bearing: passes — The paper’s conclusions depend on it.
- Based: passes — The paper gives a reason why it holds.
It may state two separate claims as one.
A result the paper reports from its own data — it cites no other source for it, so there is none to check. The quote shows it is in the paper.
In the paper
“The four skin color loci we identified by association analysis act in an additive fashion: we found no evidence of dominance at any of the loci, nor evidence of opposite-sign epistasis between loci.”
§ Genetic Architecture of Skin and Eye Color in an African-European Admixed Population > Results > Genetic architecture of pigmentary variation in Cape Verde
plain- Asserted: passes — The authors put it forward as true.
- Checkable: passes — It can be checked against evidence.
- Load-bearing: passes — The paper’s conclusions depend on it.
- Based: passes — The paper gives a reason why it holds.
It may state two separate claims as one.
A result the paper reports from its own data — it cites no other source for it, so there is none to check. The quote shows it is in the paper.
In the paper
“The SLC45A2 and APBA2 (OCA2) GWAS signals coincide with sharp CMS signals (Figure 4a, 4d); broader CMS signals are also apparent at SLC24A5 and HERC2 (OCA2) (Figure 4c, 4d).”
§ Genetic Architecture of Skin and Eye Color in an African-European Admixed Population > Results > Selection for pigmentary loci
plaincorrelational- Asserted: passes — The authors put it forward as true.
- Checkable: passes — It can be checked against evidence.
- Load-bearing: passes — The paper’s conclusions depend on it.
- Based: passes — The paper gives a reason why it holds.
It may state two separate claims as one.
A result the paper reports from its own data — it cites no other source for it, so there is none to check. The quote shows it is in the paper.
In the paper
“The derived APBA2 (OCA2) allele is present at low frequencies in most populations of African ancestry, and at high frequencies in most populations of Asian and European ancestry.”
§ Genetic Architecture of Skin and Eye Color in an African-European Admixed Population > Results > Genetic and evolutionary relationships of eye and skin color genes at 15q13.1
plaincorrelational- Asserted: passes — The authors put it forward as true.
- Checkable: passes — It can be checked against evidence.
- Load-bearing: passes — The paper’s conclusions depend on it.
- Based: passes — The paper gives a reason why it holds.
It may state two separate claims as one.
- Rests on an assumption: HapMap CEU and YRI individuals adequately represent the European and African ancestral populations of Cape Verde.
A result the paper reports from its own data — it cites no other source for it, so there is none to check. The quote shows it is in the paper.
In the paper
“measures of linkage disequilibrium between the two loci are not significant (R∧2 = 0.036, D′ = 0.071 with Χ2 = 0.517), extended haplotypes for the derived alleles are separated by ∼800 kb”
§ Genetic Architecture of Skin and Eye Color in an African-European Admixed Population > Results > Genetic and evolutionary relationships of eye and skin color genes at 15q13.1
plain- Asserted: passes — The authors put it forward as true.
- Checkable: passes — It can be checked against evidence.
- Load-bearing: passes — The paper’s conclusions depend on it.
- Based: passes — The paper gives a reason why it holds.
It may state two separate claims as one.
A result the paper reports from its own data — it cites no other source for it, so there is none to check. The quote shows it is in the paper.
In the paper
“In the subset of 592 Cape Verdeans whose T-index >0.15 (Figure 1, Figure 2), both loci remain highly significant (HERC2 rs12913832, P = 5.23×10⁻¹⁶; and SLC24A5 rs2470102, P = 1.12×10⁻¹⁰)”
§ Genetic Architecture of Skin and Eye Color in an African-European Admixed Population > Results > Refinement of pigmentation loci by imputation and conditional analysis
plaincorrelational- Asserted: passes — The authors put it forward as true.
- Checkable: passes — It can be checked against evidence.
- Load-bearing: passes — The paper’s conclusions depend on it.
- Based: passes — The paper gives a reason why it holds.
It may state two separate claims as one.
A result the paper reports from its own data — it cites no other source for it, so there is none to check. The quote shows it is in the paper.
In the paper
“By contrast, the effects of SLC24A5 on eye color are semi-dominant, and no interaction was found between this gene and HERC2”
§ Genetic Architecture of Skin and Eye Color in an African-European Admixed Population > Results > Genetic architecture of pigmentary variation in Cape Verde
plain- Asserted: passes — The authors put it forward as true.
- Checkable: passes — It can be checked against evidence.
- Load-bearing: passes — The paper’s conclusions depend on it.
- Based: passes — The paper gives a reason why it holds.
It may state two separate claims as one.
A result the paper reports from its own data — it cites no other source for it, so there is none to check. The quote shows it is in the paper.
In the paper
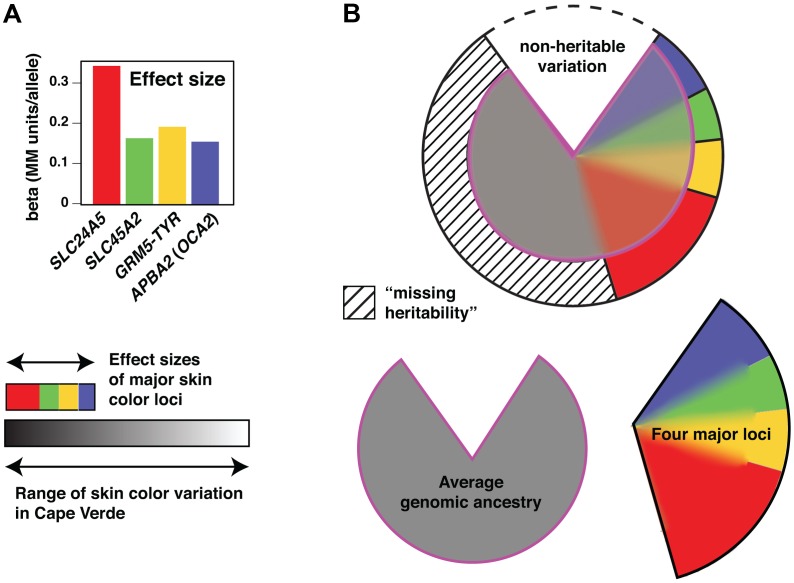
“the proportions of phenotypic variance attributed solely to genotype at each of the four major skin color loci are quite small, about 2% each for GRM5-TYR, APBA2 (OCA2), and SLC45A2, and about 7% for SLC24A5.”
§ Genetic Architecture of Skin and Eye Color in an African-European Admixed Population > Results > Genetic architecture of pigmentary variation in Cape Verde
plaincorrelational- Asserted: passes — The authors put it forward as true.
- Checkable: passes — It can be checked against evidence.
- Load-bearing: passes — The paper’s conclusions depend on it.
- Based: passes — The paper gives a reason why it holds.
It may state two separate claims as one.
A result the paper reports from its own data — it cites no other source for it, so there is none to check. The quote shows it is in the paper.
In the paper
“By contrast, the derived HERC2 (OCA2) allele is absent from African and East Asian populations, and appears at high frequency only in Western and Northern Europe”
§ Genetic Architecture of Skin and Eye Color in an African-European Admixed Population > Results > Genetic and evolutionary relationships of eye and skin color genes at 15q13.1
hedged- Asserted: passes — The authors put it forward as true.
- Checkable: passes — It can be checked against evidence.
- Load-bearing: passes — The paper’s conclusions depend on it.
- Based: passes — The paper gives a reason why it holds.
It may state two separate claims as one.
- Rests on an assumption: HapMap CEU and YRI individuals adequately represent the European and African ancestral populations of Cape Verde.
A result the paper reports from its own data — it cites no other source for it, so there is none to check. The quote shows it is in the paper.
In the paper
“even though individual ancestry contributes 44% to skin color variation, about half of that contribution (22% of the total) could also be accounted for by genotype at the four major loci.”
§ Genetic Architecture of Skin and Eye Color in an African-European Admixed Population > Results > Genetic architecture of pigmentary variation in Cape Verde
hedgedcorrelational- Asserted: passes — The authors put it forward as true.
- Checkable: passes — It can be checked against evidence.
- Load-bearing: passes — The paper’s conclusions depend on it.
- Based: passes — The paper gives a reason why it holds.
It may state two separate claims as one.
A result the paper reports from its own data — it cites no other source for it, so there is none to check. The quote shows it is in the paper.
In the paper
“the four major loci contribute a total of 35% to skin color variation, but only 13% above that which could also be accounted for by individual ancestry.”
§ Genetic Architecture of Skin and Eye Color in an African-European Admixed Population > Results > Genetic architecture of pigmentary variation in Cape Verde
plaincorrelational- Asserted: passes — The authors put it forward as true.
- Checkable: passes — It can be checked against evidence.
- Load-bearing: passes — The paper’s conclusions depend on it.
- Based: passes — The paper gives a reason why it holds.
It may state two separate claims as one.
A result the paper reports from its own data — it cites no other source for it, so there is none to check. The quote shows it is in the paper.
In the paper
“The GWAS significance peaks for eye color and skin color at 15q13.1 appear distinct (Figure 4d), and linkage disequilibrium between the two significance peaks is weak (R∧2 = 0.112 in our sample).”
§ Genetic Architecture of Skin and Eye Color in an African-European Admixed Population > Results > Refinement of pigmentation loci by imputation and conditional analysis
hedged- Asserted: passes — The authors put it forward as true.
- Checkable: passes — It can be checked against evidence.
- Load-bearing: passes — The paper’s conclusions depend on it.
- Based: passes — The paper gives a reason why it holds.
It may state two separate claims as one.
The paper states this without a source or data behind it here, so there is nothing to check it against. The quote shows it is in the paper.
In the paper
“even though SLC24A5 and SLC45A2 lie on different chromosomes, their genotypes in the Cape Verde population are correlated with genomic ancestry and, therefore, with each other.”
§ Genetic Architecture of Skin and Eye Color in an African-European Admixed Population > Results > Genetic architecture of pigmentary variation in Cape Verde
plaincorrelational- Asserted: passes — The authors put it forward as true.
- Checkable: passes — It can be checked against evidence.
- Load-bearing: passes — The paper’s conclusions depend on it.
- Based: passes — The paper gives a reason why it holds.
It may state two separate claims as one.
A result the paper reports from its own data — it cites no other source for it, so there is none to check. The quote shows it is in the paper.
In the paper
“The final dataset consists of 685 individuals with skin reflectance measurements, of which 625 have high-quality digital eye photographs.”
§ Genetic Architecture of Skin and Eye Color in an African-European Admixed Population > Materials and Methods > Study population and genotyping QC
plainn = 685- Asserted: passes — The authors put it forward as true.
- Checkable: passes — It can be checked against evidence.
- Load-bearing: passes — The paper’s conclusions depend on it.
- Based: passes — The paper gives a reason why it holds.
Probably not a substantial claim. It may state two separate claims as one.
The paper states this without a source or data behind it here, so there is nothing to check it against. The quote shows it is in the paper.
In the paper
“and has a haplotype set, linkage disequilibrium architecture, and signature of selection that is clearly distinct from the HERC2 (OCA2) eye color locus.”
§ Genetic Architecture of Skin and Eye Color in an African-European Admixed Population > Discussion
boosted- Asserted: passes — The authors put it forward as true.
- Checkable: passes — It can be checked against evidence.
- Load-bearing: passes — The paper’s conclusions depend on it.
- Based: passes — The paper gives a reason why it holds.
It may state two separate claims as one.
A result the paper reports from its own data — it cites no other source for it, so there is none to check. The quote shows it is in the paper.
In the paper
“After applying all quality control filters, 903,837 autosomal SNPs were available for analysis, of which 24,478 had minor allele frequency (MAF) <0.01.”
§ Genetic Architecture of Skin and Eye Color in an African-European Admixed Population > Materials and Methods > Study population and genotyping QC
plain- Asserted: passes — The authors put it forward as true.
- Checkable: passes — It can be checked against evidence.
- Load-bearing: fails — The paper’s conclusions may not depend on it.
- Based: passes — The paper gives a reason why it holds.
Probably not a substantial claim. The paper’s conclusions may not depend on it. It may state two separate claims as one.
A result the paper reports from its own data — it cites no other source for it, so there is none to check. The quote shows it is in the paper.
In the paper
“In the Cape Verde sample, we used dense genotype data (>900,000 SNPs) to correct for genomic ancestry, and only the first three loci exhibited a significant association with skin color.”
§ Genetic Architecture of Skin and Eye Color in an African-European Admixed Population > Discussion
plaincorrelational- Asserted: passes — The authors put it forward as true.
- Checkable: passes — It can be checked against evidence.
- Load-bearing: passes — The paper’s conclusions depend on it.
- Based: passes — The paper gives a reason why it holds.
It may state two separate claims as one.
The paper states this without a source or data behind it here, so there is nothing to check it against. The quote shows it is in the paper.
In the paper
“Our results do not exclude the possibility that variation in KITLG affects skin color”
§ Genetic Architecture of Skin and Eye Color in an African-European Admixed Population > Discussion
hedgedconditional- Asserted: passes — The authors put it forward as true.
- Checkable: passes — It can be checked against evidence.
- Load-bearing: fails — The paper’s conclusions may not depend on it.
- Based: passes — The paper gives a reason why it holds.
Probably not a substantial claim. The paper’s conclusions may not depend on it.
A result the paper reports from its own data — it cites no other source for it, so there is none to check. The quote shows it is in the paper.
In the paper
“Effect sizes shown in Figure 5 and Figure 7 for APBA2 (0.155) GRM5-TYR (0.193), SLC24A5 (0.334), and SLC45A2 (0.166) are from a linear regression of the Cape Verde skin color data in which genomic ancestry and genotypes at the four major loci are included as covariates.”
§ Genetic Architecture of Skin and Eye Color in an African-European Admixed Population > Materials and Methods > Power calculations and estimates of effect size
plaincorrelational- Asserted: passes — The authors put it forward as true.
- Checkable: passes — It can be checked against evidence.
- Load-bearing: fails — The paper’s conclusions may not depend on it.
- Based: passes — The paper gives a reason why it holds.
Probably not a substantial claim. The paper’s conclusions may not depend on it.
A result the paper reports from its own data — it cites no other source for it, so there is none to check. The quote shows it is in the paper.
In the paper
“To evaluate potential secondary signals, we also carried out an association scan conditioning at all index SNPs, and found no evidence for secondary signals except in the GRM5-TYR region (rs10831496 and rs1042602, respectively) as described in the conditional analysis section of the Results.”
§ Genetic Architecture of Skin and Eye Color in an African-European Admixed Population > Materials and Methods > Association and admixture mapping
plain- Asserted: passes — The authors put it forward as true.
- Checkable: passes — It can be checked against evidence.
- Load-bearing: passes — The paper’s conclusions depend on it.
- Based: passes — The paper gives a reason why it holds.
It may state two separate claims as one.
In the paper
“By comparison, MM in individuals of European ancestry is smaller and much more narrowly distributed, with a mean of 5.38 and standard deviation of 0.27 [23].”
§ Genetic Architecture of Skin and Eye Color in an African-European Admixed Population > Results > Quantitative assessment of pigmentary phenotypes
What the sources say
- Not checked yetcites [23] SI Candille, 2012, Genome-wide association studies of quantitatively measured skin, eye, and hair pigmentation in four European populations, PLoS ONE source
plain- Asserted: passes — The authors put it forward as true.
- Checkable: passes — It can be checked against evidence.
- Load-bearing: unclear — It is unclear whether the paper’s conclusions depend on it.
- Based: passes — The paper gives a reason why it holds.
It may state two separate claims as one.
What the paper did — it cites no source for this, so there is none to check. The quote shows it is in the paper.
In the paper
“the direction of effect is consistent across all groups, with the derived allele associated with lighter skin color or a lower T-index”
§ Genetic Architecture of Skin and Eye Color in an African-European Admixed Population > Results > Mapping loci associated with skin and eye color
plaincorrelationaln = 685- Asserted: passes — The authors put it forward as true.
- Checkable: passes — It can be checked against evidence.
- Load-bearing: passes — The paper’s conclusions depend on it.
- Based: passes — The paper gives a reason why it holds.
It may state two separate claims as one.
What the paper did — it cites no source for this, so there is none to check. The quote shows it is in the paper.
In the paper
“After removing SNPs surrounding these six loci, the genomic control parameters were 1.02 and 1.00 for skin color and eye color, respectively.”
§ Genetic Architecture of Skin and Eye Color in an African-European Admixed Population > Results > Mapping loci associated with skin and eye color
plainn = 685- Asserted: passes — The authors put it forward as true.
- Checkable: passes — It can be checked against evidence.
- Load-bearing: passes — The paper’s conclusions depend on it.
- Based: passes — The paper gives a reason why it holds.
It may state two separate claims as one.
What the paper did — it cites no source for this, so there is none to check. The quote shows it is in the paper.
In the paper
“The genome-wide association results described below are based on a linear regression adjusting for the first three principal components (PC) but the same model adjusting for up to 10 PCs does not qualitatively alter our results.”
§ Genetic Architecture of Skin and Eye Color in an African-European Admixed Population > Results > Genetic admixture in Cape Verdeans
plain- Asserted: passes — The authors put it forward as true.
- Checkable: passes — It can be checked against evidence.
- Load-bearing: passes — The paper’s conclusions depend on it.
- Based: passes — The paper gives a reason why it holds.
It may state two separate claims as one.
- Rests on an assumption: HapMap CEU and YRI individuals adequately represent the European and African ancestral populations of Cape Verde.
A conclusion the paper draws from its own results — it cites no other source for it, so there is none to check. The quote shows it is in the paper.
In the paper
“As described below, these signals correspond to SLC24A5 for skin color and HERC2 (OCA2) for eye color”
§ Genetic Architecture of Skin and Eye Color in an African-European Admixed Population > Results > Mapping loci associated with skin and eye color
plaincorrelationaln = 685- Asserted: passes — The authors put it forward as true.
- Checkable: passes — It can be checked against evidence.
- Load-bearing: passes — The paper’s conclusions depend on it.
- Based: passes — The paper gives a reason why it holds.
It may state two separate claims as one.
In the paper
“thought to encode membrane transport proteins that promote melanogenesis [13], [25]–[27].”
§ Genetic Architecture of Skin and Eye Color in an African-European Admixed Population > Results > Refinement of pigmentation loci by imputation and conditional analysis
What the sources say
- Not checked yetcites [13], [25]–[27]
hedgedconditional- Asserted: passes — The authors put it forward as true.
- Checkable: passes — It can be checked against evidence.
- Load-bearing: passes — The paper’s conclusions depend on it.
- Based: passes — The paper gives a reason why it holds.
Probably not a substantial claim.
In the paper
“expression of both genes is pigment cell-specific, and null mutations dramatically impair melanin synthesis in model organisms [13], [28], [29].”
§ Genetic Architecture of Skin and Eye Color in an African-European Admixed Population > Results > Refinement of pigmentation loci by imputation and conditional analysis
What the sources say
- Not checked yetcites [13], [28], [29]
plaindirect- Asserted: passes — The authors put it forward as true.
- Checkable: passes — It can be checked against evidence.
- Load-bearing: passes — The paper’s conclusions depend on it.
- Based: passes — The paper gives a reason why it holds.
It may state two separate claims as one.
In the paper
“We study pigmentary variation in 699 individuals from Cape Verde, where extensive West African/European admixture has given rise to a broad range in trait values and genomic ancestry proportions.”
- Also stated in: § Introduction · plain
“In this population, extensive genetic admixture between the African and European ancestral populations during the last several centuries [16], [17] has facilitated assortment of pigmentary alleles.”
§ Genetic Architecture of Skin and Eye Color in an African-European Admixed Population > Abstract
What the sources say
- Not checked yetcites [16], [17]
plaindirectn = 699- Asserted: passes — The authors put it forward as true.
- Checkable: passes — It can be checked against evidence.
- Load-bearing: passes — The paper’s conclusions depend on it.
- Based: passes — The paper gives a reason why it holds.
It may state two separate claims as one.
- Also stated in: § Introduction · plain
In the paper
“has been well recognized to account for Mendelian-like inheritance of blue vs. brown eye color in populations of European ancestry [7], [8], [10].”
§ Genetic Architecture of Skin and Eye Color in an African-European Admixed Population > Results > Refinement of pigmentation loci by imputation and conditional analysis
What the sources say
- Not checked yetcites [7], [8], [10]
boosteddirect- Asserted: passes — The authors put it forward as true.
- Checkable: passes — It can be checked against evidence.
- Load-bearing: fails — The paper’s conclusions may not depend on it.
- Based: passes — The paper gives a reason why it holds.
Probably not a substantial claim. The paper’s conclusions may not depend on it.
In the paper
“two well-known pigmentary genes for which a complete loss-of-function causes albinism in humans and in other animals [30]–[32].”
§ Genetic Architecture of Skin and Eye Color in an African-European Admixed Population > Results > Refinement of pigmentation loci by imputation and conditional analysis
What the sources say
- Not checked yetcites [30]–[32]
boosteddirect- Asserted: passes — The authors put it forward as true.
- Checkable: passes — It can be checked against evidence.
- Load-bearing: fails — The paper’s conclusions may not depend on it.
- Based: passes — The paper gives a reason why it holds.
Probably not a substantial claim. The paper’s conclusions may not depend on it.
A conclusion the paper draws from its own results — it cites no other source for it, so there is none to check. The quote shows it is in the paper.
In the paper
“Thus, in any particular individual, genomic ancestry has predictive value for genotype at each of the four major skin color loci, and vice versa.”
§ Genetic Architecture of Skin and Eye Color in an African-European Admixed Population > Results > Genetic architecture of pigmentary variation in Cape Verde
plaincorrelational- Asserted: passes — The authors put it forward as true.
- Checkable: passes — It can be checked against evidence.
- Load-bearing: passes — The paper’s conclusions depend on it.
- Based: passes — The paper gives a reason why it holds.
It may state two separate claims as one.
A conclusion the paper draws from its own results — it cites no other source for it, so there is none to check. The quote shows it is in the paper.
In the paper
“If skin color in Cape Verde is 80% heritable, the four major loci and individual ancestry explain most of that variation, with only a small amount of “missing heritability””
§ Genetic Architecture of Skin and Eye Color in an African-European Admixed Population > Results > Genetic architecture of pigmentary variation in Cape Verde
plaincorrelational- Asserted: passes — The authors put it forward as true.
- Checkable: passes — It can be checked against evidence.
- Load-bearing: passes — The paper’s conclusions depend on it.
- Based: passes — The paper gives a reason why it holds.
It may state two separate claims as one.
- The authors state this as an assumption: Skin color in Cape Verde is 80% heritable.
A conclusion the paper draws from its own results — it cites no other source for it, so there is none to check. The quote shows it is in the paper.
In the paper
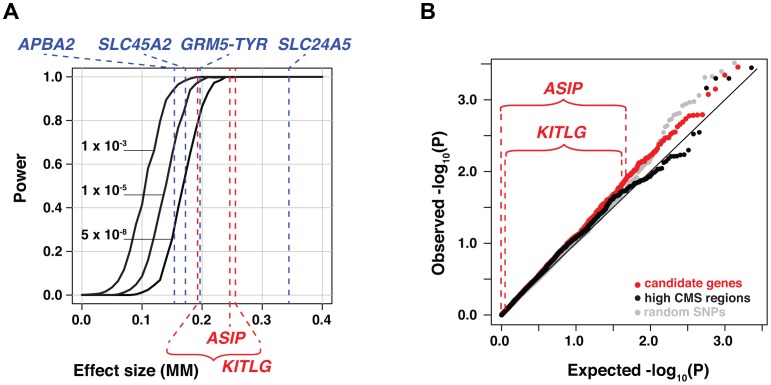
“the failure to replicate previously reported effects could be due to a paucity of allelic variation in the Cape Verde ancestral populations (e.g. MC1R), incomplete correction for genomic ancestry with small panels of ancestry informative markers in the earlier studies (e.g. ASIP, KITLG), or real effects of these loci that are too small to detect in our study.”
§ Genetic Architecture of Skin and Eye Color in an African-European Admixed Population > Results > Power to detect additional loci
hedgedconditional- Asserted: passes — The authors put it forward as true.
- Checkable: passes — It can be checked against evidence.
- Load-bearing: passes — The paper’s conclusions depend on it.
- Based: passes — The paper gives a reason why it holds.
Probably not a substantial claim. It may state two separate claims as one.
None of the sources cited for this claim have been checked yet.
In the paper
“OCA2 was originally considered a strong candidate gene for Afro-European pigmentary variation based on allele distribution patterns of closely linked SNPs [11], [14], [34], [35], and because of a strong association with blue vs. brown eye color in populations of European ancestry [4], [41].”
§ Genetic Architecture of Skin and Eye Color in an African-European Admixed Population > Discussion
What the sources say
- Not checked yetcites [11] MD Shriver, 2003, Skin pigmentation, biogeographical ancestry and admixture mapping, Hum Genet source
- Not checked yetcites [14] HL Norton, 2007, Genetic evidence for the convergent evolution of light skin in Europeans and East Asians, Mol Biol Evol source
- Not checked yetcites [34], [35]
boostedcorrelational- Asserted: passes — The authors put it forward as true.
- Checkable: passes — It can be checked against evidence.
- Load-bearing: unclear — It is unclear whether the paper’s conclusions depend on it.
- Based: passes — The paper gives a reason why it holds.
It may state two separate claims as one.
In the paper
“Previous genome-wide studies of human skin and eye color have focused on populations of European ancestry and have been based primarily on categorical and subjective assessment of pigmentary phenotype [4]–[7].”
§ Genetic Architecture of Skin and Eye Color in an African-European Admixed Population > Discussion
What the sources say
- Not checked yetcites [4]–[7]
plain- Asserted: passes — The authors put it forward as true.
- Checkable: passes — It can be checked against evidence.
- Load-bearing: passes — The paper’s conclusions depend on it.
- Based: passes — The paper gives a reason why it holds.
It may state two separate claims as one.
What the paper did — it cites no source for this, so there is none to check. The quote shows it is in the paper.
In the paper
“Hardy-Weinberg equilibrium was not used as a quality filter due to the admixed nature of the subjects.”
§ Genetic Architecture of Skin and Eye Color in an African-European Admixed Population > Materials and Methods > Study population and genotyping QC
plain- Asserted: passes — The authors put it forward as true.
- Checkable: passes — It can be checked against evidence.
- Load-bearing: fails — The paper’s conclusions may not depend on it.
- Based: passes — The paper gives a reason why it holds.
Probably not a substantial claim. The paper’s conclusions may not depend on it.
In the paper
“compared to 4.8 melanin units estimated by Lamason et al. [13] in an African-American sample.”
§ Genetic Architecture of Skin and Eye Color in an African-European Admixed Population > Discussion
What the sources say
- Not checked yetcites [13] RL Lamason, 2005, SLC24A5, a putative cation exchanger, affects pigmentation in zebrafish and humans, Science source
hedgedcorrelational- Asserted: passes — The authors put it forward as true.
- Checkable: passes — It can be checked against evidence.
- Load-bearing: passes — The paper’s conclusions depend on it.
- Based: passes — The paper gives a reason why it holds.
Probably not a substantial claim.
What the paper did — it cites no source for this, so there is none to check. The quote shows it is in the paper.
In the paper
“SNPs with genotyping call rate <95%, SNPs showing replication errors across 20 replicated samples, SNPs in which the apparent heterozygosity was equal to one, and SNPs for which only a single allele was called in the Cape Verde dataset were removed from the analyses.”
§ Genetic Architecture of Skin and Eye Color in an African-European Admixed Population > Materials and Methods > Study population and genotyping QC
plainn = 20- Asserted: passes — The authors put it forward as true.
- Checkable: passes — It can be checked against evidence.
- Load-bearing: fails — The paper’s conclusions may not depend on it.
- Based: passes — The paper gives a reason why it holds.
Probably not a substantial claim. The paper’s conclusions may not depend on it. It may state two separate claims as one.
A conclusion the paper draws from its own results — it cites no other source for it, so there is none to check. The quote shows it is in the paper.
In the paper
“If, however, a chromatin loop does form between APBA2 and OCA2, the BP3 region must be contained within that loop.”
§ Genetic Architecture of Skin and Eye Color in an African-European Admixed Population > Discussion
plainconditional- Asserted: passes — The authors put it forward as true.
- Checkable: passes — It can be checked against evidence.
- Load-bearing: fails — The paper’s conclusions may not depend on it.
- Based: fails — The paper may give no reason why it holds.
Probably not a substantial claim. The paper’s conclusions may not depend on it. The paper may give no reason why it holds.
In the paper
“Identity-by-states (IBS), estimated using all autosomal SNPs in PLINK [47], revealed 12 pairs of cryptic relationships (IBS>0.8). One individual from each pair was excluded.”
§ Genetic Architecture of Skin and Eye Color in an African-European Admixed Population > Materials and Methods > Study population and genotyping QC
What the sources say
- Not checked yetcites [47] S Purcell, 2007, PLINK: a tool set for whole-genome association and population-based linkage analyses, Am J Hum Genet source
plain- Asserted: passes — The authors put it forward as true.
- Checkable: passes — It can be checked against evidence.
- Load-bearing: fails — The paper’s conclusions may not depend on it.
- Based: passes — The paper gives a reason why it holds.
Probably not a substantial claim. The paper’s conclusions may not depend on it. It may state two separate claims as one.
None of the sources cited for this claim have been checked yet.
In the paper
“SLC24A5 and KITLG have been reported to have effect sizes that correspond to 25%–38% and 20%–25% of the European-West African difference in skin color, respectively [13], [15].”
§ Genetic Architecture of Skin and Eye Color in an African-European Admixed Population > Discussion
What the sources say
- Not checked yetcites [13] RL Lamason, 2005, SLC24A5, a putative cation exchanger, affects pigmentation in zebrafish and humans, Science source
- Not checked yetcites [15] CT Miller, 2007, cis-Regulatory changes in Kit ligand expression and parallel evolution of pigmentation in sticklebacks and humans, Cell source
plaincorrelational- Asserted: passes — The authors put it forward as true.
- Checkable: passes — It can be checked against evidence.
- Load-bearing: passes — The paper’s conclusions depend on it.
- Based: passes — The paper gives a reason why it holds.
Probably not a substantial claim. It may state two separate claims as one.
A conclusion the paper draws from its own results — it cites no other source for it, so there is none to check. The quote shows it is in the paper.
In the paper
“Admixture stratification is important in this context because the very same loci that underlie trait differences in ancestral populations are also among the strongest admixture informative markers; therefore, incomplete correction for genomic ancestry will lead to overestimation of the effects for any locus that itself is an admixture informative marker.”
§ Genetic Architecture of Skin and Eye Color in an African-European Admixed Population > Discussion
plaindirect- Asserted: passes — The authors put it forward as true.
- Checkable: passes — It can be checked against evidence.
- Load-bearing: passes — The paper’s conclusions depend on it.
- Based: passes — The paper gives a reason why it holds.
It may state two separate claims as one.
In the paper
“Very recently, Visser et al. [33] showed that the critical SNP in this region, rs12913832, is part of an enhancer that forms a chromatin loop with the OCA2 promoter, and that the derivative allele causes reduced recruitment of the chromatin remodeler HLTF, leading to reduced binding of additional transcription factors and impairment of loop formation and OCA2 expression in cultured human melanocyt”
§ Genetic Architecture of Skin and Eye Color in an African-European Admixed Population > Discussion
What the sources say
- Not checked yetcites [33] M Visser, 2012, HERC2 rs12913832 modulates human pigmentation by attenuating chromatin-loop formation between a long-range enhancer and the OCA2 promoter, Genome Res
boosteddirect- Asserted: passes — The authors put it forward as true.
- Checkable: passes — It can be checked against evidence.
- Load-bearing: unclear — It is unclear whether the paper’s conclusions depend on it.
- Based: passes — The paper gives a reason why it holds.
It may state two separate claims as one.
In the paper
“Hypopigmentation associated with these conditions is thought to be caused by hemizygosity for OCA2 [46] and is therefore independent of any potential cis-acting regulatory region in APBA2.”
§ Genetic Architecture of Skin and Eye Color in an African-European Admixed Population > Discussion
What the sources say
- Not checked yetcites [46] RA Spritz, 1997, Hypopigmentation in the Prader-Willi syndrome correlates with P gene deletion but not with haplotype of the hemizygous P allele, Am J Med Genet source
hedgeddirect- Asserted: passes — The authors put it forward as true.
- Checkable: passes — It can be checked against evidence.
- Load-bearing: unclear — It is unclear whether the paper’s conclusions depend on it.
- Based: passes — The paper gives a reason why it holds.
It may state two separate claims as one.
In the paper
“the ∼1 Mb interval between HERC2 and APBA2 contains a cluster of segmental duplications that serves as a frequent deletion breakpoint (BP3) involved in Prader-Willi and Angelman syndromes [45].”
§ Genetic Architecture of Skin and Eye Color in an African-European Admixed Population > Discussion
What the sources say
- Not checked yetcites [45] AJ Makoff, 2007, Detailed analysis of 15q11–q14 sequence corrects errors and gaps in the public access sequence to fully reveal large segmental duplications at breakpoints for Prader-Willi, Angelman, and inv dup(15) syndromes, Genome Biol source
plaindirect- Asserted: passes — The authors put it forward as true.
- Checkable: passes — It can be checked against evidence.
- Load-bearing: fails — The paper’s conclusions may not depend on it.
- Based: passes — The paper gives a reason why it holds.
Probably not a substantial claim. The paper’s conclusions may not depend on it.
What the paper did — it cites no source for this, so there is none to check. The quote shows it is in the paper.
In the paper
“Two samples with call rate below 95% were removed.”
§ Genetic Architecture of Skin and Eye Color in an African-European Admixed Population > Materials and Methods > Study population and genotyping QC
plainn = 2- Asserted: passes — The authors put it forward as true.
- Checkable: passes — It can be checked against evidence.
- Load-bearing: fails — The paper’s conclusions may not depend on it.
- Based: passes — The paper gives a reason why it holds.
Probably not a substantial claim. The paper’s conclusions may not depend on it.
A conclusion the paper draws from its own results — it cites no other source for it, so there is none to check. The quote shows it is in the paper.
In the paper
“We favor the latter alternative, which supports a view of skin color genetic architecture that is multimodal, in which many genes of small effect cumulatively explain the correlation between skin color and individual ancestry, and together with several genes of moderate effect (GRM5-TYR, APBA2 (OCA2), SLC45A2, and SLC24A5), account for high overall heritability.”
§ Genetic Architecture of Skin and Eye Color in an African-European Admixed Population > Discussion
plaindirect- Asserted: passes — The authors put it forward as true.
- Checkable: passes — It can be checked against evidence.
- Load-bearing: passes — The paper’s conclusions depend on it.
- Based: passes — The paper gives a reason why it holds.
It may state two separate claims as one.
What the paper did — it cites no source for this, so there is none to check. The quote shows it is in the paper.
In the paper
“The extracted irises were manually inspected and found sufficiently accurate.”
§ Genetic Architecture of Skin and Eye Color in an African-European Admixed Population > Materials and Methods > Phenotypes
plain- Asserted: passes — The authors put it forward as true.
- Checkable: passes — It can be checked against evidence.
- Load-bearing: passes — The paper’s conclusions depend on it.
- Based: passes — The paper gives a reason why it holds.
Probably not a substantial claim.
What the paper did — it cites no source for this, so there is none to check. The quote shows it is in the paper.
In the paper
“age was found not correlated with the phenotypes (P>0.5 for both skin and eye colors), and hence was not included as covariate.”
§ Genetic Architecture of Skin and Eye Color in an African-European Admixed Population > Materials and Methods > Association and admixture mapping
plain- Asserted: passes — The authors put it forward as true.
- Checkable: passes — It can be checked against evidence.
- Load-bearing: fails — The paper’s conclusions may not depend on it.
- Based: passes — The paper gives a reason why it holds.
Probably not a substantial claim. The paper’s conclusions may not depend on it. It may state two separate claims as one.
In the paper
“Effect sizes shown in Figure 5 for KITLG (0.19 MM–0.26 MM) are estimated from Miller et al. [15] in which the beta value for rs642742 is reported as 3.8 melanin units based on a linear regression model, and 2.8 melanin units based on ADMIXMAP.”
§ Genetic Architecture of Skin and Eye Color in an African-European Admixed Population > Materials and Methods > Power calculations and estimates of effect size
What the sources say
- Not checked yetcites [15] CT Miller, 2007, cis-Regulatory changes in Kit ligand expression and parallel evolution of pigmentation in sticklebacks and humans, Cell source
plain- Asserted: passes — The authors put it forward as true.
- Checkable: passes — It can be checked against evidence.
- Load-bearing: unclear — It is unclear whether the paper’s conclusions depend on it.
- Based: passes — The paper gives a reason why it holds.
It may state two separate claims as one.
A conclusion the paper draws from its own results — it cites no other source for it, so there is none to check. The quote shows it is in the paper.
In the paper
“We note that the PAV is non-additive; in other words, variance accounted by two loci is not the sum of the PAV of the two loci individually.”
§ Genetic Architecture of Skin and Eye Color in an African-European Admixed Population > Materials and Methods > Genetic architecture
plain- Asserted: passes — The authors put it forward as true.
- Checkable: passes — It can be checked against evidence.
- Load-bearing: passes — The paper’s conclusions depend on it.
- Based: passes — The paper gives a reason why it holds.
It may state two separate claims as one.
In the paper
“We also carried out an association analysis with the program EMMAX [22], which adjusts for population stratification by including a relationship matrix as a random effect; the results (Figure S1) were similar to those obtained using conventional association analysis (Figure 3).”
§ Genetic Architecture of Skin and Eye Color in an African-European Admixed Population > Materials and Methods > Association and admixture mapping
What the sources say
- Not checked yetcites [22] HM Kang, 2010, Variance component model to account for sample structure in genome-wide association studies, Nat Genet source
plain- Asserted: passes — The authors put it forward as true.
- Checkable: passes — It can be checked against evidence.
- Load-bearing: unclear — It is unclear whether the paper’s conclusions depend on it.
- Based: passes — The paper gives a reason why it holds.
It may state two separate claims as one.
What the paper did — it cites no source for this, so there is none to check. The quote shows it is in the paper.
In the paper
“To exclude the possibility that the association between skin color and genome-wide ancestry is due to geographic confounding between islands, we examined this correlation within each island (Table S1).”
§ Genetic Architecture of Skin and Eye Color in an African-European Admixed Population > Materials and Methods > Genetic architecture
plaincorrelational- Asserted: passes — The authors put it forward as true.
- Checkable: passes — It can be checked against evidence.
- Load-bearing: passes — The paper’s conclusions depend on it.
- Based: passes — The paper gives a reason why it holds.
Probably not a substantial claim.
- The authors state this as an assumption: The Cape Verdean population has two ancestral populations (European and West African).
In the paper
“Similarly, the effect size shown in Figure 5 for ASIP (0.24 MM) is estimated from 3.5 melanin units based on data in Bonilla et al. [12].”
§ Genetic Architecture of Skin and Eye Color in an African-European Admixed Population > Materials and Methods > Power calculations and estimates of effect size
What the sources say
- Not checked yetcites [12] C Bonilla, 2005, The 8818G allele of the agouti signaling protein (ASIP) gene is ancestral and is associated with darker skin color in African Americans, Hum Genet source
hedged- Asserted: passes — The authors put it forward as true.
- Checkable: passes — It can be checked against evidence.
- Load-bearing: fails — The paper’s conclusions may not depend on it.
- Based: passes — The paper gives a reason why it holds.
Probably not a substantial claim. The paper’s conclusions may not depend on it.
A conclusion the paper draws from its own results — it cites no other source for it, so there is none to check. The quote shows it is in the paper.
In the paper
“Thus, while the CEU and YRI are imperfect ancestral populations, they do not cause a large bias in either genome-wide or local ancestry estimates.”
§ Genetic Architecture of Skin and Eye Color in an African-European Admixed Population > Materials and Methods > Characterization of genetic admixture
plain- Asserted: passes — The authors put it forward as true.
- Checkable: passes — It can be checked against evidence.
- Load-bearing: passes — The paper’s conclusions depend on it.
- Based: passes — The paper gives a reason why it holds.
It may state two separate claims as one.
- The authors state this as an assumption: The Cape Verdean population has two ancestral populations (European and West African).
In the paper
“However, the genetic relationship matrix based on allele sharing is inflated by population structure [55]; in addition, in pilot studies we observed a large sampling variability of GCTA-estimated heritability due to the moderate size of the Cape Verde sample.”
§ Genetic Architecture of Skin and Eye Color in an African-European Admixed Population > Materials and Methods > Genetic architecture
What the sources say
- Not checked yetcites [55] SR Browning, 2011, Population structure can inflate SNP-based heritability estimates, Am J Hum Genet source
plaindirect- Asserted: passes — The authors put it forward as true.
- Checkable: passes — It can be checked against evidence.
- Load-bearing: passes — The paper’s conclusions depend on it.
- Based: passes — The paper gives a reason why it holds.
It may state two separate claims as one.
What the paper did — it cites no source for this, so there is none to check. The quote shows it is in the paper.
In the paper
“Assessment and control for population stratification is described in Results; the P values reported in Table 1 and are derived from linear regressions using PLINK in which the first 3 principle components and sex are included as covariates.”
§ Genetic Architecture of Skin and Eye Color in an African-European Admixed Population > Materials and Methods > Association and admixture mapping
plain- Asserted: passes — The authors put it forward as true.
- Checkable: passes — It can be checked against evidence.
- Load-bearing: passes — The paper’s conclusions depend on it.
- Based: passes — The paper gives a reason why it holds.
Probably not a substantial claim. It may state two separate claims as one.
- The authors state this as an assumption: The Cape Verdean population has two ancestral populations (European and West African).
What the paper did — it cites no source for this, so there is none to check. The quote shows it is in the paper.
In the paper
“This approach preserves a realistic level of correlation structure between phenotype, genome-wide ancestry proportions and genotypes, and also takes into account the two strongest predictors of phenotype: genome-wide ancestry and genotype at SLC24A5.”
§ Genetic Architecture of Skin and Eye Color in an African-European Admixed Population > Materials and Methods > Power calculations and estimates of effect size
plaincorrelational- Asserted: passes — The authors put it forward as true.
- Checkable: passes — It can be checked against evidence.
- Load-bearing: unclear — It is unclear whether the paper’s conclusions depend on it.
- Based: passes — The paper gives a reason why it holds.
It may state two separate claims as one.
- The authors state this as an assumption: Residual non-genetic variance is independent of any genotype or ancestry.
- The authors state this as an assumption: The simulated phenotype has a genetic architecture with three major loci, each with the same effect as SLC24A5 and perfectly ancestrally informative.
In the paper
“Imputed genotypes were inferred with the MaCH 1.0.16 package [52] using combined CEU and YRI haplotypes as reference; we report SNPs whose predicted R∧2 between true and imputed genotypes >0.80.”
§ Genetic Architecture of Skin and Eye Color in an African-European Admixed Population > Materials and Methods > Imputation, selection signature, and haplotype analysis
What the sources say
- Not checked yetcites [52] Y Li, 2010, MaCH: using sequence and genotype data to estimate haplotypes and unobserved genotypes, Genet Epidemiol source
plain- Asserted: passes — The authors put it forward as true.
- Checkable: passes — It can be checked against evidence.
- Load-bearing: passes — The paper’s conclusions depend on it.
- Based: passes — The paper gives a reason why it holds.
Probably not a substantial claim. It may state two separate claims as one.
What the paper did — it cites no source for this, so there is none to check. The quote shows it is in the paper.
In the paper
“We restricted the association scans to the 879,359 autosomal SNPs with MAF>0.01; SNPs achieving a P<5.7×10⁻⁸ were considered genome-wide significant.”
§ Genetic Architecture of Skin and Eye Color in an African-European Admixed Population > Materials and Methods > Association and admixture mapping
plain- Asserted: passes — The authors put it forward as true.
- Checkable: passes — It can be checked against evidence.
- Load-bearing: passes — The paper’s conclusions depend on it.
- Based: passes — The paper gives a reason why it holds.
Probably not a substantial claim. It may state two separate claims as one.
In the paper
“In simulation studies, the ARHMM achieves comparable accuracy as HapMix [49], but is more flexible and does not require information about the recombination rate.”
§ Genetic Architecture of Skin and Eye Color in an African-European Admixed Population > Materials and Methods > Characterization of genetic admixture
What the sources say
- Not checked yetcites [49] AL Price, 2009, Sensitive detection of chromosomal segments of distinct ancestry in admixed populations, PLoS Genet source
plain- Asserted: passes — The authors put it forward as true.
- Checkable: passes — It can be checked against evidence.
- Load-bearing: unclear — It is unclear whether the paper’s conclusions depend on it.
- Based: passes — The paper gives a reason why it holds.
It may state two separate claims as one.
A conclusion the paper draws from its own results — it cites no other source for it, so there is none to check. The quote shows it is in the paper.
In the paper
“In our situation, if we code G1 and G2 to represent the derived (pigmentation lightening) alleles at the two loci, then cov(G1, G2)>0 due to admixture linkage disequilibrium, γ1γ2>0, and we have V12<(V1+V2), as is indicated by the overlapping areas in Figure 7.”
§ Genetic Architecture of Skin and Eye Color in an African-European Admixed Population > Materials and Methods > Genetic architecture
plaincorrelational- Asserted: passes — The authors put it forward as true.
- Checkable: passes — It can be checked against evidence.
- Load-bearing: passes — The paper’s conclusions depend on it.
- Based: passes — The paper gives a reason why it holds.
It may state two separate claims as one.
The paper relies on this without support.
The true ancestral populations for Cape Verde likely include contributions from several areas of Southern Europe and several areas of West Africa.
“We also note that the true ancestral populations for Cape Verde are likely to include contributions from several areas of Southern Europe, and several areas of West Africa.”
The authors state this as an assumption.
Skin color in Cape Verde is 80% heritable.
“If skin color in Cape Verde is 80% heritable, the four major loci and individual ancestry explain most of that variation”
The paper relies on this without support.
HapMap CEU and YRI individuals adequately represent the European and African ancestral populations of Cape Verde.
“Data from CEU and YRI HapMap individuals [19] was used to partition each Cape Verdean individual's ancestry into “European” and “African” components.”
The authors state this as an assumption.
The Cape Verdean population has two ancestral populations (European and West African).
“assuming two ancestral populations”
The authors state this as an assumption.
Residual non-genetic variance is independent of any genotype or ancestry.
“The residual non-genetic variance was assumed to be independent of any genotype or ancestry, such that the total variance in each simulated phenotype matches that observed for skin pigmentation in Cape Verde.”
The authors state this as an assumption.
The simulated phenotype has a genetic architecture with three major loci, each with the same effect as SLC24A5 and perfectly ancestrally informative.
“The phenotypes were simulated assuming a genetic architecture with three major loci, each of which has the same effect as SLC24A5 and is perfectly ancestrally informative.”
Claims other papers make about this one
Each is checked against this paper’s own text: does it say what the citing paper says it does?
The source backs part of the claim, not all of it — or backs it for a different population, condition or comparison.
In the citing paper
“multiple lines of evidence suggest that differences in skin pigmentation across populations have evolved primarily in response to ultraviolet radiation [17,20–22].”
From Investigating the case of human nose shape and climate adaptation (2017) · cites this paper as [17]
Experimental — accuracy not yet measuredIn the citing paper
“Interestingly, the heritability of skin pigmentation is very low in Europeans (hg2 = 0.191; N = 1,231), which we think can be explained by reduced genetic variation at skin pigmentation loci due to strong positive selection for lighter skin in Europeans [17,21,38].”
From Investigating the case of human nose shape and climate adaptation (2017) · cites this paper as [17]
Self-check
Percentages, sums and reported differences re-computed from the paper’s own numbers.
Each contradiction between two passages listed here was confirmed by an independent check.
Rated minor: it would not touch a result — a value no result rests on, a p-value that stays on the same side of the significance level, or a conflict that is clerical, resolved elsewhere in the paper, or outside its own findings.
In the paper
§ Genetic Architecture of Skin and Eye Color in an African-European Admixed Population > Results > Genetic architecture of pigmentary variation in Cape Verde
“and the sum of effect sizes for homozygous substitution at all four loci would shift, in an individual, an amount about the same as ∼1/3 of the total range of skin color we observed (Figure 6a).”
§ Genetic Architecture of Skin and Eye Color in an African-European Admixed Population > Results > Genetic architecture of pigmentary variation in Cape Verde
“Figure: Figure 7 Genetic architecture of skin color variation. (a) Effect sizes of the loci associated with skin color.”
Rated minor: it would not touch a result — a value no result rests on, a p-value that stays on the same side of the significance level, or a conflict that is clerical, resolved elsewhere in the paper, or outside its own findings.
In the paper
§ Genetic Architecture of Skin and Eye Color in an African-European Admixed Population > Results > Genetic and evolutionary relationships of eye and skin color genes at 15q13.1
“eye [HERC2 rs1291382; (a)]”
§ Genetic Architecture of Skin and Eye Color in an African-European Admixed Population > Results > Mapping loci associated with skin and eye color
“| 15q13.1 | HERC2, OCA2 | rs12913832 | 2.3×10−62 | 2.3×10⁻²⁷ | −/−/−/− | 0.79 | 0.00 | 0.18 |”
Citations
Cites
PLINK: a tool set for whole-genome association and population-based linkage analyses.
Purcell, S., Neale, B., Todd-Brown, K., Thomas, L., Ferreira, M. A. R., Bender, D., Maller, J., Sklar, P., de Bakker, P. I. W., Daly, M. J., et al. (2007) · The American Journal of Human Genetics · doi:10.1086/519795 · Cited by 34,089
Principal components analysis corrects for stratification in genome-wide association studies
Price, A. L., Patterson, N. J., Plenge, R. M., Weinblatt, M. E., Shadick, N. A., & Reich, D. (2006) · Nature Genetics · doi:10.1038/ng1847 · Cited by 10,248
GCTA: a tool for genome-wide complex trait analysis
Yang, J., Lee, S. H., Goddard, M. E., & Visscher, P. M. (2011) · The American Journal of Human Genetics · doi:10.1016/j.ajhg.2010.11.011 · Cited by 8,279
Huber, P. J. (1981) · Wiley Series in Probability and Statistics · doi:10.1002/0471725250 · Cited by 7,066
The International HapMap Project
†The International HapMap Consortium, Genotyping centres: Baylor College of Medicine and ParAllele BioScience, Gibbs, R. A., Belmont, J. W., Hardenbol, P., Willis, T. D., Yu, F., Chinese HapMap Consortium, Yang, H., Ch'ang, L.-Y., et al. (2003) · Nature · doi:10.1038/nature02168 · Cited by 6,057
A gene atlas of the mouse and human protein-encoding transcriptomes
Su, A. I., Wiltshire, T., Batalov, S., Lapp, H., Ching, K. A., Block, D., Zhang, J., Soden, R., Hayakawa, M., Kreiman, G., et al. (2004) · Proceedings of the National Academy of Sciences · doi:10.1073/pnas.0400782101 · Cited by 3,475
Variance component model to account for sample structure in genome-wide association studies
Kang, H. M., Sul, J. H., Service, S. K., Zaitlen, N. A., Kong, S.-Y., Freimer, N. B., Sabatti, C., & Eskin, E. (2010) · Nature Genetics · doi:10.1038/ng.548 · Cited by 2,817
Worldwide Human Relationships Inferred from Genome-Wide Patterns of Variation
Li, J. Z., Absher, D. M., Tang, H., Southwick, A. M., Casto, A. M., Ramachandran, S., Cann, H. M., Barsh, G. S., Feldman, M. W., Cavalli-Sforza, L. L., et al. (2008) · Science · doi:10.1126/science.1153717 · Cited by 1,915
Self-citationMaCH: using sequence and genotype data to estimate haplotypes and unobserved genotypes
Li, Y., Willer, C. J., Ding, J., Scheet, P., & Abecasis, G. R. (2010) · Genetic Epidemiology · doi:10.1002/gepi.20533 · Cited by 1,843
Browning, B. L., & Browning, S. R. (2009) · The American Journal of Human Genetics · doi:10.1016/j.ajhg.2009.01.005 · Cited by 1,640
Research works printed but not linked: 1
- Baleno IC (2001) Povoamento e Formação da Sociedade. In: Albuquerque L, Santos, M.E., editor. História Geral de Cabo Verde. Lisbon, Praia: Instituto de Investigação Científica Tropical, Instituto Nacional de Investigação, Promoção e Património Culturais de Cabo Verde. pp. 125–177.
Cited by
Sorted by citations
The advantages and limitations of trait analysis with GWAS: a review
Korte, A., & Farlow, A. (2013) · Plant Methods · doi:10.1186/1746-4811-9-29 · Cited by 1,762
Genome-wide patterns of selection in 230 ancient Eurasians
Mathieson, I., Lazaridis, I., Rohland, N., Mallick, S., Patterson, N., Roodenberg, S. A., Harney, E., Stewardson, K., Fernandes, D., Novak, M., et al. (2015) · Nature · doi:10.1038/nature16152 · Cited by 1,515
Ancient human genomes suggest three ancestral populations for present-day Europeans
Lazaridis, I., Patterson, N., Mittnik, A., Renaud, G., Mallick, S., Kirsanow, K., Sudmant, P. H., Schraiber, J. G., Castellano, S., Lipson, M., et al. (2014) · Nature · doi:10.1038/nature13673 · Cited by 1,357
Southern African ancient genomes estimate modern human divergence to 350,000 to 260,000 years ago
Schlebusch, C. M., Malmström, H., Günther, T., Sjödin, P., Coutinho, A., Edlund, H., Munters, A. R., Vicente, M., Steyn, M., Soodyall, H., et al. (2017) · Science · doi:10.1126/science.aao6266 · Cited by 519
A population genetic signal of polygenic adaptation
Berg, J. J., & Coop, G. (2014) · PLoS Genetics · doi:10.1371/journal.pgen.1004412 · Cited by 487
Ruiz-Linares, A., Adhikari, K., Acuña-Alonzo, V., Quinto-Sanchez, M., Jaramillo, C., Arias, W., Fuentes, M., Pizarro, M., Everardo, P., de Avila, F., et al. (2014) · PLoS Genetics · doi:10.1371/journal.pgen.1004572 · Cited by 442
“Europeans and certain of these show large allele frequency differences between Europeans and non-Europeans [1,2,36].”
BackgroundGoing global by adapting local: A review of recent human adaptation
Fan, S., Hansen, M. E. B., Lo, Y., & Tishkoff, S. A. (2016) · Science · doi:10.1126/science.aaf5098 · Cited by 387
Loci associated with skin pigmentation identified in African populations
Crawford, N. G., Kelly, D. E., Hansen, M. E. B., Beltrame, M. H., Fan, S., Bowman, S. L., Jewett, E., Ranciaro, A., Thompson, S., Lo, Y., et al. (2017) · Science · doi:10.1126/science.aan8433 · Cited by 321
Del Bino, S., Duval, C., & Bernerd, F. (2018) · International Journal of Molecular Sciences · doi:10.3390/ijms19092668 · Cited by 315
Higasa, K., Miyake, N., Yoshimura, J., Okamura, K., Niihori, T., Saitsu, H., Doi, K., Shimizu, M., Nakabayashi, K., Aoki, Y., et al. (2016) · Journal of Human Genetics · doi:10.1038/jhg.2016.12 · Cited by 304
Early Neolithic genomes from the eastern Fertile Crescent
Broushaki, F., Thomas, M. G., Link, V., López, S., van Dorp, L., Kirsanow, K., Hofmanová, Z., Diekmann, Y., Cassidy, L. M., Díez-del-Molino, D., et al. (2016) · Science · doi:10.1126/science.aaf7943 · Cited by 288
Modeling 3D Facial Shape from DNA
Claes, P., Liberton, D. K., Daniels, K., Rosana, K. M., Quillen, E. E., Pearson, L. N., McEvoy, B., Bauchet, M., Zaidi, A. A., Yao, W., et al. (2014) · PLoS Genetics · doi:10.1371/journal.pgen.1004224 · Cited by 202
Self-citationA polymorphism in IRF4 affects human pigmentation through a tyrosinase-dependent MITF/TFAP2A pathway
Praetorius, C., Grill, C., Stacey, S. N., Metcalf, A. M., Gorkin, D. U., Robinson, K. C., Van Otterloo, E., Kim, R. S. Q., Bergsteinsdottir, K., Ogmundsdottir, M. H., et al. (2013) · Cell · doi:10.1016/j.cell.2013.10.022 · Cited by 228
Adhikari, K., Mendoza‐Revilla, J., Sohail, A., Fuentes‐Guajardo, M., Lampert, J. E., Chacón-Duque, J. C., Hurtado, M., Villegas, V., Granja, V., Acuña-Alonzo, V., et al. (2019) · Nature Communications · doi:10.1038/s41467-018-08147-0 · Cited by 193
Martiniano, R., Cassidy, L. M., Maoldúin, R. Ó., McLaughlin, R. L., Silva, N. M., Manco, L., Fidalgo, D., Pereira, T., Coelho, M. J., Serra, M., et al. (2017) · PLoS Genetics · doi:10.1371/journal.pgen.1006852 · Cited by 157
An Unexpectedly Complex Architecture for Skin Pigmentation in Africans
Martin, A. R., Lin, M., Granka, J. M., Myrick, J. W., Liu, X., Sockell, A., Atkinson, E. G., Werely, C. J., Möller, M., Sandhu, M. S., et al. (2017) · Cell · doi:10.1016/j.cell.2017.11.015 · Cited by 156
Revisiting classic clines in Drosophila melanogaster in the age of genomics
Adrion, J. R., Hahn, M. W., & Cooper, B. S. (2015) · Trends in Genetics · doi:10.1016/j.tig.2015.05.006 · Cited by 149
Genomic signals of migration and continuity in Britain before the Anglo-Saxons
Martiniano, R., Caffell, A. C., Holst, M., Hunter-Mann, K., Montgomery, J., Müldner, G., McLaughlin, R. L., Teasdale, M. D., van Rheenen, W., Veldink, J. H., et al. (2016) · Nature Communications · doi:10.1038/ncomms10326 · Cited by 127
The Light Skin Allele of SLC24A5 in South Asians and Europeans Shares Identity by Descent
Mallick, C. B., Iliescu, F. M., Möls, M., Hill, S. C., Tamang, R., Chaubey, G., Goto, R., Ho, S. Y. W., Romero, I. G., Crivellaro, F., et al. (2013) · PLoS Genetics · doi:10.1371/journal.pgen.1003912 · Cited by 124
Fan, H., Jamsandekar, M., Pettersson, M. E., Su, L., Fuentes‐Pardo, A. P., Davis, B. W., Bekkevold, D., Berg, F., Casini, M., Dahle, G., et al. (2020) · eLife · doi:10.7554/elife.61076 · Cited by 112
Investigating the case of human nose shape and climate adaptation
Zaidi, A. A., Mattern, B. C., Claes, P., McEcoy, B., Hughes, C., & Shriver, M. D. (2017) · PLOS Genetics · doi:10.1371/journal.pgen.1006616 · Cited by 117
Self-citationRecent human adaptation: genomic approaches, interpretation and insights
Scheinfeldt, L., & Tishkoff, S. A. (2013) · Nature Reviews Genetics · doi:10.1038/nrg3604 · Cited by 118
Adaptation of human skin color in various populations
Deng, L., & Xu, S. (2018) · Hereditas · doi:10.1186/s41065-017-0036-2 · Cited by 89
Rifkin, R. F., Dayet, L., Queffelec, A., Summers, B., Lategan, M., & d’Errico, F. (2015) · PLoS ONE · doi:10.1371/journal.pone.0136090 · Cited by 100
Identifying the favored mutation in a positive selective sweep.
Akbari, A., Vitti, J. J., Iranmehr, A., Bakhtiari, M., Sabeti, P. C., Mirarab, S., & Bafna, V. (2018) · Nature Methods · doi:10.1038/nmeth.4606 · Cited by 95
Jablonski, N. G. (2021) · Pigment Cell & Melanoma Research · doi:10.1111/pcmr.12976 · Cited by 87
Teruel, B. M., Parra, E. J., Fuentes-Smith, E., Salas, A., Buttenschøn, H. N., Demontis, D., Torres, M. L., Padrón, L. C. M., Gómez-Cabezas, E. J., Álvarez‐Iglesias, V., et al. (2014) · PLoS Genetics · doi:10.1371/journal.pgen.1004488 · Cited by 93
Influence of Ethnicities and Skin Color Variations in Different Populations: A Review
Naik, P. P., & Farrukh, S. N. (2021) · Skin Pharmacology and Physiology · doi:10.1159/000518826 · Cited by 89
The evolution of skin pigmentation-associated variation in West Eurasia
Ju, D., & Mathieson, I. (2020) · Proceedings of the National Academy of Sciences · doi:10.1073/pnas.2009227118 · Cited by 84
Adaptations to local environments in modern human populations
Jeong, C., & Di Rienzo, A. (2014) · Current Opinion in Genetics & Development · doi:10.1016/j.gde.2014.06.011 · Cited by 80
The Critical Needs and Challenges for Genetic Architecture Studies in Africa
Martin, A. R., Teferra, S., Möller, M., Hoal, E. G., & Daly, M. J. (2018) · Current Opinion in Genetics & Development · doi:10.1016/j.gde.2018.08.005 · Cited by 76
Multiple alleles at a single locus control seed dormancy in Swedish Arabidopsis
Kerdaffrec, E., Filiault, D. L., Korte, A., Sasaki, E., Nizhynska, V., Seren, Ü., & Nordborg, M. (2016) · eLife · doi:10.7554/elife.22502 · Cited by 70
Self-citationEstimating Time to the Common Ancestor for a Beneficial Allele
Smith, J., Coop, G., Stephens, M., & Novembre, J. (2018) · Molecular Biology and Evolution · doi:10.1093/molbev/msy006 · Cited by 68
Rapid adaptation to malaria facilitated by admixture in the human population of Cabo Verde
Hamid, I., Korunes, K. L., Beleza, S. S., & Goldberg, A. (2021) · eLife · doi:10.7554/elife.63177 · Cited by 64
Self-citationA genome-wide genetic screen uncovers determinants of human pigmentation
Bajpai, V. K., Swigut, T., Mohammed, J., Tycko, J., Naqvi, S., Villanueva, M. A., Kim, T. C., Arora, N., Pritchard, J. K., Bassik, M. C., et al. (2023) · Science · doi:10.1126/science.ade6289 · Cited by 69
Shades of complexity: New perspectives on the evolution and genetic architecture of human skin
Quillen, E. E., Norton, H. L., Parra, E. J., Lona‐Durazo, F., Ang, K. C., Illiescu, F. M., Pearson, L. N., Shriver, M. D., Lasisi, T., Gokcumen, O., et al. (2019) · American Journal of Physical Anthropology · doi:10.1002/ajpa.23737 · Cited by 67
Self-citationAssociation of Genetic Variants with Self-Assessed Color Categories in Brazilians
Durso, D. F., Bydlowski, S. P., Hutz, M. H., Suarez‐Kurtz, G., Magalhães, T. R., & Pena, S. D. J. (2014) · PLoS ONE · doi:10.1371/journal.pone.0083926 · Cited by 61
A Genetic Mechanism for Convergent Skin Lightening during Recent Human Evolution
Yang, Z., Zhong, H., Chen, J., Zhang, X., Zhang, H., Luo, X., Xu, S., Chen, H., Lu, D., Han, Y., et al. (2016) · Molecular Biology and Evolution · doi:10.1093/molbev/msw003 · Cited by 60
Lona‐Durazo, F., Hernandez‐Pacheco, N., Fan, S., Zhang, T., Choi, J., Kovacs, M. A., Loftus, S. K., Le, P., Edwards, M., Fortes‐Lima, C., et al. (2019) · BMC Genetics · doi:10.1186/s12863-019-0765-5 · Cited by 55
Self-citationSasaki, E., Gunis, J., Reichardt, I., Nizhynska, V., & Nordborg, M. (2022) · PLoS Genetics · doi:10.1371/journal.pgen.1010345 · Cited by 46
Self-citationKorunes, K. L., & Goldberg, A. (2021) · PLOS Genetics · doi:10.1371/journal.pgen.1009374 · Cited by 51
The Role of Local Ancestry Adjustment in Association Studies Using Admixed Populations
Zhang, J., & Stram, D. O. (2014) · Genetic Epidemiology · doi:10.1002/gepi.21835 · Cited by 47
The Evolutionary History of Human Skin Pigmentation
Rocha, J. (2019) · Journal of Molecular Evolution · doi:10.1007/s00239-019-09902-7 · Cited by 54
Self-citationEdwards, M., Cha, D., Krithika, S., Johnson, M., Cook, G. R., & Parra, E. J. (2015) · Pigment Cell & Melanoma Research · doi:10.1111/pcmr.12435 · Cited by 47
Santos, H. R., Horimoto, A. R. V. R., Tarazona‐Santos, E., Rodrigues‐Soares, F., Barreto, M. L., Horta, B. L., Lima‐Costa, M. F., Gouveia, M. H., Machado, M., da Silva, T. M., et al. (2015) · European Journal of Human Genetics · doi:10.1038/ejhg.2015.187 · Cited by 47
Anthropological genetics perspectives on the transatlantic slave trade
Fortes‐Lima, C., & Verdu, P. (2020) · Human Molecular Genetics · doi:10.1093/hmg/ddaa271 · Cited by 46
Jonnalagadda, M., Faizan, M. A., Ozarkar, S., Ashma, R., Kulkarni, S. S., Norton, H., & Parra, E. J. (2019) · Genome Biology and Evolution · doi:10.1093/gbe/evz057 · Cited by 43
Genetic adaptation of skin pigmentation in highland Tibetans
Yang, Z., Bai, C., Pu, Y., Kong, Q., Guo, Y., Ouzhuluobu, Gengdeng, Liu, X., Zhao, Q., Qiu, Z., et al. (2022) · Proceedings of the National Academy of Sciences · doi:10.1073/pnas.2200421119 · Cited by 41
Yang, Z., Shi, H., Ma, P., Zhao, S., Kong, Q., Bian, T., Gong, C., Zhao, Q., Liu, Y., Qi, X., et al. (2018) · Molecular Biology and Evolution · doi:10.1093/molbev/msy136 · Cited by 44
Identification of a novel locus associated with skin colour in African-admixed populations
Hernandez‐Pacheco, N., Flores, C., Alonso, S., Eng, C. S., Mak, A. C. Y., Hunstman, S., Hu, D., White, M. J., Oh, S. S., Meade, K. E., et al. (2017) · Scientific Reports · doi:10.1038/srep44548 · Cited by 47
Ceballos, F. C., Hazelhurst, S., & Ramsay, M. (2019) · Human Genetics · doi:10.1007/s00439-019-02045-1 · Cited by 42
Implications of the Admixture Process in Skin Color Molecular Assessment
de Cerqueira, C. C. S., Hünemeier, T., Gómez‐Valdés, J., Ramallo, V., Krause, C. D. D. V., Barbosa, A. A. L., Vargas‐Pinilla, P., Dornelles, R. C., Longo, D., Rothhammer, F., et al. (2014) · PLoS ONE · doi:10.1371/journal.pone.0096886 · Cited by 39
Human races are not like dog breeds: refuting a racist analogy
Norton, H., Quillen, E. E., Bigham, A. W., Pearson, L. N., & Dunsworth, H. M. (2019) · Evolution Education and Outreach · doi:10.1186/s12052-019-0109-y · Cited by 42
Wollstein, A., Walsh, S., Liu, F., Chakravarthy, U., Rahu, M., Seland, J. H., Soubrane, G., Tomazzoli, L., Topouzis, F., Vingerling, J. R., et al. (2017) · Scientific Reports · doi:10.1038/srep43359 · Cited by 36
Li, Q., Chen, J., Faux, P., Delgado, M., Bonfante, B., Fuentes‐Guajardo, M., Mendoza‐Revilla, J., Chacón-Duque, J. C., Hurtado, M., Villegas, V., et al. (2023) · Communications Biology · doi:10.1038/s42003-023-04838-7 · Cited by 36
Fracasso, N. C. A., de Andrade, E. S., Wiezel, C. E. V., Andrade, C. C. F., Zanão, L. R., da Silva, M. S., Marano, L. A., Donadi, E. A., Castelli, E. C., Simões, A. L., et al. (2017) · Legal Medicine · doi:10.1016/j.legalmed.2016.12.013 · Cited by 36
Rawofi, L., Edwards, M., Krithika, S., Le, P., Cha, D., Yang, Z., Ma, Y., Wang, J., Su, B., Li, J., et al. (2017) · PeerJ · doi:10.7717/peerj.3951 · Cited by 34
Batai, K., Cui, Z., Arora, A., Shah-Williams, E., Hernandez, W., Ruden, M., Hollowell, C. M. P., Hooker, S. E., Bathina, M., Murphy, A. B., et al. (2021) · PLOS Genetics · doi:10.1371/journal.pgen.1009319 · Cited by 28
Global Patterns of Diversity and Selection in Human Tyrosinase Gene
Hudjashov, G., Villems, R., & Kivisild, T. (2013) · PLoS ONE · doi:10.1371/journal.pone.0074307 · Cited by 32
Sasaki, E., Frommlet, F., & Nordborg, M. (2018) · G3 Genes Genomes Genetics · doi:10.1534/g3.118.200571 · Cited by 31
Self-citationFeng, Y., Xie, N., Inoue, F., Fan, S., Saskin, J., Zhang, C., Zhang, F., Hansen, M. E. B., Nyambo, T., Mpoloka, S. W., et al. (2024) · Nature Genetics · doi:10.1038/s41588-023-01626-1 · Cited by 33
Latitudinal Clines of the Human Vitamin D Receptor and Skin Color Genes
Tiosano, D., Audí, L., Climer, S., Zhang, W., Templeton, A. R., Fernández‐Cancio, M., Gershoni‐Baruch, R., Sánchez-Muro, J. M., Kholy, M. E., & Hochberg, Z. (2016) · G3 Genes Genomes Genetics · doi:10.1534/g3.115.026773 · Cited by 31
Lloyd‐Jones, L. R., Robinson, M. R., Moser, G., Zeng, J., Beleza, S. S., Barsh, G. S., Tang, H., & Visscher, P. M. (2017) · Genetics · doi:10.1534/genetics.116.193383 · Cited by 27
Self-citationGenome-Wide Analyses Identifies Known and New Markers Responsible of Chicken Plumage Color
Mastrangelo, S., Cendron, F., Sottile, G., Niero, G., Portolano, B., Biscarini, F., & Cassandro, M. (2020) · Animals · doi:10.3390/ani10030493 · Cited by 26
GWAS Analysis of 17,019 Korean Women Identifies the Variants Associated with Facial Pigmented Spots
Shin, J., Leem, S., Kim, B., Kim, Y., Lee, S., Song, H. J., Seo, J. Y., Park, S. G., Won, H., & Kang, N. G. (2020) · Journal of Investigative Dermatology · doi:10.1016/j.jid.2020.08.007 · Cited by 27
Global and Local Ancestry and its Importance: A Review
Goli, R. C., Chishi, K. G., Ganguly, I., Singh, S., Dixit, S. P., Rathi, P., Diwakar, V., Chinnareddyvari, C. S., Limbalkar, O. M., Sukhija, N., et al. (2024) · Current Genomics · doi:10.2174/0113892029298909240426094055 · Cited by 27
Assessing the photoprotective effects of red ochre on human skin by in vitro laboratory experiments
Rifkin, R. F., d’Errico, F., Dayet, L., & Summers, B. (2015) · South African Journal of Science · doi:10.17159/sajs.2015/20140202 · Cited by 26
Effects of Advancing Gestation and Non-Caucasian Race on Ductus Arteriosus Gene Expression
Waleh, N. S., Barrette, A. M., Dagle, J. M., Momany, A. M., Jin, C., Hills, N. K., Shelton, E. L., Reese, J., & Clyman, R. I. (2015) · The Journal of Pediatrics · doi:10.1016/j.jpeds.2015.07.011 · Cited by 25
Advances in integrative African genomics
Zhang, C., Hansen, M. E. B., & Tishkoff, S. A. (2021) · Trends in Genetics · doi:10.1016/j.tig.2021.09.013 · Cited by 24
Mishra, A., Nizammuddin, S., Mallick, C. B., Singh, S., Prakash, S., Siddiqui, N. A., Rai, N., Carlus, S. J., Sudhakar, D. V. S., Tripathi, V. P., et al. (2016) · Journal of Investigative Dermatology · doi:10.1016/j.jid.2016.10.043 · Cited by 24
Rapid evolution of a skin-lightening allele in southern African KhoeSan
Lin, M. H., Siford, R. L., Martin, A. R., Nakagome, S., Möller, M., Hoal, E. G., Bustamante, C. D., Gignoux, C. R., & Henn, B. M. (2018) · Proceedings of the National Academy of Sciences · doi:10.1073/pnas.1801948115 · Cited by 26
Genetic architecture and evolution of color variation in American black bears
Puckett, E. E., Davis, I. S., Harper, D. C., Wakamatsu, K., Battu, G., Belant, J. L., Beyer, D. E., Carpenter, C. P., Crupi, A. P., Davidson, M., et al. (2022) · Current Biology · doi:10.1016/j.cub.2022.11.042 · Cited by 23
Self-citationParallel Trajectories of Genetic and Linguistic Admixture in a Genetically Admixed Creole Population
Verdu, P., Jewett, E. M., Pemberton, T. J., Rosenberg, N. A., & Baptista, M. (2017) · Current Biology · doi:10.1016/j.cub.2017.07.002 · Cited by 22
A large Canadian cohort provides insights into the genetic architecture of human hair colour
Lona‐Durazo, F., de Aquino, M. M., Thakur, R., Funderburk, K. M., Zhang, T., Kovacs, M. A., Choi, J., Brown, K. M., & Parra, E. J. (2021) · Communications Biology · doi:10.1038/s42003-021-02764-0 · Cited by 27
Xie, Z., Zhang, T., Kim, S., Lu, J., Zhang, W., Lin, C., Wu, M.-R., Davis, A. E., Channa, R., Giancardo, L., et al. (2024) · PLoS Genetics · doi:10.1371/journal.pgen.1011273 · Cited by 31
Carratto, T. M. T., Marcorin, L., Valle-Silva, G. D., de Oliveira, M. D., Donadi, E., Simões, A., Castelli, E., & Mendes-Junior, C. (2021) · Zeitschrift für Rechtsmedizin · doi:10.1007/s00414-021-02554-7 · Cited by 16
Meng, J., Wang, W., Shi, R., Song, K., Li, L., Que, H., & Zhang, G. (2020) · Ecotoxicology and Environmental Safety · doi:10.1016/j.ecoenv.2020.110208 · Cited by 21
Evolutionary triangulation: informing genetic association studies with evolutionary evidence
Huang, M., Graham, B. E., Zhang, G., Harder, R., Kodaman, N., Moore, J. H., Muglia, L. J., & Williams, S. M. (2016) · BioData Mining · doi:10.1186/s13040-016-0091-7 · Cited by 19
Lasisi, T. (2021) · American Journal of Physical Anthropology · doi:10.1002/ajpa.24264 · Cited by 20
Genetic Connections and Convergent Evolution of Tropical Indigenous Peoples in Asia
Deng, L., Pan, Y., Wang, Y., Chen, H., Yuan, K., Chen, S., Lu, D., Lü, Y., Mokhtar, S. S., Rahman, T. H. A., et al. (2021) · Molecular Biology and Evolution · doi:10.1093/molbev/msab361 · Cited by 20
Korunes, K. L., Soares‐Souza, G. B., Bobrek, K., Tang, H., Araújo, I. I., Goldberg, A., & Beleza, S. S. (2022) · G3 Genes Genomes Genetics · doi:10.1093/g3journal/jkac183 · Cited by 20
Self-citationLocalizing Post-Admixture Adaptive Variants with Object Detection on Ancestry-Painted Chromosomes
Hamid, I., Korunes, K. L., Schrider, D. R., & Goldberg, A. (2023) · Molecular Biology and Evolution · doi:10.1093/molbev/msad074 · Cited by 19
Genetic and phenotypic variability of iris color in Buenos Aires population
Hohl, D. M., Bezus, B., Ratowiecki, J., & Catanesi, C. I. (2018) · Genetics and Molecular Biology · doi:10.1590/1678-4685-gmb-2017-0175 · Cited by 17
Investigating the genetic architecture of eye colour in a Canadian cohort
Lona‐Durazo, F., Thakur, R., Pairo‐Castineira, E., Funderburk, K. M., Zhang, T., Kovacs, M. A., Choi, J., Jackson, I. J., Brown, K. M., & Parra, E. J. (2022) · iScience · doi:10.1016/j.isci.2022.104485 · Cited by 16
Insights on hair, skin and eye color of ancient and contemporary Native Americans
Carratto, T. M. T., Marcorin, L., Debortoli, G., Hünemeier, T., Norton, H., Parra, E. J., Castelli, E. C., & Mendes‐Junior, C. T. (2020) · Forensic Science International Genetics · doi:10.1016/j.fsigen.2020.102335 · Cited by 14
Wang, Y. (2021) · Hereditas · doi:10.1186/s41065-021-00189-7 · Cited by 15
The color of normal: How a Eurocentric focus erases pigmentation complexity
Norton, H. L. (2021) · American Journal of Human Biology · doi:10.1002/ajhb.23554 · Cited by 13
Kim, J., Edge, M. D., Goldberg, A., & Rosenberg, N. A. (2021) · American Journal of Physical Anthropology · doi:10.1002/ajpa.24261 · Cited by 16
Iroki: automatic customization and visualization of phylogenetic treesPreprint
Moore, R. M., Harrison, A. O., McAllister, S. M., Polson, S. W., & Wommack, K. E. (2017) · bioRxiv (Cold Spring Harbor Laboratory) · doi:10.1101/106138 · Cited by 16
Markiewicz, E., & Idowu, O. C. (2022) · Clinical Cosmetic and Investigational Dermatology · doi:10.2147/ccid.s383790 · Cited by 12
Wang, H., Wen, J., Li, H., Zhu, Τ., Zhao, X., Zhang, J., Zhang, X., Tang, C., Qu, L., & Muhatai, G. (2022) · Frontiers in Genetics · doi:10.3389/fgene.2022.985228 · Cited by 12
Norton, H., Werren, E. A., & Friedlaender, J. S. (2015) · BMC Genetics · doi:10.1186/s12863-015-0277-x · Cited by 12
Eye color: A potential indicator of alcohol dependence risk in European Americans
Sulovari, A., Kranzler, H. R., Farrer, L. A., Gelernter, J. E., & Li, D. (2015) · American Journal of Medical Genetics Part B Neuropsychiatric Genetics · doi:10.1002/ajmg.b.32316 · Cited by 11
IRIS COLOUR CLASSIFICATION SCALES--THEN AND NOW.
Grigore, M., & Avram, A. M. (2015) · PubMed Central · Cited by 11
Xie, Z., Zhang, T., Kim, S., Lu, J., Zhang, W., Lin, C., Wu, M.-R., Davis, A. E., Channa, R., Giancardo, L., et al. (2022) · medRxiv · doi:10.1101/2022.05.26.22275626 · Cited by 11
Genetics of Skin, Hair, and Eye Color in Human Pigmentation Disorders
Manga, P., & Loftus, S. K. (2025) · Annals of Human Genetics · doi:10.1111/ahg.70003 · Cited by 10
A genetic and linguistic analysis of the admixture histories of the islands of Cabo Verde
Laurent, R., Szpiech, Z. A., da Costa, S. S., Thouzeau, V., Fortes‐Lima, C., Dessarps-Freichey, F., Lemée, L., Utge, J., Rosenberg, N. A., Baptista, M., et al. (2023) · eLife · doi:10.7554/elife.79827 · Cited by 14
Shan, M., Meyer, O., Refn, M., Morling, N., Andersen, J. D., & Børsting, C. (2021) · Genes · doi:10.3390/genes12050733 · Cited by 9
A Population Genetic Signature of Polygenic Local AdaptationPreprint
Berg, J. J., & Coop, G. (2013) · bioRxiv (Cold Spring Harbor Laboratory) · doi:10.1101/000026 · Cited by 9
Putilov, A. A., Dorokhov, V. B., & Poluektov, M. G. (2018) · Chronobiology International · doi:10.1080/07420528.2017.1417314 · Cited by 8
Metadata
- Authors
- Beleza, S., Johnson, N. A., Candille, S. I., Absher, D. M., Coram, M. A., Lopes, J., Campos, J., Araújo, I. I., Anderson, T. M., Vilhjálmsson, B. J., Nordborg, M., Correia e Silva, A., Shriver, M. D., Rocha, J., Barsh, G. S., & Tang, H.
- Affiliations
- Universidade do Porto (PT)
- Stanford University (US)
- Stanford Medicine (US)
- HudsonAlpha Institute for Biotechnology (US)
- University of Cape Verde (CV)
- Gregor Mendel Institute of Molecular Plant Biology (AT)
- Pennsylvania State University (US)
- Corresponding author
- Beleza, Sandra
- Barsh, Gregory S.
- ORCID
- Venue
- PLoS Genetics
- Publisher
- Public Library of Science (PLoS)
- Published
- 2013-03-21
- Volume
- 9
- Issue
- 3
- Pages
- e1003372
- ISSN
- 1553-7390 (ISSN-L)
- 1553-7404
- PMC
- PMC3605137
- OpenAlex
- W2129233990
- Cited by
- 161
- References
- 55
- Citations by year
- 2026: 6 · 2025: 7 · 2024: 8 · 2023: 10 · 2022: 12 · 2021: 20 · 2020: 11 · 2019: 9 · 2018: 13 · 2017: 20 · 2016: 11 · 2015: 15 · 2014: 12 · 2013: 7
- FWCI
- 8.70
- Type
- journal article
- Language
- en
- Open access
- gold
- doi.org
- Locations
- PLoS Genetics (publishedVersion, cc-by)
- Europe PMC (PubMed Central) (publishedVersion, cc-by)
- PubMed Central (publishedVersion, cc-by)
- PubMed (publishedVersion)
- DOAJ (DOAJ: Directory of Open Access Journals) (submittedVersion, cc-by-sa)
- Figshare (submittedVersion, cc-by)
- Funders
- Fundação para a Ciência e a Tecnologia
- National Human Genome Research Institute (T32HG000044)
- National Institute of General Medical Sciences (GM073059, T32GM007790, R01GM073059)
- Topics
- Life Sciences › Biochemistry, Genetics and Molecular Biology › Cell Biology › melanin and skin pigmentation
- Life Sciences › Biochemistry, Genetics and Molecular Biology › Genetics › Forensic and Genetic Research
- Life Sciences › Biochemistry, Genetics and Molecular Biology › Genetics › Genetic Associations and Epidemiology
- Keywords
- skin color, eye color, admixed populations, Cape Verde, SLC24A5, OCA2, HERC2, TYR, SLC45A2, genetic ancestry, heritability
- MeSH terms
- Eye Color, Genotype, Hair Color, Haplotypes, Humans, Skin Pigmentation, Albinism, Oculocutaneous, Polymorphism, Single Nucleotide, Black People, White People, Cabo Verde
About these checks
Registry, retraction, Cites and statistics results are computed, not judged, with one exception: a printed reference that no index lists is read once by a model before it counts as a citation error. Claims are extracted by a model and kept only when their quote appears verbatim in the text; each cited source is then checked, with a model’s help, for whether it says what the claim relies on. Those verdicts can be wrong — read the claim’s quote and the cited source before relying on one.
A language model drew the claims from the paper on 2026-10-10, under version 3 of the claim definition (model deepseek-v4.1-flash, prompt extract-v3).
A second model labelled each claim on 2026-10-10 (model jev-1.13-20260917, definition revision gold-guideline-v0.2).
Cited sources are checked with a language model’s help (gpt-6-sol).
Statistics and arithmetic are recomputed, not judged.
Confidence bands are shown only for fields calibrated on our annotated test set. None is calibrated yet, so no band is shown.
What counts as a claim ›How we measure confidence ›How we check this ›
Are you an author, or do you see a problem with this page? Request a review
