

The DOI matches its Crossref record; 90 of the 90 references it cites were found in a registry or an index.
Molecular Networks of Human Muscle Adaptation to Exercise and Age
Open accessAbstract
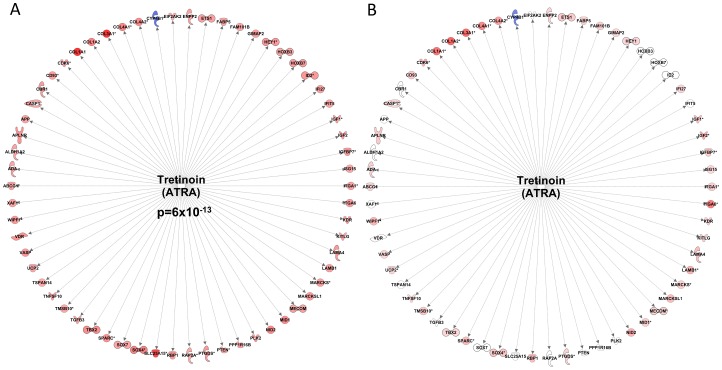
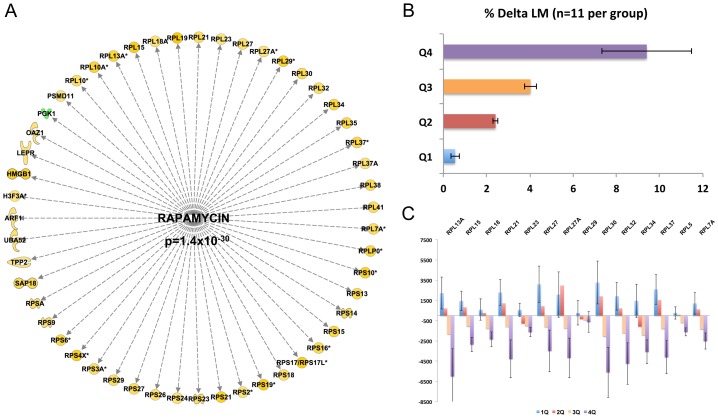
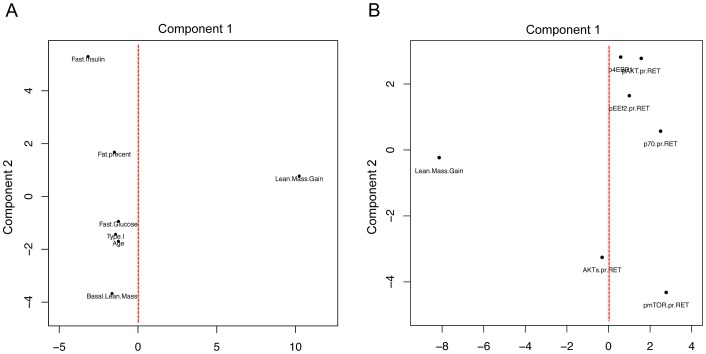
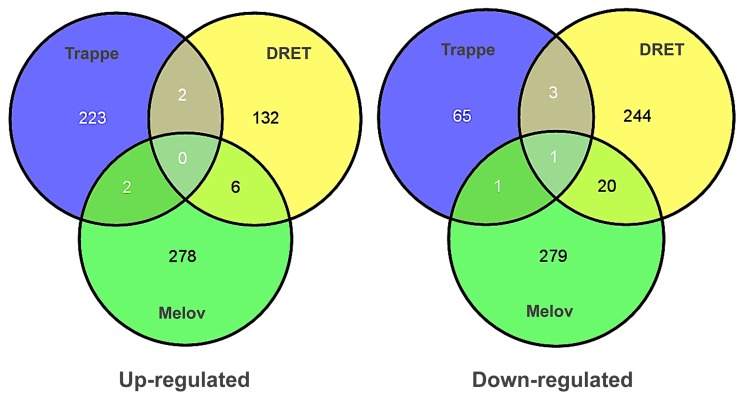
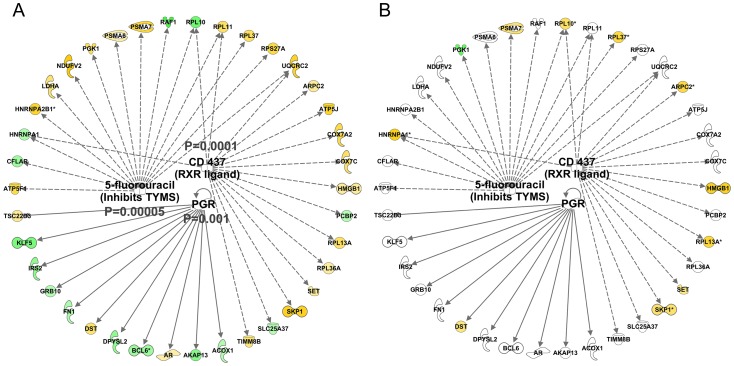
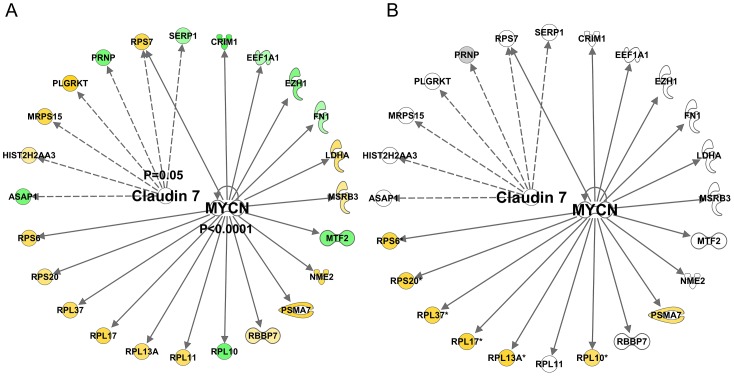
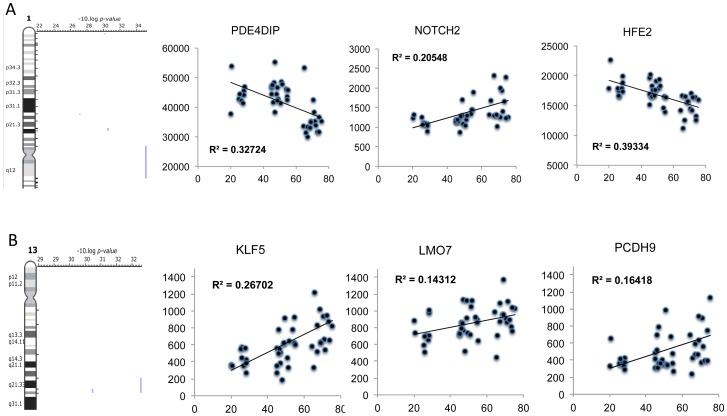
Physical activity and molecular ageing presumably interact to precipitate musculoskeletal decline in humans with age. Herein, we have delineated molecular networks for these two major components of sarcopenic risk using multiple independent clinical cohorts. We generated genome-wide transcript profiles from individuals (n = 44) who then undertook 20 weeks of supervised resistance-exercise training (RET). Expectedly, our subjects exhibited a marked range of hypertrophic responses (3% to +28%), and when applying Ingenuity Pathway Analysis (IPA) up-stream analysis to ~580 genes that co-varied with gain in lean mass, we identified rapamycin (mTOR) signaling associating with growth (P = 1.4 × 10(-30)). Paradoxically, those displaying most hypertrophy exhibited an inhibited mTOR activation signature, including the striking down-regulation of 70 rRNAs. Differential analysis found networks mimicking developmental processes (activated all-trans-retinoic acid (ATRA, Z-score = 4.5; P = 6 × 10(-13)) and inhibited aryl-hydrocarbon receptor signaling (AhR, Z-score = -2.3; P = 3 × 10(-7))) with RET. Intriguingly, as ATRA and AhR gene-sets were also a feature of endurance exercise training (EET), they appear to represent "generic" physical activity responsive gene-networks. For age, we found that differential gene-expression methods do not produce consistent molecular differences between young versus old individuals. Instead, utilizing two independent cohorts (n = 45 and n = 52), with a continuum of subject ages (18-78 y), the first reproducible set of age-related transcripts in human muscle was identified. This analysis identified ~500 genes highly enriched in post-transcriptional processes (P = 1 × 10(-6)) and with negligible links to the aforementioned generic exercise regulated gene-sets and some overlap with ribosomal genes. The RNA signatures from multiple compounds all targeting serotonin, DNA topoisomerase antagonism, and RXR activation were significantly related to the muscle age-related genes. Finally, a number of specific chromosomal loci, including 1q12 and 13q21, contributed by more than chance to the age-related gene list (P = 0.01-0.005), implying possible epigenetic events. We conclude that human muscle age-related molecular processes appear distinct from the processes regulated by those of physical activity.
Overview
The claims and statistics of this paper haven’t been checked yet.
Run the check — free, no account needed. It reads the open-access text and checks the sources it cites.
Integrity signals
Registry
Cites
Statistics
Figures
Verification
Claims the paper makes
The claims and statistics of this paper haven’t been checked yet.
Run the check — free, no account needed. It reads the open-access text and checks the sources it cites.
Claims other papers make about this one
Each is checked against this paper’s own text: does it say what the citing paper says it does?
The cited source says what the claim attributes to it.
In the citing paper
“The characterisation of individual responses is not a new phenomenon, but the results of studies of individuals undertaking resistance and endurance training in isolation suggest that 'low responders' to each exercise stimulus may be as high as 25% (Timmons et al., 2005;Phillips et al., 2013;Gurd et al., 2016).”
From Concurrent exercise training: do opposites distract? (2017) · cites this paper as Phillips et al., 2013
Self-check
Percentages, sums and reported differences re-computed from the paper’s own numbers.
The self-check needs the paper’s full text.
Citations
Cites
In silico prediction of protein-protein interactions in human macrophages
Souiai, O., Guerfali, F. Z., Miled, S. B., Brun, C., & Benkahla, A. (2014) · BMC Research Notes · doi:10.1186/1756-0500-7-157 · Cited by 10,785
Significance analysis of microarrays applied to the ionizing radiation response
Tusher, V. G., Tibshirani, R., & Chu, G. (2001) · Proceedings of the National Academy of Sciences · doi:10.1073/pnas.091062498 · Cited by 10,568
Lamb, J., Crawford, E. D., Peck, D., Modell, J. W., Blat, I. C., Wrobel, M. J., Lerner, J., Brunet, J.-P., Subramanian, A., Ross, K. N., et al. (2006) · Science · doi:10.1126/science.1132939 · Cited by 5,257
Network pharmacology: the next paradigm in drug discovery
Hopkins, A. L. (2008) · Nature Chemical Biology · doi:10.1038/nchembio.118 · Cited by 4,622
Janssen, I., Heymsfield, S. B., & Ross, R. (2002) · Journal of the American Geriatrics Society · doi:10.1046/j.1532-5415.2002.50216.x · Cited by 3,139 · cited 1×
“As the number of people living beyond their eighth decade rises, it is expected that skeletal muscle atrophy and dysfunction (sarcopenia and dynapenia respectively) will become an increasing public health challenge [73].”
BackgroundKenyon, C. J. (2010) · Nature · doi:10.1038/nature08980 · Cited by 2,739
Rommel, C., Bodine, S. C., Clarke, B. A., Rossman, R., Nunez, L., Stitt, T. N., Yancopoulos, G. D., & Glass, D. J. (2001) · Nature Cell Biology · doi:10.1038/ncb1101-1009 · Cited by 1,583
Navigating chemical space for biology and medicine
Lipinski, C. A., & Hopkins, A. L. (2004) · Nature · doi:10.1038/nature03193 · Cited by 1,028
Appendicular skeletal muscle mass: effects of age, gender, and ethnicity
Gallagher, D., Visser, M., De Meersman, R. E., Sepúlveda, D., Baumgartner, R. N., Pierson, R. N., Harris, T., & Heymsfield, S. B. (1997) · Journal of Applied Physiology · doi:10.1152/jappl.1997.83.1.229 · Cited by 966
Kumar, V., Selby, A., Rankin, D., Patel, R., Atherton, P., Hildebrandt, W., Williams, J., Smith, K., Seynnes, O., Hiscock, N., et al. (2009) · The Journal of Physiology · doi:10.1113/jphysiol.2008.164483 · Cited by 740 · cited 1×
“Many exogenous factors may influence RET-induced hypertrophy including manipulation of exercise volume [7], intensity [8] and adequate macronutrient availability [9] all of which interact with an individual’s genotype to determine muscle growth.”
BackgroundSelf-citationBaar, K., & Esser, K. (1999) · American Journal of Physiology-Cell Physiology · doi:10.1152/ajpcell.1999.276.1.c120 · Cited by 726
Are animal models predictive for humans?
Shanks, N., Greek, R., & Greek, J. (2009) · Philosophy, Ethics, and Humanities in Medicine · doi:10.1186/1747-5341-4-2 · Cited by 677
Resistance exercise load does not determine training-mediated hypertrophic gains in young men
Mitchell, C. J., Churchward-Venne, T. A., West, D. W. D., Burd, N. A., Breen, L., Baker, S. K., & Phillips, S. M. (2012) · Journal of Applied Physiology · doi:10.1152/japplphysiol.00307.2012 · Cited by 627
Dioxin receptor is a ligand-dependent E3 ubiquitin ligase
Ohtake, F., Baba, A., Takada, I., Okada, M., Iwasaki, K., Miki, H., Takahashi, S., Kouzmenko, A., Nohara, K., Chiba, T., et al. (2007) · Nature · doi:10.1038/nature05683 · Cited by 585
Greenhaff, P. L., Karagounis, L. G., Peirce, N., Simpson, E. J., Hazell, M., Layfield, R., Wackerhage, H., Smith, K., Atherton, P., Selby, A., et al. (2008) · American Journal of Physiology-Endocrinology and Metabolism · doi:10.1152/ajpendo.90411.2008 · Cited by 495
Self-citationAtherton, P. J., Babraj, J. A., Smith, K., Singh, J., Rennie, M. J., & Wackerhage, H. (2005) · The FASEB Journal · doi:10.1096/fj.04-2179fje · Cited by 475 · cited 1×
“[37].”
Self-citationAnalysis of global mRNA expression in human skeletal muscle during recovery from endurance exercise
Mahoney, D. J., Parise, G., Melov, S., Safdar, A., & Tarnopolsky, M. A. (2005) · The FASEB Journal · doi:10.1096/fj.04-3149fje · Cited by 429
Glover, E. I., Phillips, S. M., Oates, B. R., Tang, J. E., Tarnopolsky, M. A., Selby, A., Smith, K., & Rennie, M. J. (2008) · The Journal of Physiology · doi:10.1113/jphysiol.2008.160333 · Cited by 414
Self-citationAtherton, P. J., Etheridge, T., Watt, P. W., Wilkinson, D., Selby, A., Rankin, D., Smith, K., & Rennie, M. J. (2010) · The American Journal of Clinical Nutrition · doi:10.3945/ajcn.2010.29819 · Cited by 404
Self-citationMuscle protein synthesis in response to nutrition and exercise
Atherton, P. J., & Smith, K. (2012) · The Journal of Physiology · doi:10.1113/jphysiol.2011.225003 · Cited by 401
Self-citationIs irisin a human exercise gene?
Timmons, J. A., Baar, K., Davidsen, P. K., & Atherton, P. J. (2012) · Nature · doi:10.1038/nature11364 · Cited by 393
Self-citationDavidsen, P. K., Gallagher, I. J., Hartman, J. W., Tarnopolsky, M. A., Dela, F., Helge, J. W., Timmons, J. A., & Phillips, S. M. (2011) · Journal of Applied Physiology · doi:10.1152/japplphysiol.00901.2010 · Cited by 385
Self-citationMcCall, G. E., Byrnes, W. C., Dickinson, A., Pattany, P. M., & Fleck, S. J. (1996) · Journal of Applied Physiology · doi:10.1152/jappl.1996.81.5.2004 · Cited by 383
Gustafsson, T. P., Puntschart, A., Kaijser, L., Jansson, E., & Sundberg, C. J. (1999) · American Journal of Physiology-Heart and Circulatory Physiology · doi:10.1152/ajpheart.1999.276.2.h679 · Cited by 364
Self-citationGene expression profile of aging in human muscle
Welle, S. L., Brooks, A. I., Delehanty, J. M., Needler, N. A., & Thornton, C. A. (2003) · Physiological Genomics · doi:10.1152/physiolgenomics.00049.2003 · Cited by 364
Resistance Exercise Reverses Aging in Human Skeletal Muscle
Melov, S., Tarnopolsky, M. A., Beckman, K. B., Felkey, K., & Hubbard, A. (2007) · PLoS ONE · doi:10.1371/journal.pone.0000465 · Cited by 360
Timmons, J. A., Knudsen, S., Rankinen, T., Koch, L. G., Sarzynski, M., Jensen, T., Keller, P., Scheele, C., Vollaard, N. B. J., Nielsen, S., et al. (2010) · Journal of Applied Physiology · doi:10.1152/japplphysiol.01295.2009 · Cited by 358
Self-citationEffects of Exercise Training on Glucose Homeostasis
Boulé, N. G., Weisnagel, S. J., Lakka, T. A., Tremblay, A., Bergman, R. N., Rankinen, T., Leon, A. S., Skinner, J. S., Wilmore, J. H., Rao, D. C., et al. (2005) · Diabetes Care · doi:10.2337/diacare.28.1.108 · Cited by 356
Self-citationAging impairs contraction-induced human skeletal muscle mtorc1 signaling and protein synthesis
Fry, C. S., Drummond, M. J., Glynn, E. L., Dickinson, J. M., Gundermann, D. M., Timmerman, K. L., Walker, D. K., Dhanani, S., Volpi, E., & Rasmussen, B. B. (2011) · Skeletal Muscle · doi:10.1186/2044-5040-1-11 · Cited by 351
The HERITAGE family study. Aims, design, and measurement protocol.
Bouchard, C., Leon, A. S., Rao, D. C., Skinner, J. S., Wilmore, J. H., & Gagnon, J. (1995) · PubMed · Cited by 331
Self-citationThe role of skeletal muscle mTOR in the regulation of mechanical load‐induced growth
Goodman, C. A., Frey, J. W., Mabrey, D. M., Jacobs, B. L., Lincoln, H. C., You, J., & Hornberger, T. A. (2011) · The Journal of Physiology · doi:10.1113/jphysiol.2011.218255 · Cited by 297
Gallagher, I. J., Schéele, C., Keller, P., Nielsen, A. R., Reményi, J., Fischer, C. P., Roder, K., Babraj, J., Wahlestedt, C., Hutvágner, G., et al. (2010) · Genome Medicine · doi:10.1186/gm130 · Cited by 293
Self-citationWest, D. W. D., Kujbida, G. W., Moore, D. R., Atherton, P., Burd, N. A., Padzik, J. P., De Lisio, M., Tang, J. E., Parise, G., Rennie, M. J., et al. (2009) · The Journal of Physiology · doi:10.1113/jphysiol.2009.177220 · Cited by 289
Self-citationDickinson, J. M., Fry, C. S., Drummond, M. J., Gundermann, D. M., Walker, D. K., Glynn, E. L., Timmerman, K. L., Dhanani, S., Volpi, E., & Rasmussen, B. B. (2011) · The Journal of Nutrition · doi:10.3945/jn.111.139485 · Cited by 282
Physiological activation of hypoxia inducible factor‐1 in human skeletal muscle
Ameln, H., Gustafsson, T., Sundberg, C. J., Okamoto, K., Jansson, E., Poellinger, L., & Makino, Y. (2005) · The FASEB Journal · doi:10.1096/fj.04-2304fje · Cited by 276
Self-citationAims, design, and measurement protocol
BOUCHARD, C., LEON, A. S., RAO, D. C., SKINNER, J. S., WlLMORE, J. H., & GAGNON, J. (1995) · Medicine & Science in Sports & Exercise · doi:10.1249/00005768-199505000-00015 · Cited by 271
Self-citationIdentification of a molecular signature of sarcopenia
Giresi, P. G., Stevenson, E. J., Theilhaber, J., Koncarevic, A., Parkington, J. D., Fielding, R. A., & Kandarian, S. C. (2005) · Physiological Genomics · doi:10.1152/physiolgenomics.00249.2004 · Cited by 265
West, D. W., Burd, N. A., Coffey, V. G., Baker, S. K., Burke, L. M., Hawley, J. A., Moore, D. R., Stellingwerff, T., & Phillips, S. M. (2011) · The American Journal of Clinical Nutrition · doi:10.3945/ajcn.111.013722 · Cited by 264
Raue, U., Trappe, T. A., Estrem, S. T., Qian, H.-R., Helvering, L. M., Smith, R. C., & Trappe, S. W. (2012) · Journal of Applied Physiology · doi:10.1152/japplphysiol.00435.2011 · Cited by 262
A transcriptional map of the impact of endurance exercise training on skeletal muscle phenotype
Keller, P., Vollaard, N. B. J., Gustafsson, T., Gallagher, I. J., Sundberg, C. J., Rankinen, T., Britton, S. L., Bouchard, C., Koch, L. G., & Timmons, J. A. (2011) · Journal of Applied Physiology · doi:10.1152/japplphysiol.00634.2010 · Cited by 261
Self-citationSpangenburg, E. E., Roith, D. L., Ward, C. W., & Bodine, S. C. (2007) · The Journal of Physiology · doi:10.1113/jphysiol.2007.141507 · Cited by 259
Terzis, G., Georgiadis, G., Stratakos, G., Vogiatzis, I., Kavouras, S., Manta, P., Mascher, H., & Blomstrand, E. (2007) · European Journal of Applied Physiology · doi:10.1007/s00421-007-0564-y · Cited by 242 · cited 1×
“There are however conflicting data regarding the importance of mTOR regulation (protein phosphorylation or target gene mRNA responses) or its up-stream regulators, and acute anabolic or chronic growth responses to resistance exercise [12–17] reported from the same laboratories, indicating that important biological rat…”
BackgroundIGF-II is regulated by microRNA-125b in skeletal myogenesis
Ge, Y., Sun, Y., & Chen, J. (2011) · The Journal of Cell Biology · doi:10.1083/jcb.201007165 · Cited by 242
Genomics and Genetics in the Biology of Adaptation to Exercise
Bouchard, C., Rankinen, T., & Timmons, J. A. (2011) · Comprehensive physiology · doi:10.1002/cphy.c100059 · Cited by 222
Self-citationBamman, M. M., Petrella, J. K., Kim, J.-S., Mayhew, D. L., & Cross, J. M. (2007) · Journal of Applied Physiology · doi:10.1152/japplphysiol.00024.2007 · Cited by 216
Mayhew, D. L., Kim, J.-S., Cross, J. M., Ferrando, A. A., & Bamman, M. M. (2009) · Journal of Applied Physiology · doi:10.1152/japplphysiol.91234.2008 · Cited by 215
Skeletal muscle gene expression profiles in 20–29 year old and 65–71 year old women
Welle, S., Brooks, A. I., Delehanty, J. M., Needler, N., Bhatt, K., Shah, B., & Thornton, C. A. (2004) · Experimental Gerontology · doi:10.1016/j.exger.2003.11.011 · Cited by 210 · cited 4×
“This has not been attempted before because previous studies did not have a sufficiently wide and continuous range of ages to generate such data [23,24,26,39].”
BackgroundMethodResultInfluentialVollaard, N. B. J., Constantin-Teodosiu, D., Fredriksson, K., Rooyackers, O., Jansson, E., Greenhaff, P. L., Timmons, J. A., & Sundberg, C. J. (2009) · Journal of Applied Physiology · doi:10.1152/japplphysiol.91453.2008 · Cited by 205
Self-citationVariability in training-induced skeletal muscle adaptation
Timmons, J. A. (2010) · Journal of Applied Physiology · doi:10.1152/japplphysiol.00934.2010 · Cited by 205
Self-citationMyc proteins as therapeutic targets
Gustafson, W. C., & Weiss, W. A. (2010) · Oncogene · doi:10.1038/onc.2009.512 · Cited by 204
Churchward-Venne, T. A., Burd, N. A., & Phillips, S. M. (2012) · Nutrition & Metabolism · doi:10.1186/1743-7075-9-40 · Cited by 186
Stephens, N. A., Gallagher, I. J., Rooyackers, O., Skipworth, R. J. E., Tan, B. H., Marstrand, T. T., Ross, J. A., Guttridge, D. C., Lundell, L., Fearon, K. C. H., et al. (2010) · Genome Medicine · doi:10.1186/gm122 · Cited by 174
Self-citationFredriksson, K., Tjäder, I., Keller, P., Petrovič, N., Ahlman, B. H. J., Schéele, C., Wernerman, J., Timmons, J. A., & Rooyackers, O. (2008) · PLoS ONE · doi:10.1371/journal.pone.0003686 · Cited by 168
Self-citationAbdelrahim, M., Smith, R., & Safe, S. H. (2003) · Molecular Pharmacology · doi:10.1124/mol.63.6.1373 · Cited by 164
McKay, B. R., O'Reilly, C. E., Phillips, S. M., Tarnopolsky, M. A., & Parise, G. (2008) · The Journal of Physiology · doi:10.1113/jphysiol.2008.160176 · Cited by 163
Early Time Course of Akt Phosphorylation after Endurance and Resistance Exercise
CAMERA, D. M., EDGE, J., SHORT, M. J., HAWLEY, J. A., & COFFEY, V. G. (2010) · Medicine & Science in Sports & Exercise · doi:10.1249/mss.0b013e3181d964e4 · Cited by 154
Timmons, J. A., Jansson, E., Fischer, H., Gustafsson, T., Greenhaff, P. L., Ridden, J., Rachman, J., & Sundberg, C. J. (2005) · BMC Biology · doi:10.1186/1741-7007-3-19 · Cited by 135
Self-citationEffects of 3 days unloading on molecular regulators of muscle size in humans
Gustafsson, T. P., Österlund, T., Flanagan, J. N., von Walden, F., Trappe, T. A., Linnehan, R. M., & Tesch, P. A. (2010) · Journal of Applied Physiology · doi:10.1152/japplphysiol.00110.2009 · Cited by 135
Self-citationHolm, L., van Hall, G., Rose, A. J., Miller, B. F., Doessing, S., Richter, E. A., & Kjaer, M. (2010) · American Journal of Physiology-Endocrinology and Metabolism · doi:10.1152/ajpendo.00609.2009 · Cited by 132
Moore, D. R., Atherton, P. J., Rennie, M. J., Tarnopolsky, M. A., & Phillips, S. M. (2010) · Acta Physiologica · doi:10.1111/j.1748-1716.2010.02187.x · Cited by 122
Self-citationGoodman, C. A., Miu, M. H., Frey, J. W., Mabrey, D. M., Lincoln, H. C., Ge, Y., Chen, J., & Hornberger, T. A. (2010) · Molecular Biology of the Cell · doi:10.1091/mbc.e10-05-0454 · Cited by 121
Saito, A. M., Sugawara, A., Uruno, A., Kudo, M., Kagechika, H., Sato, Y., Owada, Y., Kondo, H., Sato, M., Kurabayashi, M., et al. (2006) · Endocrinology · doi:10.1210/en.2006-0900 · Cited by 120
Kadi, F., & Ponsot, E. (2009) · Scandinavian Journal of Medicine and Science in Sports · doi:10.1111/j.1600-0838.2009.00966.x · Cited by 118
Bell, R. N., Hubbard, A., Chettier, R., Chen, D., Miller, J. P., Kapahi, P., Tarnopolsky, M. A., Sahasrabuhde, S., Melov, S., & Hughes, R. E. (2009) · PLoS Genetics · doi:10.1371/journal.pgen.1000414 · Cited by 115
Axel, D. I. (2001) · Cardiovascular Research · doi:10.1016/s0008-6363(00)00312-6 · Cited by 113
The role of homeobox genes in vascular remodeling and angiogenesis
Gorski, D. H., & Walsh, K. (2000) · Circulation Research · doi:10.1161/01.res.87.10.865 · Cited by 110
Drummond, M. J., Miyazaki, M., Dreyer, H. C., Pennings, B., Dhanani, S., Volpi, E., Esser, K. A., & Rasmussen, B. B. (2008) · Journal of Applied Physiology · doi:10.1152/japplphysiol.90842.2008 · Cited by 100
von Walden, F., Figueiredo, V. C., Farrants, A. Ö., & Nader, G. A. (2012) · American Journal of Physiology-Cell Physiology · doi:10.1152/ajpcell.00460.2011 · Cited by 96
Iadevaia, V., Huo, Y., Zhang, Z., Foster, L. J., & Proud, C. G. (2012) · Biochemical Society Transactions · doi:10.1042/bst20110682 · Cited by 93
Gallagher, I. J., Stephens, N. A., MacDonald, A. J., Skipworth, R. J. E., Husi, H., Greig, C. A., Ross, J. A., Timmons, J. A., & Fearon, K. C. H. (2012) · Clinical Cancer Research · doi:10.1158/1078-0432.ccr-11-2133 · Cited by 93
Self-citationFarnfield, M. M., Breen, L., Carey, K. A., Garnham, A., & Cameron-Smith, D. (2012) · Applied Physiology, Nutrition, and Metabolism · doi:10.1139/h11-132 · Cited by 89
Retinoic acid induces adult muscle cell differentiation mediated by the retinoic acid receptor‐α
Halevy, O., & Lerman, O. (1993) · Journal of Cellular Physiology · doi:10.1002/jcp.1041540315 · Cited by 84
Bunaciu, R. P., & Yen, A. (2011) · Cancer Research · doi:10.1158/0008-5472.can-10-2299 · Cited by 84
Timmons, J. A., Norrbom, J., Schéele, C., Thonberg, H., Wahlestedt, C., & Tesch, P. (2006) · Genomics · doi:10.1016/j.ygeno.2005.09.007 · Cited by 79
Self-citationThe Intersection Between the Aryl Hydrocarbon Receptor (AhR)‐ and Retinoic Acid‐Signaling Pathways
Murphy, K. A., Quadro, L., & White, L. A. (2007) · Vitamins and hormones · doi:10.1016/s0083-6729(06)75002-6 · Cited by 74
Dedeić, Z., Cetera, M., Cohen, T. V., & Holaska, J. M. (2011) · Journal of Cell Science · doi:10.1242/jcs.080259 · Cited by 72
Kim, H. W., Ha, S. H., Lee, M. N., Huston, E., Kim, D., Jang, S. K., Suh, P., Houslay, M. D., & Ryu, S. H. (2010) · Molecular and Cellular Biology · doi:10.1128/mcb.00217-10 · Cited by 67
Andreasen, E. A., Mathew, L. K., Löhr, C. V., Hasson, R., & Tanguay, R. L. (2006) · Toxicological Sciences · doi:10.1093/toxsci/kfl119 · Cited by 66
Phillips, B. E., Williams, J. P., Atherton, P. J., Smith, K., Hildebrandt, W., Rankin, D., Greenhaff, P. L., Macdonald, I. A., & Rennie, M. J. (2011) · Journal of Applied Physiology · doi:10.1152/japplphysiol.01031.2011 · Cited by 65
Self-citationReduced AMPK-ACC and mTOR signaling in muscle from older men, and effect of resistance exercise
Li, M., Verdijk, L. B., Sakamoto, K., Ely, B. A., van Loon, L. J. C., & Musi, N. (2012) · Mechanisms of Ageing and Development · doi:10.1016/j.mad.2012.09.001 · Cited by 64
Preter, K. D., Barriot, R., Speleman, F., Vandesompele, J., & Moreau, Y. (2008) · Nucleic Acids Research · doi:10.1093/nar/gkn114 · Cited by 63
Moore, D. R., Bel, N. C. D., Nizi, K. I., Hartman, J. W., Tang, J. E., Armstrong, D., & Phillips, S. M. (2007) · Journal of Nutrition · doi:10.1093/jn/137.4.985 · Cited by 63
Muscle satellite cell and atypical myogenic progenitor response following exercise
Parise, G., McKinnell, I. W., & Rudnicki, M. A. (2008) · Muscle & Nerve · doi:10.1002/mus.20995 · Cited by 60
Regulation of the Expression of the Prostate-specific Antigen by Claudin-7
Zheng, J., Yu, D., Foroohar, M., Ko, E., Chan, J., Kim, N., Chiu, R., & Pang, S. (2003) · The Journal of Membrane Biology · doi:10.1007/s00232-003-2038-4 · Cited by 50
Regulation of Muscle Satellite Cell Activation and Chemotaxis by Angiotensin II
Johnston, A. P. W., Baker, J. M., Bellamy, L. M., McKay, B. R., Lisio, M. D., & Parise, G. (2010) · PLoS ONE · doi:10.1371/journal.pone.0015212 · Cited by 46
Keller, P., Vollaard, N. B. J., Babraj, J., Ball, D. R., Sewell, D. A., & Timmons, J. A. (2007) · Biochemical Society Transactions · doi:10.1042/bst0351306 · Cited by 40
Self-citationFelciano, R. M., Bavari, S., Richards, D. R., Billaud, J.-N., Warren, T. K., Panchal, R. G., & Krämer, A. (2012) · Pacific Symposium on Biocomputing (PSB) · doi:10.1142/9789814447973_0003 · Cited by 32
Kim, H., Ha, S., Lee, M., Huston, E., Kim, D., Jang, S., Suh, P., Houslay, M. D., & Ryu, S. (2010) · Research Portal (King's College London) · Cited by 9
What happens if you pose the wrong questions?
Timmons, J. A. (2011) · The Journal of Physiology · doi:10.1113/jphysiol.2011.213413 · Cited by 4
Self-citationMcCall, G. E., Byrnes, W. C., Dickinson, A., Pattany, P. M., & Fleck, S. J. (1995) · Medicine & Science in Sports & Exercise · doi:10.1249/00005768-199505001-00369 · Cited by 4
Cited by
Sorted by citations
Limb proportions show developmental plasticity in response to embryo movement
Pollard, A. S., Charlton, B., Hutchinson, J. R., Gustafsson, T. P., McGonnell, I. M., Timmons, J. A., & Pitsillides, A. A. (2017) · Scientific Reports · doi:10.1038/srep41926 · Cited by 2,377
Self-citationAdaptations to Endurance and Strength TrainingPreprint
Hughes, D. C., Ellefsen, S., & Baar, K. (2017) · Cold Spring Harbor Perspectives in Medicine · doi:10.1101/cshperspect.a029769 · Cited by 661
Transcriptomic profiling of skeletal muscle adaptations to exercise and inactivity
Pillon, N. J., Gabriel, B. M., Dollet, L., Smith, J. A. B., Sardón Puig, L., Botella, J., Bishop, D. J., Krook, A., & Zierath, J. R. (2020) · Nature Communications · doi:10.1038/s41467-019-13869-w · Cited by 457
Sarcopenia, frailty and their prevention by exercise
Nascimento, C. M., Ingles, M., Salvador-Pascual, A., Cominetti, M. R., Gomez-Cabrera, M. C., & Viña, J. (2019) · Free Radical Biology and Medicine · doi:10.1016/j.freeradbiomed.2018.08.035 · Cited by 396
Migliavacca, E., Tay, S. K. H., Patel, H. P., Sonntag, T., Civiletto, G., McFarlane, C., Forrester, T., Barton, S. J., Leow, M. K., Antoun, E., et al. (2019) · Nature Communications · doi:10.1038/s41467-019-13694-1 · Cited by 365
Metadata
- Authors
- Phillips, B. E., Williams, J. P., Gustafsson, T., Bouchard, C., Rankinen, T., Knudsen, S., Smith, K., Timmons, J. A., & Atherton, P. J.
- Affiliations
- Royal Derby Hospital (GB)
- Karolinska Institutet (SE)
- Pennington Biomedical Research Center (US)
- Medical Prognosis Institute (Denmark) (DK)
- Loughborough University (GB)
- Corresponding author
- Timmons, James A.
- ORCID
- Venue
- PLoS Genetics
- Publisher
- Public Library of Science (PLoS)
- Published
- 2013-03-21
- Volume
- 9
- Issue
- 3
- Pages
- e1003389
- ISSN
- 1553-7390 (ISSN-L)
- 1553-7404
- PMC
- PMC3605101
- OpenAlex
- W2094388228
- Cited by
- 199
- References
- 90
- Citations by year
- 2026: 6 · 2025: 6 · 2024: 14 · 2023: 13 · 2022: 18 · 2021: 22 · 2020: 13 · 2019: 17 · 2018: 17 · 2017: 9 · 2016: 16 · 2015: 23 · 2014: 18 · 2013: 6
- FWCI
- 9.41
- Type
- journal article
- Language
- en
- Update notices
- Open access
- gold
- doi.org
- Locations
- PLoS Genetics (publishedVersion, cc-by)
- Europe PMC (PubMed Central) (publishedVersion, cc-by)
- PubMed Central (publishedVersion, cc-by)
- PubMed (publishedVersion)
- Repository@Nottingham (University of Nottingham) (submittedVersion, cc-by)
- DOAJ (DOAJ: Directory of Open Access Journals) (submittedVersion, cc-by-sa)
- Nottingham ePrints (University of Nottingham) (submittedVersion)
- Figshare (submittedVersion, cc-by)
- Funders
- University of Stirling
- National Institutes of Health (HL- 47317, HL- 47327, HL- 47323)
- Directorate for Biological Sciences
- Medical Research Council (MR/K00414X/1)
- Biotechnology and Biological Sciences Research Council (BB/X5106971, BB/C516779/1)
- National Heart, Lung, and Blood Institute (R01HL047327, HL 47321, HL 45670, HL47323, R01HL047317, HL 47327, R01HL047323, HL47317, R01HL045670, R01HL047321)
- Topics
- Life Sciences › Biochemistry, Genetics and Molecular Biology › Molecular Biology › Muscle Physiology and Disorders
- Life Sciences › Biochemistry, Genetics and Molecular Biology › Genetics › Genetics and Physical Performance
- Health Sciences › Medicine › Physiology (medical) › Nutrition and Health in Aging
- Keywords
- muscle aging, resistance training, endurance training, sarcopenia, mTOR signaling, rapamycin, muscle hypertrophy, lean body mass, all-trans retinoic acid, aryl hydrocarbon receptor signaling, age-related gene expression, post-transcriptional regulation, ribosomal genes, gene regulatory networks
- MeSH terms
- Adaptation, Physiological, Adolescent, Adult, Aged, Aging, Female, Humans, Male, Middle Aged, Signal Transduction, Exercise, Down-Regulation, Muscle, Skeletal, Gene Expression Profiling, Gene Regulatory Networks, Ribosome Subunits, TOR Serine-Threonine Kinases
About these checks
Registry, retraction, Cites and statistics results are computed, not judged, with one exception: a printed reference that no index lists is read once by a model before it counts as a citation error. Claims are extracted by a model and kept only when their quote appears verbatim in the text; each cited source is then checked, with a model’s help, for whether it says what the claim relies on. Those verdicts can be wrong — read the claim’s quote and the cited source before relying on one.
Statistics and arithmetic are recomputed, not judged.
Confidence bands are shown only for fields calibrated on our annotated test set. None is calibrated yet, so no band is shown.
What counts as a claim ›How we measure confidence ›How we check this ›
Are you an author, or do you see a problem with this page? Request a review
