

The DOI matches its Crossref record; 43 of the 44 references it cites were found in a registry or an index.
Hippocampal Sharp Wave/Ripples during Sleep for Consolidation of Associative Memory
Open accessAbstract
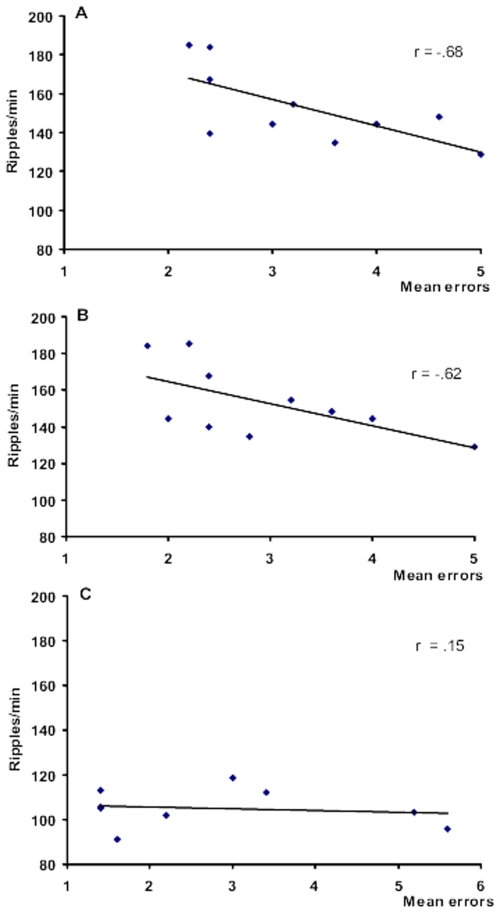
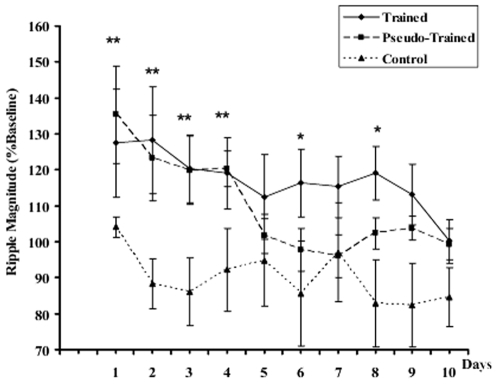
The beneficial effect of sleep on memory has been well-established by extensive research on humans, but the neurophysiological mechanisms remain a matter of speculation. This study addresses the hypothesis that the fast oscillations known as ripples recorded in the CA1 region of the hippocampus during slow wave sleep (SWS) may provide a physiological substrate for long term memory consolidation. We trained rats in a spatial discrimination task to retrieve palatable reward in three fixed locations. Hippocampal local field potentials and cortical EEG were recorded for 2 h after each daily training session. There was an increase in ripple density during SWS after early training sessions, in both trained rats and in rats randomly rewarded for exploring the maze. In rats learning the place -reward association, there was a striking further significant increase in ripple density correlated with subsequent improvements in behavioral performance as the rat learned the spatial discrimination aspect of the task. The results corroborate others showing an experience-dependent increase in ripple activity and associated ensemble replay after exploratory activity, but in addition, for the first time, reveal a clear further increase in ripple activity related to associative learning based on spatial discrimination.
Overview
The claims and statistics of this paper haven’t been checked yet.
Run the check — free, no account needed. It reads the open-access text and checks the sources it cites.
Integrity signals
Registry
Cites
Statistics
Figures
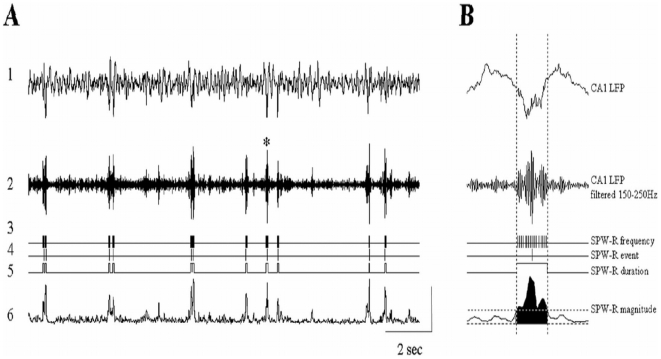
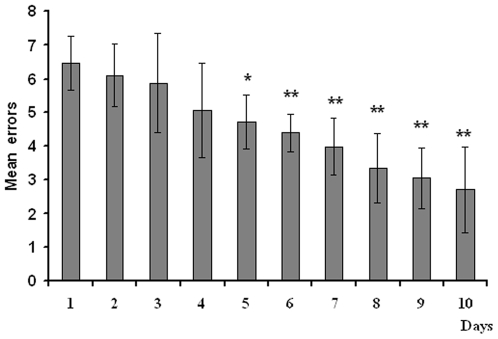
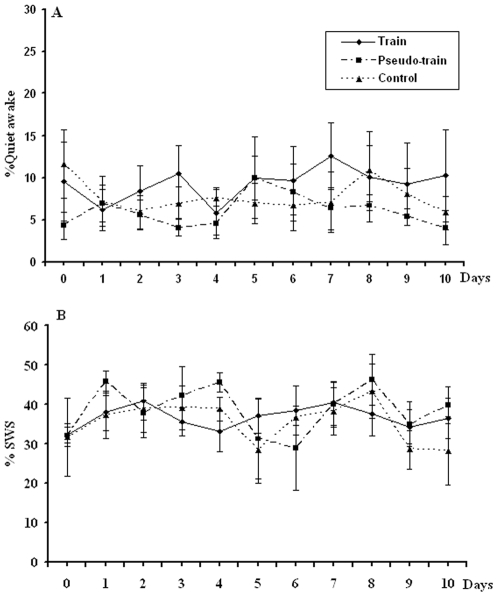
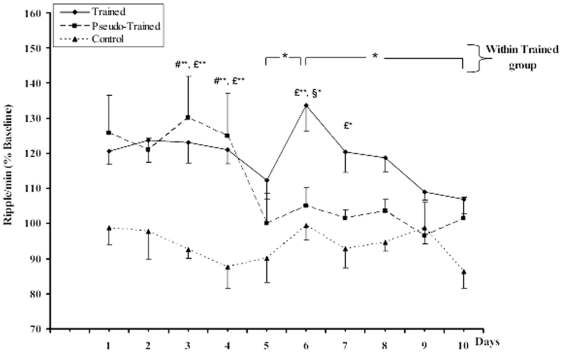
Verification
Claims the paper makes
The claims and statistics of this paper haven’t been checked yet.
Run the check — free, no account needed. It reads the open-access text and checks the sources it cites.
Claims other papers make about this one
Each is checked against this paper’s own text: does it say what the citing paper says it does?
The cited source says what the claim attributes to it.
In the citing paper
“Similarly, after a spatial learning task, increases in ripple density during postlearning sleep were significantly correlated with the formation of associative spatial memories (955).”
From About Sleep's Role in Memory (2013) · cites this paper as [955]
Self-check
Percentages, sums and reported differences re-computed from the paper’s own numbers.
The self-check needs the paper’s full text.
Citations
Cites
Predictive reward signal of dopamine neurons
Schultz, W. (1998) · Journal of Neurophysiology · doi:10.1152/jn.1998.80.1.1 · Cited by 4,564
Reactivation of hippocampal ensemble memories during sleep
Wilson, M. A., & McNaughton, B. L. (1994) · Science · doi:10.1126/science.8036517 · Cited by 3,118
Place units in the hippocampus of the freely moving rat
O'Keefe, J. (1976) · Experimental Neurology · doi:10.1016/0014-4886(76)90055-8 · Cited by 1,836
Reverse replay of behavioural sequences in hippocampal place cells during the awake state
Foster, D. J., & Wilson, M. A. (2006) · Nature · doi:10.1038/nature04587 · Cited by 1,727
Two-stage model of memory trace formation: A role for “noisy” brain states
Buzsáki, G. (1989) · Neuroscience · doi:10.1016/0306-4522(89)90423-5 · Cited by 1,709
Cellular bases of hippocampal EEG in the behaving rat
Buzsáki, G., Leung Lai-Wo, S., & Vanderwolf, C. H. (1983) · Brain Research Reviews · doi:10.1016/0165-0173(83)90037-1 · Cited by 1,397
Memory of sequential experience in the hippocampus during slow wave sleep
Lee, A. K., & Wilson, M. A. (2002) · Neuron · doi:10.1016/s0896-6273(02)01096-6 · Cited by 1,296
Forward and reverse hippocampal place-cell sequences during ripples
Diba, K., & Buzsáki, G. (2007) · Nature Neuroscience · doi:10.1038/nn1961 · Cited by 1,205
Odor cues during slow-wave sleep prompt declarative memory consolidation
Rasch, B., Büchel, C., Gais, S., & Born, J. (2007) · Science · doi:10.1126/science.1138581 · Cited by 1,181
Temporally structured replay of awake hippocampal ensemble activity during rapid eye movement sleep
Louie, K., & Wilson, M. A. (2001) · Neuron · doi:10.1016/s0896-6273(01)00186-6 · Cited by 1,148
Coordinated interactions between hippocampal Ripples and Cortical Spindles during Slow-Wave Sleep
Siapas, A. G., & Wilson, M. A. (1998) · Neuron · doi:10.1016/s0896-6273(00)80629-7 · Cited by 1,052
The Hippocampo-Neocortical Dialogue
Buzsáki, G. (1996) · Cerebral Cortex · doi:10.1093/cercor/6.2.81 · Cited by 938
Hippocampal sharp waves: Their origin and significance
Buzsáki, G. (1986) · Brain Research · doi:10.1016/0006-8993(86)91483-6 · Cited by 925
Learning-dependent increases in sleep spindle density
Gais, S., Mölle, M., Helms, K., & Born, J. (2002) · The Journal of Neuroscience · doi:10.1523/jneurosci.22-15-06830.2002 · Cited by 859
Are spatial memories strengthened in the human hippocampus during slow wave sleep?
Peigneux, P., Laureys, S., Fuchs, S., Collette, F., Perrin, F., Reggers, J., Phillips, C., Degueldre, C., Del Fiore, G., Aerts, J., et al. (2004) · Neuron · doi:10.1016/j.neuron.2004.10.007 · Cited by 766
Kudrimoti, H. S., Barnes, C. A., & McNaughton, B. L. (1999) · The Journal of Neuroscience · doi:10.1523/jneurosci.19-10-04090.1999 · Cited by 753
Time-dependent reorganization of brain circuitry underlying long-term memory storage
Bontempi, B., Laurent-Demir, C., Destrade, C., & Jaffard, R. (1999) · Nature · doi:10.1038/23270 · Cited by 673
Ensemble Patterns of Hippocampal CA3-CA1 Neurons during Sharp Wave–Associated Population Events
Csicsvari, J., Hirase, H., Mamiya, A., & Buzsáki, G. (2000) · Neuron · doi:10.1016/s0896-6273(00)00135-5 · Cited by 523
Reconsolidation of memory after its reactivation
Przybyslawski, J., & Sara, S. J. (1997) · Behavioural Brain Research · doi:10.1016/s0166-4328(96)00153-2 · Cited by 493
Self-citationSleep transforms the cerebral trace of declarative memories
Gais, S., Albouy, G., Boly, M., Dang-Vu, T. T., Darsaud, A., Desseilles, M., Rauchs, G., Schabus, M., Sterpenich, V., Vandewalle, G., et al. (2007) · Proceedings of the National Academy of Sciences · doi:10.1073/pnas.0705454104 · Cited by 412
Overnight verbal memory retention correlates with the number of sleep spindles
Clemens, Z., Fabó, D., & Halász, P. (2005) · Neuroscience · doi:10.1016/j.neuroscience.2005.01.011 · Cited by 405
tFast Network Oscillations in the Hippocampal CA1 Region of the Behaving Rat
Csicsvari, T., Hirase, H., Czurkó, A., Mamiya, A., & Buzsáki, G. (1999) · Journal of Neuroscience · doi:10.1523/jneurosci.19-16-j0001.1999 · Cited by 365
Chrobak, J. J., & Buzsáki, G. (1994) · Journal of Neuroscience · doi:10.1523/jneurosci.14-10-06160.1994 · Cited by 360
Learning‐dependent changes in sleep spindles and Stage 2 sleep
FOGEL, S. M., & SMITH, C. T. (2006) · Journal of Sleep Research · doi:10.1111/j.1365-2869.2006.00522.x · Cited by 344
Hippocampal Sharp Wave-Ripples Linked to Slow Oscillations in Rat Slow-Wave Sleep
Mölle, M., Yeshenko, O., Marshall, L., Sara, S. J., & Born, J. (2006) · Journal of Neurophysiology · doi:10.1152/jn.00014.2006 · Cited by 337
Self-citationMemory reprocessing in corticocortical and hippocampocortical neuronal ensembles
Qin, Y., McNaughton, B. L., Skaggs, W. E., & Barnes, C. A. (1997) · Philosophical Transactions of the Royal Society B Biological Sciences · doi:10.1098/rstb.1997.0139 · Cited by 328
Reactivation of experience-dependent cell assembly patterns in the hippocampus
O'Neill, J., Senior, T. J., Allen, K., Huxter, J. R., & Csicsvari, J. (2008) · Nature Neuroscience · doi:10.1038/nn2037 · Cited by 318
Wang, Z., & McCormick, D. (1993) · The Journal of Neuroscience · doi:10.1523/jneurosci.13-05-02199.1993 · Cited by 307
Skaggs, W. E., & McNaughton, B. L. (1998) · The Journal of Neuroscience · doi:10.1523/jneurosci.18-20-08455.1998 · Cited by 287
New Experiences Enhance Coordinated Neural Activity in the Hippocampus
Cheng, S., & Frank, L. M. (2008) · Neuron · doi:10.1016/j.neuron.2007.11.035 · Cited by 286
Sustained increase in hippocampal sharp-wave ripple activity during slow-wave sleep after learning
Eschenko, O., Ramadan, W., Mölle, M., Born, J., & Sara, S. J. (2008) · Learning & Memory · doi:10.1101/lm.726008 · Cited by 277
Self-citationElevated Sleep Spindle Density after Learning or after Retrieval in Rats
Eschenko, O., Mölle, M., Jan Born, A., & Sara, S. J. (2006) · Journal of Neuroscience · doi:10.1523/jneurosci.3175-06.2006 · Cited by 268
Self-citationWolansky, T., Clement, E., Peters, S. R., Palczak, M. A., & Dickson, C. T. (2006) · Journal of Neuroscience · doi:10.1523/jneurosci.5594-05.2006 · Cited by 236
Sleep after spatial learning promotes covert reorganization of brain activity
Orban, P., Rauchs, G., Balteau, E., Degueldre, C., Luxen, A., Maquet, P., & Peigneux, P. (2006) · Proceedings of the National Academy of Sciences · doi:10.1073/pnas.0510198103 · Cited by 167
Bouret, S., & Sara, S. J. (2002) · European Journal of Neuroscience · doi:10.1046/j.1460-9568.2002.02413.x · Cited by 148
Self-citationHebbian modification of a hippocampal population pattern in the rat
King, C., Henze, D. A., Leinekugel, X., & Buzsáki, G. (1999) · The Journal of Physiology · doi:10.1111/j.1469-7793.1999.00159.x · Cited by 122
Eschenko, O., & Sara, S. J. (2008) · Cerebral Cortex · doi:10.1093/cercor/bhn020 · Cited by 115
Self-citationEEG Power Densities (0.5–20 Hz) in Different Sleep–Wake Stages in Rats
Bjorvatn, B., Fagerland, S., & Ursin, R. (1998) · Physiology & Behavior · doi:10.1016/s0031-9384(97)00460-5 · Cited by 59
Suzuki, S. S., & Smith, G. K. (1985) · Experimental Neurology · doi:10.1016/0014-4886(85)90266-3 · Cited by 54
Schall, K. P., Kerber, J., & Dickson, C. T. (2007) · Journal of Neurophysiology · doi:10.1152/jn.00915.2007 · Cited by 42
Memory processing during human sleep as assessed by functional neuroimaging.
Maquet, P., Peigneux, P., Laureys, S., Boly, M., Dang‐Vu, T. T., Desseilles, M., & Cleeremans, A. (2003) · PubMed · Cited by 34
Memory and forgetting: long-term and gradual changes in memory storage.
Squire, L. R. (1994) · PubMed · Cited by 27
Off-line processing of memory traces during human sleep: Contribution of functional neuroimaging
Maquet, P., Peigneux, P., Laureys, S., Desseilles, M., Boly, M., & Dang‐Vu, T. T. (2003) · Sleep and Biological Rhythms · doi:10.1046/j.1446-9235.2003.00009.x · Cited by 2
Cited by
Sorted by citations
Rasch, B., & Born, J. (2013) · Physiological Reviews · doi:10.1152/physrev.00032.2012 · Cited by 2,783
Hippocampal sharp wave-ripple: A cognitive biomarker for episodic memory and planning
Buzsáki, G. (2015) · Hippocampus · doi:10.1002/hipo.22488 · Cited by 1,759
Rhythms of the hippocampal network
Colgin, L. L. (2016) · Nature reviews. Neuroscience · doi:10.1038/nrn.2016.21 · Cited by 654
Hippocampal-cortical interaction during periods of subcortical silence
Logothetis, N. K., Eschenko, O., Murayama, Y., Augath, M., Steudel, T., Evrard, H. C., Besserve, M., & Oeltermann, A. (2012) · Nature · doi:10.1038/nature11618 · Cited by 420
Self-citationHippocampal ripples and memory consolidation
Girardeau, G., & Zugaro, M. (2011) · Current Opinion in Neurobiology · doi:10.1016/j.conb.2011.02.005 · Cited by 330
Metadata
- Authors
- Ramadan, W., Eschenko, O., & Sara, S. J.
- Affiliations
- Centre National de la Recherche Scientifique (FR)
- Corresponding author
- Sara, Susan J.
- Venue
- PLoS ONE
- Publisher
- Public Library of Science (PLoS)
- Published
- 2009-08-20
- Volume
- 4
- Issue
- 8
- Pages
- e6697
- ISSN
- 1932-6203 (ISSN-L)
- PMC
- PMC2725314
- OpenAlex
- W2008915709
- Cited by
- 173
- References
- 44
- Citations by year
- 2026: 6 · 2025: 8 · 2024: 10 · 2023: 3 · 2022: 9 · 2021: 4 · 2020: 13 · 2019: 16 · 2018: 12 · 2017: 14 · 2016: 10 · 2015: 10 · 2014: 12 · 2013: 14 · 2012: 6
- FWCI
- 5.02
- Type
- journal article
- Language
- en
- Open access
- gold
- doi.org
- Locations
- PLoS ONE (publishedVersion, cc-by)
- PubMed Central (publishedVersion, cc-by)
- PubMed (publishedVersion)
- DOAJ (DOAJ: Directory of Open Access Journals) (submittedVersion, cc-by-sa)
- Max Planck Institute for Plasma Physics (submittedVersion)
- MPG.PuRe (Max Planck Society) (submittedVersion)
- Topics
- Life Sciences › Neuroscience › Cognitive Neuroscience › Memory and Neural Mechanisms
- Life Sciences › Neuroscience › Cognitive Neuroscience › Sleep and Wakefulness Research
- Life Sciences › Neuroscience › Cognitive Neuroscience › Neural dynamics and brain function
- Keywords
- hippocampal ripples, sharp-wave ripples, slow-wave sleep, memory consolidation, associative memory, spatial discrimination learning, sleep-dependent memory
- MeSH terms
- Animals, Behavior, Animal, Electroencephalography, Hippocampus, Male, Memory, Sleep, Rats, Sprague-Dawley, Rats
About these checks
Registry, retraction, Cites and statistics results are computed, not judged, with one exception: a printed reference that no index lists is read once by a model before it counts as a citation error. Claims are extracted by a model and kept only when their quote appears verbatim in the text; each cited source is then checked, with a model’s help, for whether it says what the claim relies on. Those verdicts can be wrong — read the claim’s quote and the cited source before relying on one.
Statistics and arithmetic are recomputed, not judged.
Confidence bands are shown only for fields calibrated on our annotated test set. None is calibrated yet, so no band is shown.
What counts as a claim ›How we measure confidence ›How we check this ›
Are you an author, or do you see a problem with this page? Request a review
