

Differentiating Embryonic Stem Cells Pass through ‘Temporal Windows’ That Mark Responsiveness to Exogenous and Paracrine Mesendoderm Inducing Signals
Open accessThe DOI matches its Crossref record; 63 of the 63 references it cites were found in a registry or an index.
Abstract
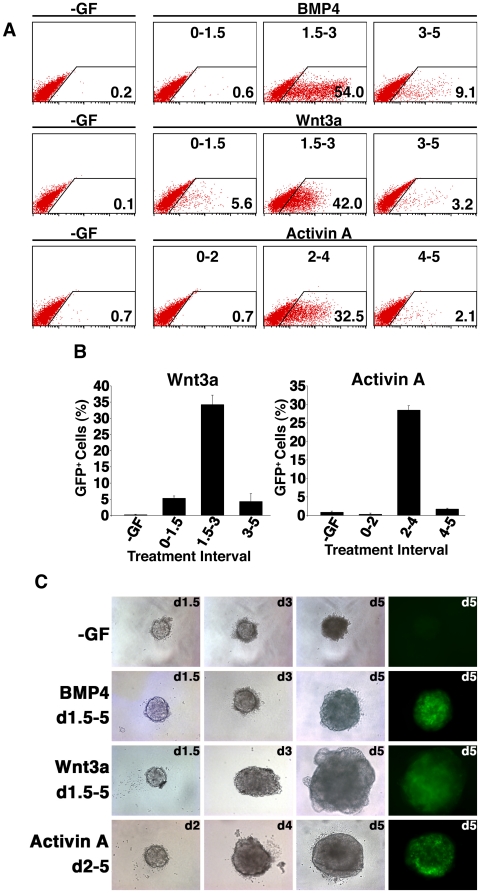
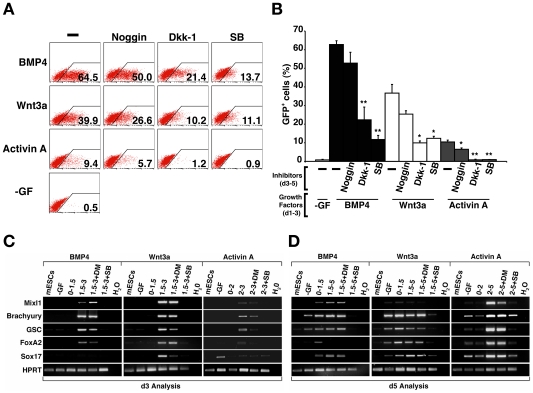
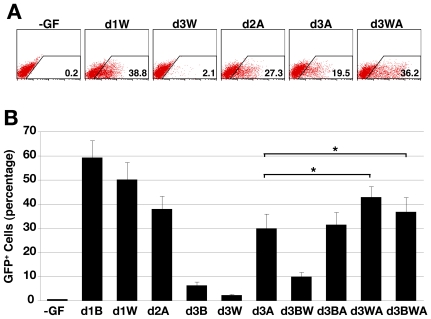
BACKGROUND: Mesendoderm induction during embryonic stem cell (ESC) differentiation in vitro is stimulated by the Transforming Growth Factor and Wingless (Wnt) families of growth factors. PRINCIPAL FINDINGS: We identified the periods during which Bone Morphogenetic Protein (BMP) 4, Wnt3a or Activin A were able to induce expression of the mesendoderm marker, Mixl1, in differentiating mouse ESCs. BMP4 and Wnt3a were required between differentiation day (d) 1.5 and 3 to most effectively induce Mixl1, whilst Activin A induced Mixl1 expression in ESC when added between d2 and d4, indicating a subtle difference in the requirement for Activin receptor signalling in this process. Stimulation of ESCs with these factors at earlier or later times resulted in little Mixl1 induction, suggesting that the differentiating ESCs passed through 'temporal windows' in which they sequentially gained and lost competence to respond to each growth factor. Inhibition of either Activin or Wnt signalling blocked Mixl1 induction by any of the three mesendoderm-inducing factors. Mixing experiments in which chimeric EBs were formed between growth factor-treated and untreated ESCs revealed that BMP, Activin and Wnt signalling all contributed to the propagation of paracrine mesendoderm inducing signals between adjacent cells. Finally, we demonstrated that the differentiating cells passed through 'exit gates' after which point they were no longer dependent on signalling from inducing molecules for Mixl1 expression. CONCLUSIONS: These studies suggest that differentiating ESCs are directed by an interconnected network of growth factors similar to those present in early embryos and that the timing of growth factor activity is critical for mesendoderm induction.
Overview
The claims and statistics of this paper haven’t been checked yet.
Free: it reads the open-access text and checks the first 5 claims that cite a source we can check. Create a free account to check every claim.
Integrity signals
Registry
Cites
Statistics
Figures




Verification
Claims the paper makes
The claims and statistics of this paper haven’t been checked yet.
Free: it reads the open-access text and checks the first 5 claims that cite a source we can check. Create a free account to check every claim.
Claims other papers make about this one
Each is checked against this paper’s own text: does it say what the citing paper says it does?
The source backs part of the claim, not all of it — or backs it for a different population, condition or comparison.
In the citing paper
“We believe enhanced differentiation at lower CHIR concentrations can be attributed to endogenous morphogen production due to the self-assembling conditions provided28–32.”
From Self-assembling human heart organoids for the modeling of cardiac development and congenital heart disease (2021) · cites this paper as [31]
Experimental — accuracy not yet measured
Self-check
Percentages, sums and reported differences re-computed from the paper’s own numbers.
The self-check needs the paper’s full text.
Citations
Cites
Takahashi, K., & Yamanaka, S. (2006) · Cell · doi:10.1016/j.cell.2006.07.024 · Cited by 26,673
Embryonic Stem Cell Lines Derived from Human Blastocysts
Thomson, J. A., Itskovitz-Eldor, J., Shapiro, S. S., Waknitz, M. A., Swiergiel, J. J., Marshall, V. S., & Jones, J. M. (1998) · Science · doi:10.1126/science.282.5391.1145 · Cited by 15,926
Establishment in culture of pluripotential cells from mouse embryos
Evans, M. J., & Kaufman, M. H. (1981) · Nature · doi:10.1038/292154a0 · Cited by 8,607
Martin, G. R. (1981) · Proceedings of the National Academy of Sciences · doi:10.1073/pnas.78.12.7634 · Cited by 5,746
Embryonic stem cell lines from human blastocysts: somatic differentiation in vitro
Reubinoff, B. E., Pera, M. F., Fong, C.-Y., Trounson, A., & Bongso, A. (2000) · Nature Biotechnology · doi:10.1038/74447 · Cited by 2,706
Derivation of pluripotent epiblast stem cells from mammalian embryos
Brons, I. G. M., Smithers, L. E., Trotter, M. W. B., Rugg-Gunn, P., Sun, B., Chuva de Sousa Lopes, S. M., Howlett, S. K., Clarkson, A., Ahrlund-Richter, L., Pedersen, R. A., et al. (2007) · Nature · doi:10.1038/nature05950 · Cited by 2,007
Myeloid leukaemia inhibitory factor maintains the developmental potential of embryonic stem cells
Williams, R. L., Hilton, D. J., Pease, S., Willson, T. A., Stewart, C. L., Gearing, D. P., Wagner, E. F., Metcalf, D., Nicola, N. A., & Gough, N. M. (1988) · Nature · doi:10.1038/336684a0 · Cited by 1,997
Bone morphogenetic protein-4 is required for mesoderm formation and patterning in the mouse.
Winnier, G., Blessing, M., Labosky, P. A., & Hogan, B. L. (1995) · Genes & Development · doi:10.1101/gad.9.17.2105 · Cited by 1,788
Murry, C. E., & Keller, G. (2008) · Cell · doi:10.1016/j.cell.2008.02.008 · Cited by 1,729
The induction of differentiation in teratocarcinoma stem cells by retinoic acid
Strickland, S., & Mahdavi, V. (1978) · Cell · doi:10.1016/0092-8674(78)90008-9 · Cited by 1,420
MULTIPOTENTIALITY OF SINGLE EMBRYONAL CARCINOMA CELLS.
Kleinsmith, L. J., & Pierce, G. B. (1964) · PubMed · Cited by 987
In vitro differentiation of embryonic stem cells
Keller, G. M. (1995) · Current Opinion in Cell Biology · doi:10.1016/0955-0674(95)80071-9 · Cited by 953
Requirement for Wnt3 in vertebrate axis formation
Liu, P., Wakamiya, M., Shea, M. J., Albrecht, U., Behringer, R. R., & Bradley, A. (1999) · Nature Genetics · doi:10.1038/11932 · Cited by 901
Mishina, Y., Suzuki, A., Ueno, N., & Behringer, R. R. (1995) · Genes & Development · doi:10.1101/gad.9.24.3027 · Cited by 776
Conlon, F. L., Lyons, K. M., Takaesu, N., Barth, K. S., Kispert, A., Herrmann, B., & Robertson, E. J. (1994) · Development · doi:10.1242/dev.120.7.1919 · Cited by 770
Teratocarcinomas and Mammalian Embryogenesis
Martin, G. R. (1980) · Science · doi:10.1126/science.6250214 · Cited by 738
Nodal Signaling in Vertebrate Development
Schier, A. F. (2003) · Annual Review of Cell and Developmental Biology · doi:10.1146/annurev.cellbio.19.041603.094522 · Cited by 633
Nodal is a novel TGF-β-like gene expressed in the mouse node during gastrulation
Zhou, X., Sasaki, H., Lowe, L., Hogan, B. L. M., & Kuehn, M. R. (1993) · Nature · doi:10.1038/361543a0 · Cited by 615
Gadue, P., Huber, T. L., Paddison, P. J., & Keller, G. M. (2006) · Proceedings of the National Academy of Sciences · doi:10.1073/pnas.0603916103 · Cited by 560
Stevens, L. C. (1970) · Developmental Biology · doi:10.1016/0012-1606(70)90130-2 · Cited by 559
Nodal signaling: developmental roles and regulation
Shen, M. M. (2007) · Development · doi:10.1242/dev.000166 · Cited by 538
Identification and characterization of subpopulations in undifferentiated ES cell culture
Toyooka, Y., Shimosato, D., Murakami, K., Takahashi, K., & Niwa, H. (2008) · Development · doi:10.1242/dev.017400 · Cited by 530
Tada, S., Era, T., Furusawa, C., Sakurai, H., Nishikawa, S., Kinoshita, M., Nakao, K., Chiba, T., & Nishikawa, S.-I. (2005) · Development · doi:10.1242/dev.02005 · Cited by 455
Johansson, B. M., & Wiles, M. V. (1995) · Molecular and Cellular Biology · doi:10.1128/mcb.15.1.141 · Cited by 449
BMP Type II Receptor Is Required for Gastrulation and Early Development of Mouse Embryos
Beppu, H., Kawabata, M., Hamamoto, T., Chytil, A., Minowa, O., Noda, T., & Miyazono, K. (2000) · Developmental Biology · doi:10.1006/dbio.2000.9670 · Cited by 421
Ng, E. S., Davis, R. P., Azzola, L., Stanley, E. G., & Elefanty, A. G. (2005) · Blood · doi:10.1182/blood-2005-03-0987 · Cited by 408
Self-citationSpontaneous Testicular Teratomas in an Inbred Strain of Mice
Stevens, L. C., & Little, C. C. (1954) · Proceedings of the National Academy of Sciences · doi:10.1073/pnas.40.11.1080 · Cited by 379
Teratocarcinomas as a model system for the study of embryogenesis and neoplasia
Martin, G. R. (1975) · Cell · doi:10.1016/0092-8674(75)90098-7 · Cited by 361
Ben-Haim, N., Lu, C., Guzman-Ayala, M., Pescatore, L., Mesnard, D., Bischofberger, M., Naef, F., Robertson, E. J., & Constam, D. B. (2006) · Developmental Cell · doi:10.1016/j.devcel.2006.07.005 · Cited by 330
Sumi, T., Tsuneyoshi, N., Nakatsuji, N., & Suemori, H. (2008) · Development · doi:10.1242/dev.021121 · Cited by 327
From teratocarcinomas to embryonic stem cells and beyond: a history of embryonic stem cell research
Solter, D. (2006) · Nature Reviews Genetics · doi:10.1038/nrg1827 · Cited by 326
Nostro, M. C., Cheng, X., Keller, G. M., & Gadue, P. (2008) · Cell Stem Cell · doi:10.1016/j.stem.2007.10.011 · Cited by 318
The Wnt co-receptors Lrp5 and Lrp6 are essential for gastrulation in mice
Kelly, O. G., Pinson, K. I., & Skarnes, W. C. (2004) · Development · doi:10.1242/dev.01137 · Cited by 290
From teratocarcinomas to embryonic stem cells
Andrews, P. W. (2002) · Philosophical Transactions of the Royal Society of London. Series B: Biological Sciences · doi:10.1098/rstb.2002.1058 · Cited by 264
Mesnard, D., Guzman-Ayala, M., & Constam, D. B. (2006) · Development · doi:10.1242/dev.02413 · Cited by 257
Gu, Z., Reynolds, E. M., Song, J., Lei, H., Feijen, A., Yu, L., He, W., MacLaughlin, D. T., Raaij, J. V. D. E.-V., Donahoe, P. K., et al. (1999) · Development · doi:10.1242/dev.126.11.2551 · Cited by 245
Mixl1 is required for axial mesendoderm morphogenesis and patterning in the murine embryo
Hart, A. H., Hartley, L., Sourris, K., Stadler, E. S., Li, R., Stanley, E. G., Tam, P. P. L., Elefanty, A. G., & Robb, L. (2002) · Development · doi:10.1242/dev.129.15.3597 · Cited by 229
Self-citationGu, Z., Nomura, M., Simpson, B. B., Lei, H., Feijen, A., van den Eijnden-van Raaij, J., Donahoe, P. K., & Li, E. (1998) · Genes & Development · doi:10.1101/gad.12.6.844 · Cited by 218
Absence of Nodal signaling promotes precocious neural differentiation in the mouse embryo
Camus, A., Perea-Gomez, A., Moreau, A., & Collignon, J. (2006) · Developmental Biology · doi:10.1016/j.ydbio.2006.03.047 · Cited by 212
Developmental Potentialities of Clonal In Vitro Cultures of Mouse Testicular Teratoma 2
(1970) · JNCI: Journal of the National Cancer Institute · doi:10.1093/jnci/44.5.1015 · Cited by 194
Morkel, M., Huelsken, J., Wakamiya, M., Ding, J., van de Wetering, M., Clevers, H., Taketo, M. M., Behringer, R. R., Shen, M. M., & Birchmeier, W. (2003) · Development · doi:10.1242/dev.00859 · Cited by 185
Hayashi, K., & Surani, M. A. (2009) · Development · doi:10.1242/dev.037747 · Cited by 175
Extrauterine Growth of Mouse Egg-cylinders results in Malignant Teratoma
SOLTER, D., ŠKREB, N., & DAMJANOV, I. (1970) · Nature · doi:10.1038/227503a0 · Cited by 173
Pick, M., Azzola, L., Mossman, A., Stanley, E. G., & Elefanty, A. G. (2007) · Stem Cells · doi:10.1634/stemcells.2006-0713 · Cited by 173
Self-citationGerm layer induction from embryonic stem cells
Gadue, P. J., Huber, T. L., Nostro, M. C., Kattman, S. J., & Keller, G. M. (2005) · Experimental Hematology · doi:10.1016/j.exphem.2005.06.009 · Cited by 164
Embryonic potency of embryoid bodies derived from a transplantable testicular teratoma of the mouse
Stevens, L. C. (1960) · Developmental Biology · doi:10.1016/0012-1606(60)90010-5 · Cited by 147
Szabó, P., & Mann, J. R. (1994) · Development · doi:10.1242/dev.120.6.1651 · Cited by 143
Ng, E. S., Azzola, L., Sourris, K., Robb, L., Stanley, E. G., & Elefanty, A. G. (2005) · Development · doi:10.1242/dev.01657 · Cited by 140
Self-citationElefanty, A. G., Begley, C. G., Hartley, L., Papaevangeliou, B., & Robb, L. (1999) · Blood · doi:10.1182/blood.v94.11.3754 · Cited by 119
Self-citationMartin, G. R., & Evans, M. J. (1975) · Cell · doi:10.1016/0092-8674(75)90035-5 · Cited by 118
Building the mouse gastrula: signals, asymmetry and lineages
Tam, P., Loebel, D. A. F., & Tanaka, S. (2006) · Current Opinion in Genetics & Development · doi:10.1016/j.gde.2006.06.008 · Cited by 116
Mml, a mouse Mix-like gene expressed in the primitive streak
Pearce, J., & Evans, M. J. (1999) · Mechanisms of Development · doi:10.1016/s0925-4773(99)00135-5 · Cited by 103
Bogue, C. W., Ganea, G. R., Sturm, E., Iannucci, R., & Jacobs, H. C. (2000) · Developmental Dynamics · doi:10.1002/1097-0177(2000)9999:9999<::aid-dvdy1059>3.0.co;2-# · Cited by 93
Robb, L., Hartley, L., Begley, C. G., Brodnicki, T. C., Copeland, N. G., Gilbert, D. J., Jenkins, N. A., & Elefanty, A. G. (2000) · Developmental Dynamics · doi:10.1002/1097-0177(2000)9999:9999<::aid-dvdy1070>3.0.co;2-o · Cited by 80
Self-citationHansson, M., Olesen, D. R., Peterslund, J. M. L., Engberg, N., Kahn, M., Winzi, M., Klein, T., Maddox-Hyttel, P., & Serup, P. (2009) · Developmental Biology · doi:10.1016/j.ydbio.2009.03.026 · Cited by 76
Willems, E., & Leyns, L. (2008) · Differentiation · doi:10.1111/j.1432-0436.2007.00257.x · Cited by 68
Transcriptional profiling of mouse and human ES cells identifies SLAIN1, a novel stem cell gene
Hirst, C. E., Ng, E. S., Azzola, L., Voss, A. K., Thomas, T., Stanley, E. G., & Elefanty, A. G. (2006) · Developmental Biology · doi:10.1016/j.ydbio.2006.01.023 · Cited by 58
Self-citationHirota, M., Watanabe, K., Hamada, S., Sun, Y., Strizzi, L., Mancino, M., Nagaoka, T., Gonzales, M., Seno, M., Bianco, C., et al. (2008) · Cellular Signalling · doi:10.1016/j.cellsig.2008.05.003 · Cited by 56
Teresky, A. K., Marsden, M. P. F., Kuff, E. L., & Levine, A. J. (1974) · Journal of Cellular Physiology · doi:10.1002/jcp.1040840218 · Cited by 49
β-Catenin/TCF/LEF regulate expression of the short form human Cripto-1
Hamada, S., Watanabe, K., Hirota, M., Bianco, C., Strizzi, L., Mancino, M., Gonzales, M., & Salomon, D. S. (2007) · Biochemical and Biophysical Research Communications · doi:10.1016/j.bbrc.2007.01.143 · Cited by 37
Lim, S. M., Pereira, L. A., Wong, M. S., Hirst, C. E., Vranken, B. E. V., Pick, M., Trounson, A. O., Elefanty, A. G., & Stanley, E. G. (2008) · Stem Cells · doi:10.1634/stemcells.2008-1008 · Cited by 33
Self-citationGene Targeting in a Centralized Facility
Barnett, L. D., & Köntgen, F. (2003) · Humana Press eBooks · doi:10.1385/1-59259-220-1:65 · Cited by 20
Germ Layer Induction in ESC—Following the Vertebrate Roadmap
Smith, J., Wardle, F. C., Loose, M., Stanley, E. G., & Patient, R. K. (2007) · Current Protocols in Stem Cell Biology · doi:10.1002/9780470151808.sc01d01s1 · Cited by 6
Self-citation
Research works printed but not linked: 1
- Askanazy M 1907 Die teratome nach ihrem bau, ihrem verlauf, ihren genese und im vergleich zum experimentellen teratoid. Verhandl Deutsch Pathol 11 39 82
Cited by
Pluripotency Factors in Embryonic Stem Cells Regulate Differentiation into Germ Layers
Thomson, M., Liu, S. J., Zou, L.-N., Smith, Z., Meissner, A., & Ramanathan, S. (2011) · Cell · doi:10.1016/j.cell.2011.05.017 · Cited by 542
Lewis-Israeli, Y. R., Wasserman, A. H., Gabalski, M. A., Volmert, B. D., Ming, Y., Ball, K. A., Yang, W., Zou, J., Ni, G., Pajares, N., et al. (2021) · Nature Communications · doi:10.1038/s41467-021-25329-5 · Cited by 536
Sturgeon, C. M., Ditadi, A., Awong, G., Kennedy, M., & Keller, G. (2014) · Nature Biotechnology · doi:10.1038/nbt.2915 · Cited by 467
Burridge, P. W., Thompson, S., Millrod, M. A., Weinberg, S., Yuan, X., Peters, A., Mahairaki, V., Koliatsos, V. E., Tung, L., & Zambidis, E. T. (2011) · PLoS ONE · doi:10.1371/journal.pone.0018293 · Cited by 417
Kennedy, M., Awong, G., Sturgeon, C. M., Ditadi, A., LaMotte-Mohs, R., Zúñiga-Pflücker, J. C., & Keller, G. (2012) · Cell Reports · doi:10.1016/j.celrep.2012.11.003 · Cited by 400
Metadata
- Authors
- Jackson, S. A., Schiesser, J., Stanley, E. G., & Elefanty, A. G.
- Affiliations
- Monash University (AU)
- Corresponding author
- Elefanty, Andrew G.
- Venue
- PLoS ONE
- Publisher
- Public Library of Science (PLoS)
- Published
- 2010-05-19
- Volume
- 5
- Issue
- 5
- Pages
- e10706
- ISSN
- 1932-6203 (ISSN-L)
- PMC
- PMC2873409
- OpenAlex
- W2078093070
- Cited by
- 67
- References
- 62
- Citations by year
- 2025: 1 · 2024: 2 · 2022: 1 · 2021: 2 · 2020: 2 · 2019: 1 · 2018: 5 · 2017: 7 · 2016: 8 · 2015: 2 · 2014: 10 · 2013: 6 · 2012: 9
- FWCI
- 3.25
- Type
- journal article
- Language
- en
- Open access
- gold
- doi.org
- Locations
- PLoS ONE (publishedVersion, cc-by)
- PubMed Central (publishedVersion, cc-by)
- PubMed (publishedVersion)
- DOAJ (DOAJ: Directory of Open Access Journals) (submittedVersion, cc-by-sa)
- Figshare (submittedVersion, cc-by)
- Minerva Access (University of Melbourne) (submittedVersion, cc-by)
- Funders
- Medical Research Council
- National Health and Medical Research Council
- Topics
- Life Sciences › Biochemistry, Genetics and Molecular Biology › Molecular Biology › Pluripotent Stem Cells Research
- Life Sciences › Biochemistry, Genetics and Molecular Biology › Molecular Biology › Developmental Biology and Gene Regulation
- Life Sciences › Biochemistry, Genetics and Molecular Biology › Cell Biology › Mesenchymal stem cell research
- Keywords
- embryonic stem cell differentiation, mesendoderm induction, temporal window, BMP4, Wnt3a, activin A, Mixl1, paracrine signaling, mouse embryonic stem cells
- MeSH terms
- Animals, Cell Differentiation, Embryo, Mammalian, Endoderm, Time Factors, Signal Transduction, Gene Expression Regulation, Developmental, Paracrine Communication, Activins, Intercellular Signaling Peptides and Proteins, Green Fluorescent Proteins, Wnt Proteins, Mice, Embryonic Stem Cells, Bone Morphogenetic Protein 4, Wnt3 Protein, Wnt3A Protein
About these checks
Registry, retraction, Cites and statistics results are computed, not judged, with one exception: a printed reference that no index lists is read once by a model before it counts as a citation error. Claims are extracted by a model and kept only when their quote appears verbatim in the text; each cited source is then checked, with a model’s help, for whether it says what the claim relies on. Those verdicts can be wrong — read the claim’s quote and the cited source before relying on one.
Statistics and arithmetic are recomputed, not judged.
Confidence bands are shown only for fields calibrated on our annotated test set. None is calibrated yet, so no band is shown.
What counts as a claim ›How we measure confidence ›How we check this ›
Are you an author, or do you see a problem with this page? Request a review
Data sources
Bibliographic data: Semantic Scholar, OpenAlex, Crossref.
Contains information from the Semantic Scholar Academic Graph Datasets, made available under the ODC Attribution License (ODC-BY 1.0).
Semantic Scholar’s data is described in: Kinney, R., et al. (2023). The Semantic Scholar Open Data Platform. arXiv:2301.10140.
