

The DOI matches its Crossref record; 34 of the 35 references it cites were found in a registry or an index.
DNA Methylation Profiles of the Brain-Derived Neurotrophic Factor (BDNF) Gene as a Potent Diagnostic Biomarker in Major Depression
Open accessAbstract
Major depression, because of its recurring and life-threatening nature, is one of the top 10 diseases for global disease burden. Major depression is still diagnosed on the basis of clinical symptoms in patients. The search for specific biological markers is of great importance to advance the method of diagnosis for depression. We examined the methylation profile of 2 CpG islands (I and IV) at the promoters of the brain-derived neurotrophic factor (BDNF) gene, which is well known to be involved in the pathophysiology of depression. We analyzed genomic DNA from peripheral blood of 20 Japanese patients with major depression and 18 healthy controls to identify an appropriate epigenetic biomarker to aid in the establishment of an objective system for the diagnosis of depression. Methylation rates at each CpG unit was measured using a MassArray® system (SEQUENOM), and 2-dimensional hierarchical clustering analyses were undertaken to determine the validity of these methylation profiles as a diagnostic biomarker. Analyses of the dendrogram from methylation profiles of CpG I, but not IV, demonstrated that classification of healthy controls and patients at the first branch completely matched the clinical diagnosis. Despite the small number of subjects, our results indicate that classification based on the DNA methylation profiles of CpG I of the BDNF gene may be a valuable diagnostic biomarker for major depression.
Overview
The claims and statistics of this paper haven’t been checked yet.
Run the check — free, no account needed. It reads the open-access text and checks the sources it cites.
Integrity signals
Registry
Cites
Statistics
Figures
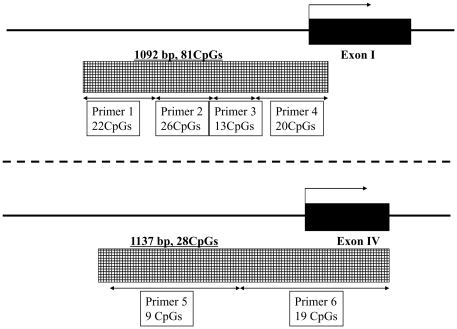
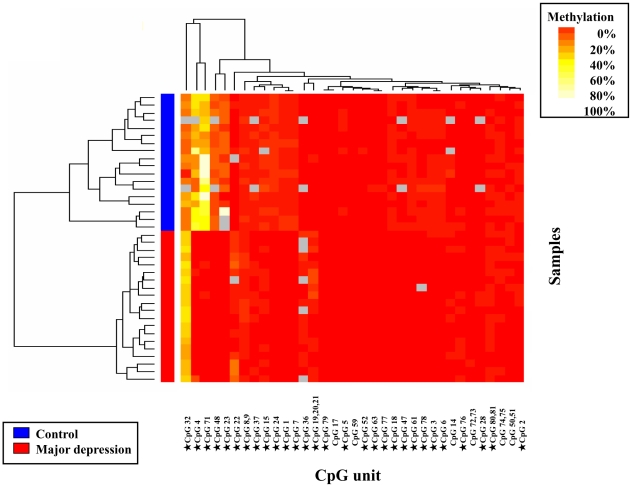
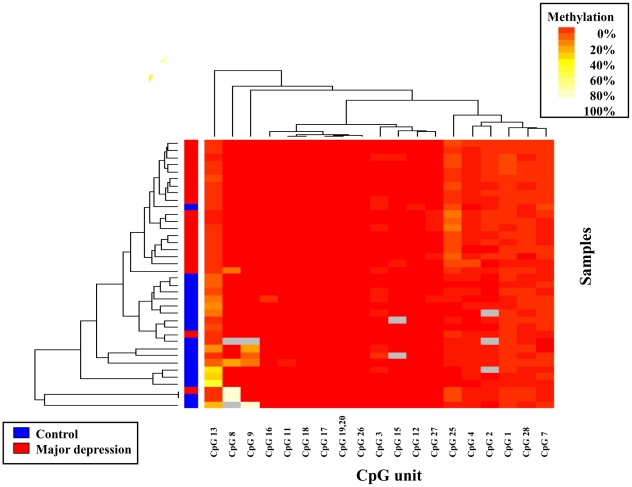
Verification
Claims the paper makes
The claims and statistics of this paper haven’t been checked yet.
Run the check — free, no account needed. It reads the open-access text and checks the sources it cites.
Claims other papers make about this one
Each is checked against this paper’s own text: does it say what the citing paper says it does?
The source backs part of the claim, not all of it — or backs it for a different population, condition or comparison.
In the citing paper
“In depression, studies report low peripheral BDNF levels and higher promoter methylation, while antidepressants and electroconvulsive therapy (ECT) increase BDNF expression and reverse methylation”
From The clinical use of epigenetics in psychiatry: a narrative review of epigenetic mechanisms, key candidate genes, and precision psychiatry (2025) · cites this paper as [63]
Experimental — accuracy not yet measuredIn the citing paper
“and altered patterns of BDNF DNA methylation has been found in patients with cognitive impairments [ 167 , 169 , 170 ].”
From DNA methylation: a mechanism linking environmental chemical exposures to risk of autism spectrum disorders? (2016) · cites this paper as [169]
In the citing paper
“The DNA methylation profile of two CpG islands in the BDNF (BDNF-I and -IV) promoter and exon I was significantly different between depressed patients and healthy controls.”
From Epigenetic mechanisms of major depression: Targeting neuronal plasticity (2018) · cites this paper as [127]
Self-check
Percentages, sums and reported differences re-computed from the paper’s own numbers.
The self-check needs the paper’s full text.
Citations
Cites
(1998) · The Journal of Clinical Psychiatry · Cited by 19,139
(1998) · PubMed · Cited by 10,216
Murray, C. J. L., & López, A. D. (1997) · The Lancet · doi:10.1016/s0140-6736(96)07492-2 · Cited by 7,007
The mini international neuropsychiatric interview
Lecrubier, Y., Sheehan, D. V., Hergueta, T., & Weiller, E. (1998) · European Psychiatry · doi:10.1016/s0924-9338(99)80239-9 · Cited by 5,899
Lopez, A. D., Mathers, C. D., Ezzati, M., Jamison, D. T., & Murray, C. J. (2006) · The Lancet · doi:10.1016/s0140-6736(06)68770-9 · Cited by 5,630
Cross-national epidemiology of major depression and bipolar disorder
Weissman, M. M. (1996) · JAMA: The Journal of the American Medical Association · doi:10.1001/jama.1996.03540040037030 · Cited by 2,302
Carroll, B. J. (1981) · Archives of General Psychiatry · doi:10.1001/archpsyc.1981.01780260017001 · Cited by 2,243
Sustained hippocampal chromatin regulation in a mouse model of depression and antidepressant action
Tsankova, N. M., Berton, O., Renthal, W., Kumar, A., Neve, R. L., & Nestler, E. J. (2006) · Nature Neuroscience · doi:10.1038/nn1659 · Cited by 1,780
DNA Methylation-Related Chromatin Remodeling in Activity-Dependent Bdnf Gene Regulation
Martinowich, K., Hattori, D., Wu, H., Fouse, S., He, F., Hu, Y., Fan, G., & Sun, Y. E. (2003) · Science · doi:10.1126/science.1090842 · Cited by 1,405
Epigenetic therapy of cancer: past, present and future
Yoo, C. B., & Jones, P. A. (2006) · Nature Reviews Drug Discovery · doi:10.1038/nrd1930 · Cited by 1,307
Cited by
Sorted by citations
Babenko, O., Kovalchuk, I., & Metz, G. A. S. (2015) · Neuroscience & Biobehavioral Reviews · doi:10.1016/j.neubiorev.2014.11.013 · Cited by 513
DNA methylation of BDNF as a biomarker of early-life adversity
Kundakovic, M., Gudsnuk, K., Herbstman, J. B., Tang, D., Perera, F. P., & Champagne, F. A. (2015) · Proceedings of the National Academy of Sciences · doi:10.1073/pnas.1408355111 · Cited by 426
Neural basis of major depressive disorder: Beyond monoamine hypothesis
Boku, S., Nakagawa, S., Toda, H., & Hishimoto, A. (2018) · Psychiatry and Clinical Neurosciences · doi:10.1111/pcn.12604 · Cited by 402
Smith, A. K., Kilaru, V., Klengel, T., Mercer, K. B., Bradley, B., Conneely, K. N., Ressler, K. J., & Binder, E. B. (2015) · American Journal of Medical Genetics Part B: Neuropsychiatric Genetics · doi:10.1002/ajmg.b.32278 · Cited by 355
Brain-derived neurotrophic factor in mood disorders and antidepressant treatments
Castrén, E., & Kojima, M. (2017) · Neurobiology of Disease · doi:10.1016/j.nbd.2016.07.010 · Cited by 337
Weder, N., Zhang, H., Jensen, K., Yang, B. Z., Simen, A., Jackowski, A., Lipschitz, D., Douglas-Palumberi, H., Ge, M., Perepletchikova, F., et al. (2014) · Journal of the American Academy of Child & Adolescent Psychiatry · doi:10.1016/j.jaac.2013.12.025 · Cited by 324
The role of DNA methylation in stress-related psychiatric disorders
Klengel, T., Pape, J., Binder, E. B., & Mehta, D. (2014) · Neuropharmacology · doi:10.1016/j.neuropharm.2014.01.013 · Cited by 309
Early-life experience, epigenetics, and the developing brain
Kundakovic, M., & Champagne, F. A. (2015) · Neuropsychopharmacology · doi:10.1038/npp.2014.140 · Cited by 304
The epigenetics of maternal cigarette smoking during pregnancy and effects on child development
Knopik, V. S., Maccani, M. A., Francazio, S. K., & McGeary, J. E. (2012) · Development and Psychopathology · doi:10.1017/s0954579412000776 · Cited by 290
The molecular bases of the suicidal brain
Turecki, G. (2014) · Nature Reviews Neuroscience · doi:10.1038/nrn3839 · Cited by 281
Fear extinction and BDNF: translating animal models of PTSD to the clinic
Andero, R., & Ressler, K. J. (2012) · Genes Brain & Behavior · doi:10.1111/j.1601-183x.2012.00801.x · Cited by 282
BECon: a tool for interpreting DNA methylation findings from blood in the context of brain
Edgar, R. D., Jones, M. J., Meaney, M. J., Turecki, G., & Kobor, M. S. (2017) · Translational Psychiatry · doi:10.1038/tp.2017.171 · Cited by 261
Unternaehrer, E., Luers, P., Mill, J., Dempster, E., Meyer, A. H., Staehli, S., Lieb, R., Hellhammer, D. H., & Meinlschmidt, G. (2012) · Translational Psychiatry · doi:10.1038/tp.2012.77 · Cited by 250
DNA methylation and regulation of gene expression: Guardian of our health
Dhar, G. A., Saha, S., Mitra, P., & Chaudhuri, R. N. (2021) · The Nucleus · doi:10.1007/s13237-021-00367-y · Cited by 260
Comorbidity of Depression with Physical Disorders: Research and Clinical Implications
Kang, H., Kim, S. Y., Bae, K., Kim, S., Shin, I., Yoon, J., & Kim, J. (2015) · Chonnam Medical Journal · doi:10.4068/cmj.2015.51.1.8 · Cited by 240
Stress, burnout and depression: A systematic review on DNA methylation mechanisms
Bakusic, J., Schaufeli, W., Claes, S., & Godderis, L. (2017) · Journal of Psychosomatic Research · doi:10.1016/j.jpsychores.2016.11.005 · Cited by 223
BDNF promoter methylation and suicidal behavior in depressive patients
Kang, H.-J., Kim, J.-M., Lee, J.-Y., Kim, S.-Y., Bae, K.-Y., Kim, S.-W., Shin, I.-S., Kim, H.-R., Shin, M.-G., & Yoon, J.-S. (2013) · Journal of Affective Disorders · doi:10.1016/j.jad.2013.08.001 · Cited by 218
Stress and trauma: BDNF control of dendritic-spine formation and regression
Bennett, M. R., & Lagopoulos, J. (2014) · Progress in Neurobiology · doi:10.1016/j.pneurobio.2013.10.005 · Cited by 199
Yamawaki, Y., Yoshioka, N., Nozaki, K., Ito, H., Oda, K., Harada, K., Shirawachi, S., Asano, S., Aizawa, H., Yamawaki, S., et al. (2018) · Brain Research · doi:10.1016/j.brainres.2017.12.004 · Cited by 204
Role of BDNF epigenetics in activity-dependent neuronal plasticity
Karpova, N. N. (2014) · Neuropharmacology · doi:10.1016/j.neuropharm.2013.04.002 · Cited by 200
D'Addario, C., Dell'Osso, B., Palazzo, M. C., Benatti, B., Lietti, L., Cattaneo, E., Galimberti, D., Fenoglio, C., Cortini, F., Scarpini, E., et al. (2012) · Neuropsychopharmacology · doi:10.1038/npp.2012.10 · Cited by 192
Unternaehrer, E., Meyer, A. H., Burkhardt, S. C. A., Dempster, E., Staehli, S., Theill, N., Lieb, R., & Meinlschmidt, G. (2015) · Stress · doi:10.3109/10253890.2015.1038992 · Cited by 181
Epigenetic mechanisms of major depression: Targeting neuronal plasticity
Uchida, S., Yamagata, H., Seki, T., & Watanabe, Y. (2018) · Psychiatry and Clinical Neurosciences · doi:10.1111/pcn.12621 · Cited by 181
DNA methylation of the BDNF gene and its relevance to psychiatric disorders
Ikegame, T., Bundo, M., Murata, Y., Kasai, K., Kato, T., & Iwamoto, K. (2013) · Journal of Human Genetics · doi:10.1038/jhg.2013.65 · Cited by 179
Tadić, A., Müller-Engling, L., Schlicht, K. F., Kotsiari, A., Dreimüller, N., Kleimann, A., Bleich, S., Lieb, K., & Frieling, H. (2014) · Molecular Psychiatry · doi:10.1038/mp.2013.58 · Cited by 175
Non, A. L., Binder, A. M., Kubzansky, L. D., & Michels, K. B. (2014) · Epigenetics · doi:10.4161/epi.28853 · Cited by 178
Keil, K. P., & Lein, P. J. (2016) · Environmental Epigenetics · doi:10.1093/eep/dvv012 · Cited by 167
Epigenetic alterations in depression and antidepressant treatment
Menke, A., & Binder, E. B. (2014) · Dialogues in Clinical Neuroscience · doi:10.31887/dcns.2014.16.3/amenke · Cited by 161
Gene–Environment Interaction in Major Depression: Focus on Experience-Dependent Biological Systems
Lopizzo, N., Bocchio‐Chiavetto, L., Cattane, N., Plazzotta, G., Tarazi, F. I., Pariante, C. M., Riva, M. A., & Cattaneo, A. (2015) · Frontiers in Psychiatry · doi:10.3389/fpsyt.2015.00068 · Cited by 182
Plasma lipidomics reveals potential lipid markers of major depressive disorder
Liu, X., Li, J., Zheng, P., Zhao, X., Zhou, C., Hu, C., Hou, X., Wang, H., Xie, P., & Xu, G. (2016) · Analytical and Bioanalytical Chemistry · doi:10.1007/s00216-016-9768-5 · Cited by 148
A review of DNA methylation in depression
Chen, D., Meng, L., Pei, F., Zheng, Y., & Leng, J. (2017) · Journal of Clinical Neuroscience · doi:10.1016/j.jocn.2017.05.022 · Cited by 160
Brain-derived neurotrophic factor and mental disorders
Lin, C.-C., & Huang, T.-L. (2020) · Biomedical Journal · doi:10.1016/j.bj.2020.01.001 · Cited by 143
Zhou, S., Rosenthal, D. G., Sherman, S., Zelikoff, J., Gordon, T., & Weitzman, M. (2014) · Current Problems in Pediatric and Adolescent Health Care · doi:10.1016/j.cppeds.2014.03.007 · Cited by 133
Hing, B., Sathyaputri, L., & Potash, J. B. (2018) · American Journal of Medical Genetics Part B: Neuropsychiatric Genetics · doi:10.1002/ajmg.b.32616 · Cited by 137
Epigenetic Regulations in Neuropsychiatric Disorders
Kuehner, J. N., Bruggeman, E. C., Wen, Z., & Yao, B. (2019) · Frontiers in Genetics · doi:10.3389/fgene.2019.00268 · Cited by 144
Epigenetics and depression: return of the repressed
Dalton, V. S., Kolshus, E., & McLoughlin, D. M. (2013) · Journal of Affective Disorders · doi:10.1016/j.jad.2013.10.028 · Cited by 142
Molecular biomarkers of depression
Gururajan, A., Clarke, G. A., Dinan, T. G., & Cryan, J. F. (2016) · Neuroscience & Biobehavioral Reviews · doi:10.1016/j.neubiorev.2016.02.011 · Cited by 141
Brain derived neurotrophic factor: Epigenetic regulation in psychiatric disorders
Mitchelmore, C., & Gede, L. B. (2014) · Brain Research · doi:10.1016/j.brainres.2014.06.037 · Cited by 134
DNA methylation analysis of BDNF gene promoters in peripheral blood cells of schizophrenia patients
Ikegame, T., Bundo, M., Sunaga, F., Asai, T., Nishimura, F., Yoshikawa, A., Kawamura, Y., Hibino, H., Tochigi, M., Kakiuchi, C., et al. (2013) · Neuroscience Research · doi:10.1016/j.neures.2013.08.004 · Cited by 129
BNDF methylation in mothers and newborns is associated with maternal exposure to war trauma
Kertes, D. A., Bhatt, S., Kamin, H. S., Hughes, D. A., Rodney, N. C., & Mulligan, C. J. (2017) · Clinical Epigenetics · doi:10.1186/s13148-017-0367-x · Cited by 131
Zheleznyakova, G. Y., Cao, H., & Schiöth, H. B. (2016) · Behavioral and Brain Functions · doi:10.1186/s12993-016-0101-4 · Cited by 131
Okada, S., Morinobu, S., Fuchikami, M., Segawa, M., Yokomaku, K., Kataoka, T., Okamoto, Y., Yamawaki, S., Inoue, T., Kusumi, I., et al. (2014) · Journal of Psychiatric Research · doi:10.1016/j.jpsychires.2014.02.002 · Cited by 125
Self-citationBlaze, J., Scheuing, L., & Roth, T. L. (2013) · Developmental Neuroscience · doi:10.1159/000350716 · Cited by 123
Zhao, J., Goldberg, J., Bremner, J. D., & Vaccarino, V. (2013) · Psychosomatic Medicine · doi:10.1097/psy.0b013e3182924cf4 · Cited by 122
The neuroscience of sadness: A multidisciplinary synthesis and collaborative review
Arias-López, J. A., Williams, C., Raghvani, R., Aghajani, M., Báez, S., Belzung, C., Booij, L., Busatto, G. F., Chiarella, J., Fu, C. H. Y., et al. (2020) · Neuroscience & Biobehavioral Reviews · doi:10.1016/j.neubiorev.2020.01.006 · Cited by 140
Inflammatory Factors Contribute to Depression and Its Comorbid Conditions
Anisman, H., & Hayley, S. P. (2012) · Science Signaling · doi:10.1126/scisignal.2003579 · Cited by 121
Booij, L., Wang, D., Lévesque, M. L., Tremblay, R. E., & Szyf, M. (2013) · Philosophical Transactions of the Royal Society B Biological Sciences · doi:10.1098/rstb.2012.0251 · Cited by 122
Biomarkers for major depressive disorder
Hacımusalar, Y., & Eşel, E. (2017) · Nöro Psikiyatri Arşivi · doi:10.5152/npa.2017.19482 · Cited by 123
Griffiths, B. B., & Hunter, R. G. (2014) · Neuroscience · doi:10.1016/j.neuroscience.2014.06.041 · Cited by 117
Choi, S., Han, K.-M., Won, E., Yoon, B.-J., Lee, M.-S., & Ham, B.-J. (2015) · Journal of Affective Disorders · doi:10.1016/j.jad.2014.09.042 · Cited by 111
Corrales, J., Fang, X., Thornton, C., Mei, W., Barbazuk, W. B., Duke, M. V., Scheffler, B. E., & Willett, K. L. (2014) · Comparative Biochemistry and Physiology Part C Toxicology & Pharmacology · doi:10.1016/j.cbpc.2014.02.005 · Cited by 106
Duclot, F., & Kabbaj, M. (2015) · Journal of Experimental Biology · doi:10.1242/jeb.107086 · Cited by 103
Peng, H., Zhu, Y., Strachan, E., Fowler, E., Bacus, T., Roy-Byrne, P., Goldberg, J., Vaccarino, V., & Zhao, J. (2018) · Psychosomatic Medicine · doi:10.1097/psy.0000000000000604 · Cited by 99
Doherty, T. S., Forster, A., & Roth, T. L. (2015) · Behavioural Brain Research · doi:10.1016/j.bbr.2015.05.028 · Cited by 100
Hill, R. A., Klug, M., Kiss Von Soly, S., Binder, M. D., Hannan, A. J., & van den Buuse, M. (2014) · Hippocampus · doi:10.1002/hipo.22302 · Cited by 99
Lauterstein, D., Tijerina, P., Corbett, K., Akgol Oksuz, B., Shen, S., Gordon, T., Klein, C., & Zelikoff, J. (2016) · International Journal of Environmental Research and Public Health · doi:10.3390/ijerph13040417 · Cited by 99
The Interplay of Stress and Sleep Impacts BDNF Level
Giese, M., Unternäehrer, E., Brand, S., Calabrese, P., Holsboer‐Trachsler, E., & Eckert, A. (2013) · PLoS ONE · doi:10.1371/journal.pone.0076050 · Cited by 99
Epigenetics and depressive disorders: a review of current progress and future directions
Januar, V., Saffery, R., & Ryan, J. (2015) · International Journal of Epidemiology · doi:10.1093/ije/dyu273 · Cited by 99
A Framework to Examine the Role of Epigenetics in Health Disparities among Native Americans
Brockie, T., Heinzelmann, M. M., & Gill, J. (2013) · Nursing Research and Practice · doi:10.1155/2013/410395 · Cited by 106
Epigenetics in depression and gut-brain axis: A molecular crosstalk
Begum, N., Mandhare, A., Tryphena, K. P., Srivastava, S., Shaikh, M. F., Singh, S. B., & Khatri, D. K. (2022) · Frontiers in Aging Neuroscience · doi:10.3389/fnagi.2022.1048333 · Cited by 102
Hypermethylation in the ZBTB20 gene is associated with major depressive disorder
Davies, M. N., Krause, L., Bell, J. T., Gao, F., Ward, K. J., Wu, H., Lu, H., Liu, Y., Tsai, P.-C., Collier, D. A., et al. (2014) · Genome biology · doi:10.1186/gb-2014-15-4-r56 · Cited by 98
Roth, T. L. (2013) · Development and Psychopathology · doi:10.1017/s0954579413000618 · Cited by 95
Therapeutic Potentials of BDNF/TrkB in Breast Cancer; Current Status and Perspectives
Tajbakhsh, A., Mokhtari‐Zaer, A., Rezaee, M., Afzaljavan, F., Rivandi, M., Hassanian, S. M., Ferns, G. A., Pasdar, A., & Avan, A. (2017) · Journal of Cellular Biochemistry · doi:10.1002/jcb.25943 · Cited by 93
Plasticity of the epigenome during early-life stress
Barnett-Burns, S., Szyszkowicz, J. K., Luheshi, G. N., Lutz, P.-É., & Turecki, G. (2017) · Seminars in Cell and Developmental Biology · doi:10.1016/j.semcdb.2017.09.033 · Cited by 97
A longitudinal study of BDNF promoter methylation and genotype with poststroke depression
Kim, J., Stewart, R. J., Kang, H., Kim, S., Kim, S., Shin, I., Park, M., Kim, H., Shin, M., Cho, K.-H., et al. (2013) · Journal of Affective Disorders · doi:10.1016/j.jad.2013.01.008 · Cited by 91
Roth, T. L., Matt, S. M., Chen, K., & Blaze, J. (2014) · Developmental Psychobiology · doi:10.1002/dev.21218 · Cited by 98
Sapozhnikov, D. M., & Szyf, M. (2021) · Nature Communications · doi:10.1038/s41467-021-25991-9 · Cited by 83
BDNF genetic variants and methylation: effects on cognition in major depressive disorder
Ferrer, A., Labad, J., Salvat-Pujol, N., Barrachina, M., Costas, J., Urretavizcaya, M., de Arriba-Arnau, A., Crespo, J. M., Soriano-Mas, C., Carracedo, Á., et al. (2019) · Translational Psychiatry · doi:10.1038/s41398-019-0601-8 · Cited by 84
Trauma and Stressor-Related Disorders
Walsh, K., Wells, J. B., Lurie, B., & Koenen, K. C. (2015) · Springer eBooks · doi:10.1007/978-3-319-13060-6_6 · Cited by 85
Carlberg, L., Scheibelreiter, J., Hassler, M. R., Schloegelhofer, M., Schmoeger, M., Ludwig, B., Kasper, S. F., Aschauer, H. N., Egger, G., & Schosser, A. (2014) · Journal of Affective Disorders · doi:10.1016/j.jad.2014.07.022 · Cited by 89
Walsh, K., Galea, S., & Koenen, K. C. (2012) · Clinical Psychology Science and Practice · doi:10.1111/cpsp.12004 · Cited by 96
Advance in Stress for Depressive Disorder
Ding, Y., & Dai, J. (2019) · Advances in experimental medicine and biology · doi:10.1007/978-981-32-9271-0_8 · Cited by 86
Fabbri, C., Hosák, L., Mößner, R., Giegling, I., Mandelli, L., Bellivier, F., Claes, S. J., Collier, D. A., Corrales, A., DeLisi, L. E., et al. (2016) · The World Journal of Biological Psychiatry · doi:10.1080/15622975.2016.1208843 · Cited by 84
Nagata, T., Kobayashi, N., Ishii, J., Shinagawa, S., Nakayama, R., Shibata, N., Kuerban, B., Ohnuma, T., Kondo, K., Arai, H., et al. (2015) · Dementia and Geriatric Cognitive Disorders Extra · doi:10.1159/000375367 · Cited by 81
Epigenetics applied to psychiatry: Clinical opportunities and future challenges
Kular, L., & Kular, S. (2018) · Psychiatry and Clinical Neurosciences · doi:10.1111/pcn.12634 · Cited by 90
Numata, S., Ishii, K., Tajima, A., Iga, J.-I., Kinoshita, M., Watanabe, S., Umehara, H., Fuchikami, M., Okada, S., Boku, S., et al. (2015) · Epigenetics · doi:10.1080/15592294.2014.1003743 · Cited by 79
Self-citationEarly Environments, Stress, and the Epigenetics of Human Health
Mulligan, C. J. (2016) · Annual Review of Anthropology · doi:10.1146/annurev-anthro-102215-095954 · Cited by 82
Beyond Haemostasis and Thrombosis: Platelets in Depression and Its Co-Morbidities
Izzi, B., Tirozzi, A., Cerletti, C., Donati, M. B., de Gaetano, G., Hoylaerts, M., Iacoviello, L., & Gialluisi, A. (2020) · International Journal of Molecular Sciences · doi:10.3390/ijms21228817 · Cited by 79
Tiwari, A., & Gonzalez, A. (2018) · Clinical Psychology Review · doi:10.1016/j.cpr.2018.01.006 · Cited by 71
Circulating microRNA 134 sheds light on the diagnosis of major depressive disorder
Zhang, H., Liu, X., Chen, J., Cheng, K., Bai, S., Zheng, P., Zhou, C., Wang, W., Wang, H., Zhong, L., et al. (2020) · Translational Psychiatry · doi:10.1038/s41398-020-0773-2 · Cited by 73
Caraci, F., Calabrese, F., Molteni, R., Bartova, L., Dold, M., Leggio, G. M., Fabbri, C., Mendlewicz, J., Racagni, G., Kasper, S. F., et al. (2018) · Pharmacological Reviews · doi:10.1124/pr.117.014977 · Cited by 76
Longitudinal multi-level biomarker analysis of BDNF in major depression and bipolar disorder
Schröter, K., Brum, M., Brunkhorst-Kanaan, N., Tole, F., Ziegler, C., Domschke, K., Reif, A., & Kittel-Schneider, S. (2020) · European Archives of Psychiatry and Clinical Neuroscience · doi:10.1007/s00406-019-01007-y · Cited by 68
Epigenetic pathways through which experiences become linked with biology
McGowan, P. O., & Roth, T. L. (2015) · Development and Psychopathology · doi:10.1017/s0954579415000206 · Cited by 80
Epigenetics and the glucocorticoid receptor: A review of the implications in depression
Farrell, C. M., & O’Keane, V. (2016) · Psychiatry Research · doi:10.1016/j.psychres.2016.06.022 · Cited by 78
Is there Progress? An Overview of Selecting Biomarker Candidates for Major Depressive Disorder
Young, J. J., Silber, T., Bruno, D., Galatzer‐Levy, I. R., Pomara, N., & Marmar, C. R. (2016) · Frontiers in Psychiatry · doi:10.3389/fpsyt.2016.00072 · Cited by 73
Kleimann, A., Kotsiari, A., Sperling, W., Gröschl, M., Heberlein, A., Kahl, K. G., Hillemacher, T., Bleich, S., Kornhuber, J., & Frieling, H. (2015) · Journal of Neural Transmission · doi:10.1007/s00702-014-1336-6 · Cited by 70
The effects of DNA methylation on human psychology
Kader, F., Ghai, M., & Maharaj, L. (2017) · Behavioural Brain Research · doi:10.1016/j.bbr.2017.12.004 · Cited by 75
Xu, H., Wang, J., Zhang, K., Zhao, M., Ellenbroek, B. A., Shao, F., & Wang, W. (2017) · Psychoneuroendocrinology · doi:10.1016/j.psyneuen.2017.11.013 · Cited by 71
Leschik, J., Lutz, B., & Gentile, A. (2021) · International Journal of Molecular Sciences · doi:10.3390/ijms22147339 · Cited by 77
Song, Y., Miyaki, K., Suzuki, T., Sasaki, Y., Tsutsumi, A., Kawakami, N., Shimazu, A., Takahashi, M., Inoue, A., Kan, C., et al. (2014) · American Journal of Medical Genetics Part B Neuropsychiatric Genetics · doi:10.1002/ajmg.b.32238 · Cited by 70
Kaut, O., Schmitt, I., Hofmann, A., Hoffmann, P., Schlaepfer, T. E., Wüllner, U., & Hurlemann, R. (2015) · European Archives of Psychiatry and Clinical Neuroscience · doi:10.1007/s00406-014-0572-y · Cited by 68
Introduction to Single-Cell DNA Methylation Profiling Methods
Ahn, J., Heo, S., Lee, J., & Bang, D. (2021) · Biomolecules · doi:10.3390/biom11071013 · Cited by 68
Advances in Biomarkers of Major Depressive Disorder
Huang, T., & Lin, C.-C. (2015) · Advances in clinical chemistry · doi:10.1016/bs.acc.2014.11.003 · Cited by 71
Longitudinal associations between BDNF promoter methylation and late-life depression
Kang, H.-J., Kim, J.-M., Bae, K.-Y., Kim, S.-W., Shin, I.-S., Kim, H.-R., Shin, M.-G., & Yoon, J.-S. (2015) · Neurobiology of Aging · doi:10.1016/j.neurobiolaging.2014.12.035 · Cited by 65
Ignácio, Z. M., Réus, G. Z., Abelaira, H. M., & Quevedo, J. (2014) · Neuroscience · doi:10.1016/j.neuroscience.2014.06.036 · Cited by 65
Novel biomarkers in major depression
Schneider, B., & Prvulovic, D. (2012) · Current Opinion in Psychiatry · doi:10.1097/yco.0b013e32835a5947 · Cited by 70
Epigenetics and Depression: An Update
Lin, E., & Tsai, S. (2019) · Psychiatry Investigation · doi:10.30773/pi.2019.07.17.2 · Cited by 63
Methyl‐donor deficiency in adolescence affects memory and epigenetic status in the mouse hippocampus
Tomizawa, H., Matsuzawa, D., Ishii, D., Matsuda, S., Kawai, K., Mashimo, Y., Sutoh, C., & Shimizu, E. (2015) · Genes Brain & Behavior · doi:10.1111/gbb.12207 · Cited by 61
The long-term impact of adverse caregiving environments on epigenetic modifications and telomeres
Blaze, J., Asok, A., & Roth, T. L. (2015) · Frontiers in Behavioral Neuroscience · doi:10.3389/fnbeh.2015.00079 · Cited by 61
Plasma metabolome analysis of patients with major depressive disorder
Kawamura, N., Shinoda, K., Satō, H., Sasaki, K., Suzuki, M., Yamaki, K., Fujimori, T., Yamamoto, H., Osei‐Hyiaman, D., & Ohashi, Y. (2018) · Psychiatry and Clinical Neurosciences · doi:10.1111/pcn.12638 · Cited by 61
Metadata
- Authors
- Fuchikami, M., Morinobu, S., Segawa, M., Okamoto, Y., Yamawaki, S., Ozaki, N., Inoue, T., Kusumi, I., Koyama, T., Tsuchiyama, K., & Terao, T.
- Affiliations
- Hiroshima University (JP)
- Nagoya University (JP)
- Hokkaido University (JP)
- Oita University (JP)
- Corresponding author
- Morinobu, Shigeru
- ORCID
- Venue
- PLoS ONE
- Publisher
- Public Library of Science (PLoS)
- Published
- 2011-08-30
- Volume
- 6
- Issue
- 8
- Pages
- e23881
- ISSN
- 1932-6203 (ISSN-L)
- PMC
- PMC3166055
- OpenAlex
- W2074918990
- Cited by
- 378
- References
- 35
- Citations by year
- 2026: 3 · 2025: 11 · 2024: 15 · 2023: 10 · 2022: 21 · 2021: 57 · 2020: 24 · 2019: 29 · 2018: 27 · 2017: 34 · 2016: 34 · 2015: 32 · 2014: 38 · 2013: 24 · 2012: 18
- FWCI
- 10.53
- Type
- journal article
- Language
- en
- Open access
- gold
- doi.org
- Locations
- PLoS ONE (publishedVersion, cc-by)
- Europe PMC (PubMed Central) (publishedVersion, cc-by)
- PubMed Central (publishedVersion, cc-by)
- PubMed (publishedVersion)
- Institutional Repositories DataBase (IRDB) (acceptedVersion, other-oa)
- RePEc: Research Papers in Economics (submittedVersion)
- DOAJ (DOAJ: Directory of Open Access Journals) (submittedVersion, cc-by-sa)
- Figshare (submittedVersion, cc-by)
- Hiroshima University Institutional Repository (submittedVersion, other-oa)
- Hiroshima University Acedemic Information Repository (Hiroshima University) (submittedVersion, cc-by)
- Funders
- Japan Society for the Promotion of Science (21591478)
- Core Research for Evolutional Science and Technology
- Topics
- Life Sciences › Biochemistry, Genetics and Molecular Biology › Molecular Biology › Epigenetics and DNA Methylation
- Health Sciences › Medicine › Pharmacology (medical) › Treatment of Major Depression
- Life Sciences › Biochemistry, Genetics and Molecular Biology › Genetics › Genetic Associations and Epidemiology
- Keywords
- major depressive disorder, DNA methylation, brain-derived neurotrophic factor, BDNF gene, epigenetic biomarkers, diagnostic biomarkers, CpG islands, promoter methylation, peripheral blood DNA, depression diagnosis
- MeSH terms
- Adult, Major Depressive Disorder, Depressive Disorder, Major, Exons, Female, Humans, Male, Middle Aged, Promoter Regions, Genetic, Biomarkers, Case-Control Studies, CpG Islands, DNA Methylation, Brain-Derived Neurotrophic Factor, Epigenesis, Genetic
About these checks
Registry, retraction, Cites and statistics results are computed, not judged, with one exception: a printed reference that no index lists is read once by a model before it counts as a citation error. Claims are extracted by a model and kept only when their quote appears verbatim in the text; each cited source is then checked, with a model’s help, for whether it says what the claim relies on. Those verdicts can be wrong — read the claim’s quote and the cited source before relying on one.
Statistics and arithmetic are recomputed, not judged.
Confidence bands are shown only for fields calibrated on our annotated test set. None is calibrated yet, so no band is shown.
What counts as a claim ›How we measure confidence ›How we check this ›
Are you an author, or do you see a problem with this page? Request a review
