

The DOI matches its Crossref record; 45 of the 46 references it cites were found in a registry or an index.
Modulation of the Metabiome by Rifaximin in Patients with Cirrhosis and Minimal Hepatic Encephalopathy
Open accessAbstract
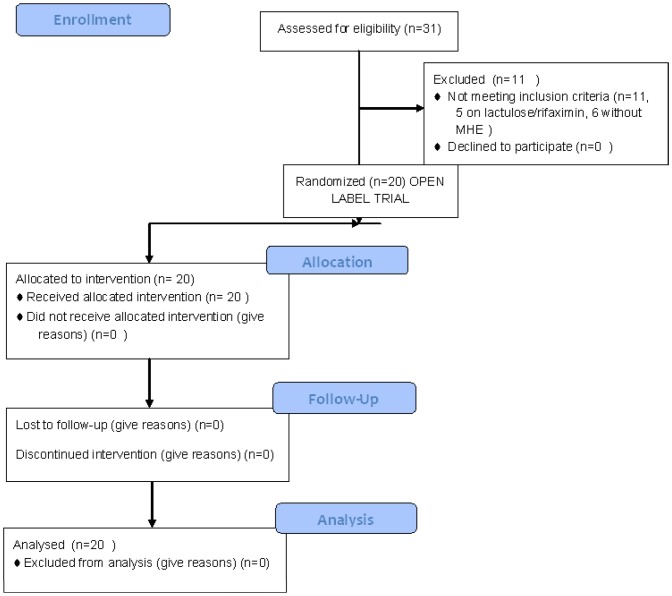
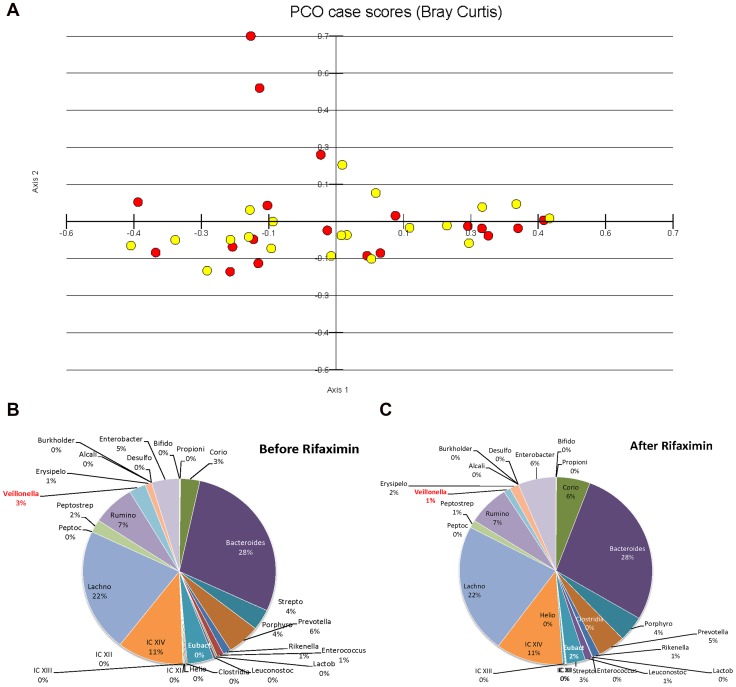
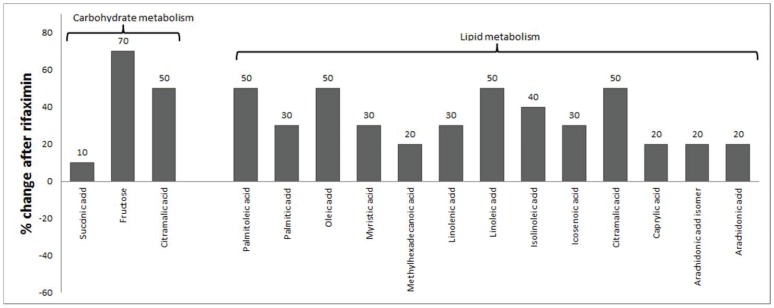
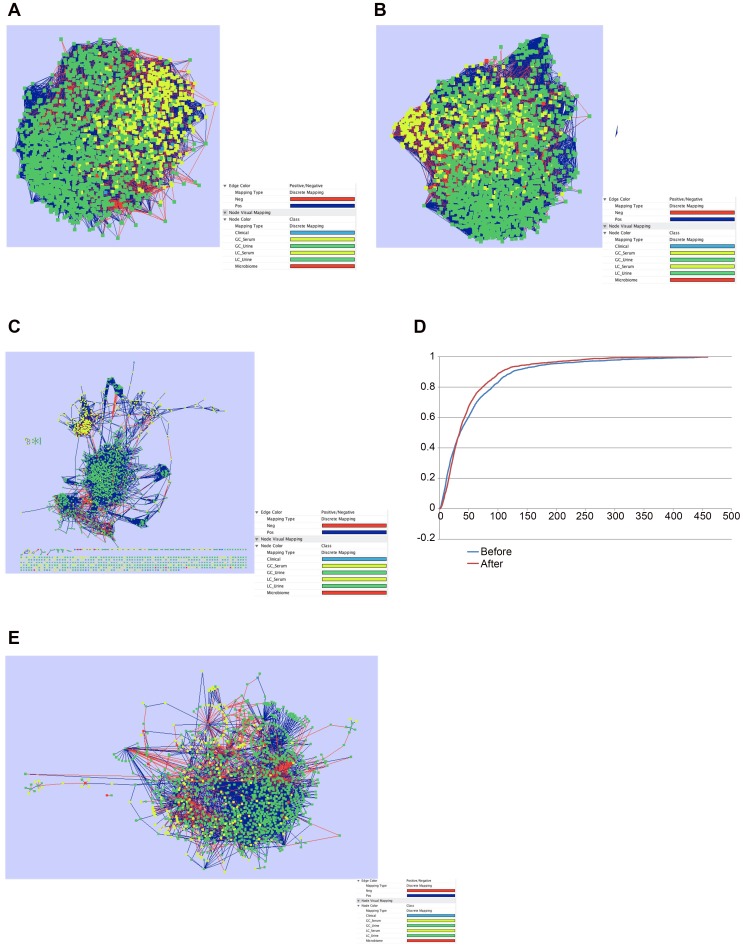
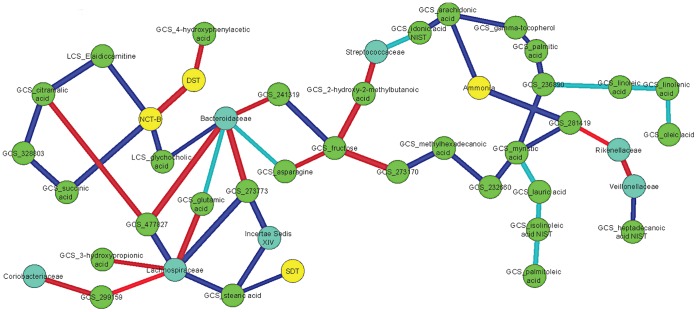
UNLABELLED: Hepatic encephalopathy (HE) represents a dysfunctional gut-liver-brain axis in cirrhosis which can negatively impact outcomes. This altered gut-brain relationship has been treated using gut-selective antibiotics such as rifaximin, that improve cognitive function in HE, especially its subclinical form, minimal HE (MHE). However, the precise mechanism of the action of rifaximin in MHE is unclear. We hypothesized that modulation of gut microbiota and their end-products by rifaximin would affect the gut-brain axis and improve cognitive performance in cirrhosis. Aim To perform a systems biology analysis of the microbiome, metabolome and cognitive change after rifaximin in MHE. METHODS: Twenty cirrhotics with MHE underwent cognitive testing, endotoxin analysis, urine/serum metabolomics (GC and LC-MS) and fecal microbiome assessment (multi-tagged pyrosequencing) at baseline and 8 weeks post-rifaximin 550 mg BID. Changes in cognition, endotoxin, serum/urine metabolites (and microbiome were analyzed using recommended systems biology techniques. Specifically, correlation networks between microbiota and metabolome were analyzed before and after rifaximin. RESULTS: There was a significant improvement in cognition(six of seven tests improved, p<0.01) and endotoxemia (0.55 to 0.48 Eu/ml, p = 0.02) after rifaximin. There was a significant increase in serum saturated (myristic, caprylic, palmitic, palmitoleic, oleic and eicosanoic) and unsaturated (linoleic, linolenic, gamma-linolenic and arachnidonic) fatty acids post-rifaximin. No significant microbial change apart from a modest decrease in Veillonellaceae and increase in Eubacteriaceae was observed. Rifaximin resulted in a significant reduction in network connectivity and clustering on the correlation networks. The networks centered on Enterobacteriaceae, Porphyromonadaceae and Bacteroidaceae indicated a shift from pathogenic to beneficial metabolite linkages and better cognition while those centered on autochthonous taxa remained similar. CONCLUSIONS: Rifaximin is associated with improved cognitive function and endotoxemia in MHE, which is accompanied by alteration of gut bacterial linkages with metabolites without significant change in microbial abundance. TRIAL REGISTRATION: ClinicalTrials.gov NCT01069133.
Overview
The claims and statistics of this paper haven’t been checked yet.
Run the check — free, no account needed. It reads the open-access text and checks the sources it cites.
Integrity signals
Registry
Cites
Statistics
Figures
Verification
Claims the paper makes
The claims and statistics of this paper haven’t been checked yet.
Run the check — free, no account needed. It reads the open-access text and checks the sources it cites.
Claims other papers make about this one
Each is checked against this paper’s own text: does it say what the citing paper says it does?
In the citing paper
“Administration of non-absorbable antibiotics in patients with hepatic encephalopathy and mild cognitive impairment improves cognitive performance, subcortical brain activity, fronto-parietal connectivity, and serum metabolomic profile (418, 419).”
From Signalling cognition: The gut microbiota and hypothalamic-pituitary-adrenal axis (2023) · cites this paper as [419]
Self-check
Percentages, sums and reported differences re-computed from the paper’s own numbers.
The self-check needs the paper’s full text.
Citations
Cites
Cytoscape: A software Environment for integrated models of biomolecular interaction networks
Shannon, P., Markiel, A., Ozier, O., Baliga, N. S., Wang, J. T., Ramage, D., Amin, N., Schwikowski, B., & Ideker, T. (2003) · Genome Research · doi:10.1101/gr.1239303 · Cited by 51,888
An obesity-associated gut microbiome with increased capacity for energy harvest
Turnbaugh, P. J., Ley, R. E., Mahowald, M. A., Magrini, V., Mardis, E. R., & Gordon, J. I. (2006) · Nature · doi:10.1038/nature05414 · Cited by 12,444
PLS-regression: a basic tool of chemometrics
Wold, S., Sjöström, M., & Eriksson, L. (2001) · Chemometrics and Intelligent Laboratory Systems · doi:10.1016/s0169-7439(01)00155-1 · Cited by 10,084
A core gut microbiome in obese and lean twins
Turnbaugh, P. J., Hamady, M., Yatsunenko, T., Cantarel, B. L., Duncan, A., Ley, R. E., Sogin, M. L., Jones, W. J., Roe, B. A., Affourtit, J. P., et al. (2009) · Nature · doi:10.1038/nature07540 · Cited by 7,823
Enterotypes of the human gut microbiome
MetaHIT Consortium (additional members), Arumugam, M., Raes, J., Pelletier, E., Le Paslier, D., Yamada, T., Mende, D. R., Fernandes, G. R., Tap, J., Bruls, T., et al. (2011) · Nature · doi:10.1038/nature09944 · Cited by 7,548
Ferenci, P., Lockwood, A. H., Mullen, K. D., Tarter, R. E., Weißenborn, K., & Blei, A. T. (2002) · Hepatology · doi:10.1053/jhep.2002.31250 · Cited by 2,035
Computing topological parameters of biological networks
Assenov, Y., Ramírez, F., Schelhorn, S.-E., Lengauer, T., & Albrecht, M. (2007) · Bioinformatics · doi:10.1093/bioinformatics/btm554 · Cited by 1,805
The interplay between the intestinal microbiota and the brain
Collins, S. M., Surette, M., & Bercik, P. (2012) · Nature Reviews Microbiology · doi:10.1038/nrmicro2876 · Cited by 1,611 · cited 1×
“We propose that one needs to take a systems biology approach to correlate the complex functional dynamic in the gut ecosystem as a modulator of the gut-brain axis in the human host [14].”
BackgroundRifaximin Treatment in Hepatic Encephalopathy
Bass, N. M., Mullen, K. D., Sanyal, A., Poordad, F., Neff, G., Leevy, C. B., Sigal, S., Sheikh, M. Y., Beavers, K., Frederick, T., et al. (2010) · New England Journal of Medicine · doi:10.1056/nejmoa0907893 · Cited by 1,300
pcaMethods—a bioconductor package providing PCA methods for incomplete data
Stacklies, W., Redestig, H., Scholz, M., Walther, D., & Selbig, J. (2007) · Bioinformatics · doi:10.1093/bioinformatics/btm069 · Cited by 1,156
Cited by
Sorted by citations
Cryan, J. F., O'Riordan, K. J., Cowan, C. S. M., Sandhu, K. V., Bastiaanssen, T. F. S., Boehme, M., Codagnone, M. G., Cussotto, S., Fulling, C., Golubeva, A. V., et al. (2019) · Physiological Reviews · doi:10.1152/physrev.00018.2018 · Cited by 5,286
Gut/brain axis and the microbiota
Mayer, E. A., Tillisch, K., & Gupta, A. (2015) · Journal of Clinical Investigation · doi:10.1172/jci76304 · Cited by 1,503
Altered profile of human gut microbiome is associated with cirrhosis and its complications
Bajaj, J. S., Heuman, D. M., Hylemon, P. B., Sanyal, A. J., White, M. B., Monteith, P., Noble, N. A., Unser, A. B., Daita, K., Fisher, A. R., et al. (2014) · Journal of Hepatology · doi:10.1016/j.jhep.2013.12.019 · Cited by 1,099
Gut microbes and the brain: paradigm shift in neuroscience
Mayer, E. A., Knight, R., Mazmanian, S. K., Cryan, J. F., & Tillisch, K. (2014) · The Journal of Neuroscience · doi:10.1523/jneurosci.3299-14.2014 · Cited by 1,033
Effects of environmental pollutants on gut microbiota
Jin, Y., Wu, S., Zeng, Z., & Fu, Z. (2017) · Environmental Pollution · doi:10.1016/j.envpol.2016.11.045 · Cited by 683
Bajaj, J. S., Kassam, Z., Fagan, A., Gavis, E. A., Liu, E., Cox, I. J., Kheradman, R., Heuman, D. M., Wang, J., Gurry, T., et al. (2017) · Hepatology · doi:10.1002/hep.29306 · Cited by 647
Antibiotics as deep modulators of gut microbiota: between good and evil
Ianiro, G., Tilg, H., & Gasbarrini, A. (2016) · Gut · doi:10.1136/gutjnl-2016-312297 · Cited by 653
Gut microbiome and liver diseases
Tilg, H., Cani, P. D., & Mayer, E. A. (2016) · Gut · doi:10.1136/gutjnl-2016-312729 · Cited by 525
Role of the gut microbiota in human nutrition and metabolism
Ramakrishna, B. (2013) · Journal of Gastroenterology and Hepatology · doi:10.1111/jgh.12294 · Cited by 525
Contribution of the Intestinal Microbiome and Gut Barrier to Hepatic Disorders
Chopyk, D. M., & Grakoui, A. (2020) · Gastroenterology · doi:10.1053/j.gastro.2020.04.077 · Cited by 504
Hepatic encephalopathy: Novel insights into classification, pathophysiology and therapy
Rose, C. F., Amodio, P., Bajaj, J. S., Dhiman, R. K., Montagnese, S., Taylor-Robinson, S. D., Vilstrup, H., & Jalan, R. (2020) · Journal of Hepatology · doi:10.1016/j.jhep.2020.07.013 · Cited by 509
Cirrhosis-associated immune dysfunction
Albillos, A., Martín‐Mateos, R., der Merwe, V., Wiest, R., Jalan, R., & Álvarez‐Mon, M. (2021) · Nature Reviews Gastroenterology & Hepatology · doi:10.1038/s41575-021-00520-7 · Cited by 485
Gut–liver axis: barriers and functional circuits
Pabst, O., Hornef, M. W., Schaap, F. G., Cerovic, V., Clavel, T., & Bruns, T. (2023) · Nature Reviews Gastroenterology & Hepatology · doi:10.1038/s41575-023-00771-6 · Cited by 488
Targeting the gut-liver axis in liver disease
Wiest, R., Albillos, A., Trauner, M., Bajaj, J. S., & Jalan, R. (2017) · Journal of Hepatology · doi:10.1016/j.jhep.2017.05.007 · Cited by 427
Signalling cognition: The gut microbiota and hypothalamic-pituitary-adrenal axis
Rusch, J. A., Layden, B. T., & Dugas, L. R. (2023) · Frontiers in Endocrinology · doi:10.3389/fendo.2023.1130689 · Cited by 415
The effect of antibiotics on the composition of the intestinal microbiota—a systematic review
Zimmermann, P., & Curtis, N. (2019) · Journal of Infection · doi:10.1016/j.jinf.2019.10.008 · Cited by 383
Alzheimer’s disease and gut microbiota
Hu, X., Wang, T., & Jin, F. (2016) · Science China Life Sciences · doi:10.1007/s11427-016-5083-9 · Cited by 371
Cirrhosis, bile acids and gut microbiota: Unraveling a complex relationship
Ridlon, J. M., Alves, J. M., Hylemon, P. B., & Bajaj, J. S. (2013) · Gut Microbes · doi:10.4161/gmic.25723 · Cited by 336
Salivary microbiota reflects changes in gut microbiota in cirrhosis with hepatic encephalopathy
Bajaj, J. S., Betrapally, N. S., Hylemon, P. B., Heuman, D. M., Daita, K., White, M. B., Unser, A., Thacker, L. R., Sanyal, A. J., Kang, D. J., et al. (2015) · Hepatology · doi:10.1002/hep.27819 · Cited by 325
Self-citationThe evolution of the use of faecal microbiota transplantation and emerging therapeutic indications.
Allegretti, J. R., Mullish, B. H., Kelly, C., & Fischer, M. (2019) · The Lancet · doi:10.1016/s0140-6736(19)31266-8 · Cited by 358
Antibiotic use and microbiome function
Ferrer, M., Méndez–García, C., Rojo, D., Barbas, C., & Moyá, A. (2016) · Biochemical Pharmacology · doi:10.1016/j.bcp.2016.09.007 · Cited by 315
Bajaj, J. S., Salzman, N. H., Acharya, C., Sterling, R. K., White, M. B., Gavis, E. A., Fagan, A., Hayward, M., Holtz, M. L., Matherly, S. C., et al. (2019) · Hepatology · doi:10.1002/hep.30690 · Cited by 302
Alcoholic Liver Disease: The Gut Microbiome and Liver Cross Talk
Hartmann, P., Seebauer, C. T., & Schnabl, B. (2015) · Alcoholism Clinical and Experimental Research · doi:10.1111/acer.12704 · Cited by 285
Bajaj, J. S., Heuman, D. M., Hylemon, P. B., Sanyal, A. J., Puri, P., Sterling, R. K., Luketic, V. A., Stravitz, R. T., Siddiqui, M. S., Fuchs, M. A., et al. (2014) · Alimentary Pharmacology & Therapeutics · doi:10.1111/apt.12695 · Cited by 275
The microbiota in cirrhosis and its role in hepatic decompensation
Trebicka, J., Macnaughtan, J., Schnabl, B., Shawcross, D. L., & Bajaj, J. S. (2021) · Journal of Hepatology · doi:10.1016/j.jhep.2020.11.013 · Cited by 283
The gut microbiota: A treasure for human health
Li, D., Wang, P., Wang, P., Hu, X., & Chen, F. (2016) · Biotechnology Advances · doi:10.1016/j.biotechadv.2016.08.003 · Cited by 271
Microbiota, cirrhosis, and the emerging oral-gut-liver axis
Acharya, C., Sahingur, S. E., & Bajaj, J. S. (2017) · JCI Insight · doi:10.1172/jci.insight.94416 · Cited by 260
Microbiome as a therapeutic target in alcohol-related liver disease
Sarin, S. K., Pande, A., & Schnabl, B. (2019) · Journal of Hepatology · doi:10.1016/j.jhep.2018.10.019 · Cited by 254
Microbiota and the gut-liver axis: Bacterial translocation, inflammation and infection in cirrhosis
Giannelli, V. (2014) · World Journal of Gastroenterology · doi:10.3748/wjg.v20.i45.16795 · Cited by 242
Patel, V., Lee, S., McPhail, M. J. W., Silva, K. D., Guilly, S., Zamalloa, A., Witherden, E. A., Støy, S. H., Vijay, G. K. M., Pons, N., et al. (2021) · Journal of Hepatology · doi:10.1016/j.jhep.2021.09.010 · Cited by 240
Gut–liver axis, cirrhosis and portal hypertension: the chicken and the egg
Arab, J. P., Martín‐Mateos, R., & Shah, V. H. (2017) · Hepatology International · doi:10.1007/s12072-017-9798-x · Cited by 233
Häussinger, D., Dhiman, R. K., Felipo, V., Görg, B., Jalan, R., KIRCHEIS, G., Merli, M., Montagnese, S., Romero‐Gómez, M., Schnitzler, A., et al. (2022) · Nature Reviews Disease Primers · doi:10.1038/s41572-022-00366-6 · Cited by 231
Woodhouse, C., Patel, V., Singanayagam, A., & Shawcross, D. L. (2017) · Alimentary Pharmacology & Therapeutics · doi:10.1111/apt.14397 · Cited by 212
Mediterranean Diet and Health: Food Effects on Gut Microbiota and Disease Control
CHIERICO, F. D., Vernocchi, P., Dallapiccola, B., & Putignani, L. (2014) · International Journal of Molecular Sciences · doi:10.3390/ijms150711678 · Cited by 207
Antibiotic prophylaxis in cirrhosis: Good and bad
Fernández, J., Tandon, P., Mensa, J., & García–Tsao, G. (2015) · Hepatology · doi:10.1002/hep.28330 · Cited by 205
Gut-liver axis in liver cirrhosis: How to manage leaky gut and endotoxemia
Fukui, H. (2015) · World Journal of Hepatology · doi:10.4254/wjh.v7.i3.425 · Cited by 201
Sharpton, S. R., Schnabl, B., Knight, R., & Loomba, R. (2021) · Cell Metabolism · doi:10.1016/j.cmet.2020.11.010 · Cited by 194
Large-Scale Survey of Gut Microbiota Associated With MHE Via 16S rRNA-Based Pyrosequencing
Zhang, Z., Zhai, H., Geng, J., Yu, R., Ren, H.-Q., Fan, H., & Shi, P. (2013) · The American Journal of Gastroenterology · doi:10.1038/ajg.2013.221 · Cited by 186
Microbiota-gut-brain axis and cognitive function
Gareau, M. G. (2014) · Advances in Experimental Medicine and Biology · doi:10.1007/978-1-4939-0897-4_16 · Cited by 189
Bureau, C., Thabut, D., Jézequel, C., Archambeaud, I., d’Altéroche, L., Dharancy, S., Borentain, P., Oberti, F., Plessier, A., de Lédinghen, V., et al. (2021) · Annals of Internal Medicine · doi:10.7326/m20-0202 · Cited by 186
Gut dysbiosis associated with hepatitis C virus infection
Inoue, T., Nakayama, J., Moriya, K., Kawaratani, H., Momoda, R., Ito, K., Iio, E., Nojiri, S., Fujiwara, K., Yoneda, M., et al. (2018) · Clinical Infectious Diseases · doi:10.1093/cid/ciy205 · Cited by 183
Alcohol or gut microbiota: who is the guilty?
Meroni, M., Longo, M., & Dongiovanni, P. (2019) · International Journal of Molecular Sciences · doi:10.3390/ijms20184568 · Cited by 183
The role of microbiota in hepatic encephalopathy
Bajaj, J. S. (2014) · Gut Microbes · doi:10.4161/gmic.28684 · Cited by 181
Gut Microbiota: Its Role in Hepatic Encephalopathy
Rai, R., Saraswat, V. A., & Dhiman, R. K. (2014) · Journal of Clinical and Experimental Hepatology · doi:10.1016/j.jceh.2014.12.003 · Cited by 180
Solé, C., Guilly, S., Silva, K. D., Llopis, M., Chatelier, E. L., Huelin, P., Carol, M., Moreira, R., Fabrellas, N., de Prada, G., et al. (2020) · Gastroenterology · doi:10.1053/j.gastro.2020.08.054 · Cited by 186
Ponziani, F. R., Zocco, M. A., D’Aversa, F., Pompili, M., & Gasbarrini, A. (2017) · World Journal of Gastroenterology · doi:10.3748/wjg.v23.i25.4491 · Cited by 177
Microbiota changes and intestinal microbiota transplantation in liver diseases and cirrhosis
Bajaj, J. S., & Khoruts, A. (2020) · Journal of Hepatology · doi:10.1016/j.jhep.2020.01.017 · Cited by 172
Role of gut microbiota via the gut-liver-brain axis in digestive diseases
Ding, J., Jin, Z., Yang, X., Lou, J., Shan, W., Hu, Y., Du, Q., Liao, Q., Xie, R., & Xu, J. (2020) · World Journal of Gastroenterology · doi:10.3748/wjg.v26.i40.6141 · Cited by 183
Jin, M., Kalainy, S., Baskota, N., Chiang, D., Deehan, E. C., McDougall, C., Tandon, P., Martínez, I., Cervera, C., Walter, J., et al. (2019) · Liver International · doi:10.1111/liv.14106 · Cited by 171
Altered Microbiome in Patients With Cirrhosis and Complications
Acharya, C., & Bajaj, J. S. (2018) · Clinical Gastroenterology and Hepatology · doi:10.1016/j.cgh.2018.08.008 · Cited by 164
Gangarapu, V., İnce, A. T., Baysal, B., Kayar, Y., Klç, U., Gök, Ö., Uysal, Ö., & Şentürk, H. (2015) · European Journal of Gastroenterology & Hepatology · doi:10.1097/meg.0000000000000348 · Cited by 156
Refining the Ammonia Hypothesis
Tapper, E. B., Jiang, Z. G., & Patwardhan, V. R. (2015) · Mayo Clinic Proceedings · doi:10.1016/j.mayocp.2015.03.003 · Cited by 148
Bajaj, J. S., Kakiyama, G., Savidge, T., Takei, H., Kassam, Z., Fagan, A., Gavis, E. A., Pandak, W. M., Nittono, H., Hylemon, P. B., et al. (2018) · Hepatology · doi:10.1002/hep.30037 · Cited by 148
The Use of Rifaximin in Patients With Cirrhosis
Caraceni, P., Vargas, V., Solà, E., Alessandria, C., de Wit, K., Trebicka, J., Angeli, P., Mookerjee, R. P., Durand, F., Pose, E., et al. (2021) · Hepatology · doi:10.1002/hep.31708 · Cited by 151
The Role of Antibiotics in Gut Microbiota Modulation: The Eubiotic Effects of Rifaximin
Ponziani, F. R., Scaldaferri, F., Petito, V., Sterbini, F. P., Pecere, S., Lopetuso, L. R., Palladini, A., Gerardi, V., Masucci, L., Pompili, M., et al. (2016) · Digestive Diseases · doi:10.1159/000443361 · Cited by 138
Gut-derived systemic inflammation as a driver of depression in chronic liver disease
Kronsten, V. T., Tranah, T. H., Pariante, C. M., & Shawcross, D. L. (2021) · Journal of Hepatology · doi:10.1016/j.jhep.2021.11.008 · Cited by 137
Ridlon, J. M., Devendran, S., Alves, J. M. P., Doden, H. L., Wolf, P. G., Pereira, G. V., Ly, L. K., Volland, A., Takei, H., Nittono, H., et al. (2019) · Gut Microbes · doi:10.1080/19490976.2019.1618173 · Cited by 141
Tsiaoussis, J., Antoniou, M. N., Koliarakis, I., Mesnage, R., Vardavas, C. I., Izotov, B. N., Psaroulaki, A., & Tsatsakis, A. M. (2019) · Toxicology Letters · doi:10.1016/j.toxlet.2019.04.014 · Cited by 139
Gut microbiome as a clinical tool in gastrointestinal disease management: are we there yet?
Quigley, E. M. M. (2017) · Nature Reviews Gastroenterology & Hepatology · doi:10.1038/nrgastro.2017.29 · Cited by 125
Bajaj, J. S., Vargas, H. E., Reddy, K. R., Lai, J. C., O’Leary, J. G., Tandon, P., Wong, F. S.-H., Mitrani, R., White, M. B., Kelly, M., et al. (2018) · Clinical Gastroenterology and Hepatology · doi:10.1016/j.cgh.2018.07.022 · Cited by 125
Bajaj, J. S. (2015) · Alimentary Pharmacology & Therapeutics · doi:10.1111/apt.13435 · Cited by 127
Bajaj, J. S., Acharya, C., Fagan, A., White, M. B., Gavis, E. A., Heuman, D. M., Hylemon, P. B., Fuchs, M. A., Puri, P., Schubert, M. L., et al. (2018) · The American Journal of Gastroenterology · doi:10.1038/s41395-018-0085-9 · Cited by 124
Rifaximin: beyond the traditional antibiotic activity
Calanni, F., Renzulli, C., Barbanti, M., & Viscomi, G. C. (2014) · The Journal of Antibiotics · doi:10.1038/ja.2014.106 · Cited by 119
Gut microbiota and obesity: Role in aetiology and potential therapeutic target
Moran, C. P., & Shanahan, F. (2014) · Best Practice & Research Clinical Gastroenterology · doi:10.1016/j.bpg.2014.07.005 · Cited by 122
Bajaj, J. S., Reddy, K. R., O’Leary, J. G., Vargas, H. E., Lai, J. C., Kamath, P. S., Tandon, P., Wong, F. S.-H., Subramanian, R., Thuluvath, P. J., et al. (2020) · Gastroenterology · doi:10.1053/j.gastro.2020.07.019 · Cited by 123
Nardelli, S., Gioia, S., Ridola, L., Farcomeni, A., Merli, M., & Riggio, O. (2019) · Hepatology · doi:10.1002/hep.30304 · Cited by 109
Gut microbiota, cirrhosis, and alcohol regulate bile acid metabolism in the gut
Ridlon, J. M., Kang, D.-J., Hylemon, P. B., & Bajaj, J. S. (2015) · Digestive Diseases · doi:10.1159/000371678 · Cited by 109
Dysfunctional Immune Response in Acute-on-Chronic Liver Failure: It Takes Two to Tango
Martin-Mateos, R., Alvarez-Mon, M., & Albillos, A. (2019) · Frontiers in Immunology · doi:10.3389/fimmu.2019.00973 · Cited by 116
Gut microbiome and liver disease
Betrapally, N. S., Gillevet, P. M., & Bajaj, J. S. (2016) · Translational research · doi:10.1016/j.trsl.2016.07.005 · Cited by 106
Kaji, K., Takaya, H., Saikawa, S., Furukawa, M., Sato, S., Kawaratani, H., Kitade, M., Moriya, K., Namisaki, T., Akahane, T., et al. (2017) · World Journal of Gastroenterology · doi:10.3748/wjg.v23.i47.8355 · Cited by 107
Decompensated cirrhosis and microbiome interpretation
Bajaj, J. S., Betrapally, N. S., & Gillevet, P. M. (2015) · Nature · doi:10.1038/nature14851 · Cited by 100
Self-citationMicrobiota-gut-brain research: A critical analysis
Hooks, K. B., Konsman, J. P., & O’Malley, M. A. (2018) · Behavioral and Brain Sciences · doi:10.1017/s0140525x18002133 · Cited by 109
The Gut-Liver Axis in Cholestatic Liver Diseases
Blesl, A., & Stadlbauer, V. (2021) · Nutrients · doi:10.3390/nu13031018 · Cited by 102
Soldi, S., Vasileiadis, S., Uggeri, F., Campanale, M. C., Morelli, L., Calanni, F., Grimaldi, M., Gasbarrini, A., & Fogli, M. V. (2015) · Clinical and Experimental Gastroenterology · doi:10.2147/ceg.s89999 · Cited by 98
Gut Microbiota and Complications of Liver Disease
Acharya, C., & Bajaj, J. S. (2017) · Gastroenterology Clinics of North America · doi:10.1016/j.gtc.2016.09.013 · Cited by 101
Rifaximin in nonalcoholic fatty liver disease: hit multiple targets with a single shot
Abdel‐Razik, A., Mousa, N., Shabana, W., Refaey, M., Elzehery, R. R., Elhelaly, R. M., Zalata, K., Abdelsalam, M., Eldeeb, A. A., Awad, M., et al. (2018) · European Journal of Gastroenterology & Hepatology · doi:10.1097/meg.0000000000001232 · Cited by 96
Merli, M., Lucidi, C., Gregorio, V. D., Giannelli, V., Giusto, M., Ceccarelli, G., Riggio, O., & Venditti, M. (2014) · Liver International · doi:10.1111/liv.12593 · Cited by 95
Microbiome therapeutics for hepatic encephalopathy
Bloom, P. P., Tapper, E. B., Young, V. B., & Lok, A. S.-F. (2021) · Journal of Hepatology · doi:10.1016/j.jhep.2021.08.004 · Cited by 96
Interaction of bacterial metagenome and virome in patients with cirrhosis and hepatic encephalopathy
Bajaj, J. S., Sikaroodi, M., Shamsaddini, A., Henseler, Z. M., Santiago-Rodríguez, T. M., Acharya, C., Fagan, A., Hylemon, P. B., Fuchs, M. A., Gavis, E. A., et al. (2020) · Gut · doi:10.1136/gutjnl-2020-322470 · Cited by 98
Rifaximin Exerts Beneficial Effects Independent of its Ability to Alter Microbiota Composition
Kang, D. J., Kakiyama, G., Betrapally, N. S., Herzog, J., Nittono, H., Hylemon, P. B., Zhou, H., Carroll, I. M., Yang, J., Gillevet, P. M., et al. (2016) · Clinical and Translational Gastroenterology · doi:10.1038/ctg.2016.44 · Cited by 97
Ahluwalia, V., Wade, J. B., Heuman, D. M., Hammeke, T. A., Sanyal, A. J., Sterling, R. K., Stravitz, R. T., Luketic, V., Siddiqui, M. S., Puri, P., et al. (2014) · Metabolic Brain Disease · doi:10.1007/s11011-014-9507-6 · Cited by 92
Bajaj, J. S., Betrapally, N. S., Hylemon, P. B., Thacker, L. R., Daita, K., Kang, D. J., White, M. B., Unser, A. B., Fagan, A., Gavis, E. A., et al. (2015) · Scientific Reports · doi:10.1038/srep18559 · Cited by 92
Gut : liver : brain axis: the microbial challenge in the hepatic encephalopathy
Mancini, A., Campagna, F., Amodio, P., & Tuohy, K. M. (2018) · Food & Function · doi:10.1039/c7fo01528c · Cited by 89
The burden of minimal hepatic encephalopathy: from diagnosis to therapeutic strategies
Ridola, L. (2018) · Annals of Gastroenterology · doi:10.20524/aog.2018.0232 · Cited by 90
Bajaj, J. S., Salzman, N. H., Acharya, C., Takei, H., Kakiyama, G., Fagan, A., White, M. B., Gavis, E. A., Holtz, M. L., Hayward, M., et al. (2019) · JCI Insight · doi:10.1172/jci.insight.133410 · Cited by 91
Tang, W., Meng, Z., Li, N., Liu, Y., Li, L., Chen, D., & Yang, Y. (2021) · Frontiers in Cellular and Infection Microbiology · doi:10.3389/fcimb.2020.611014 · Cited by 94
Gut Microbiome Perturbations Induced by Bacterial Infection Affect Arsenic Biotransformation
Lü, K., Cable, P. H., Abo, R., Ru, H., Graffam, M. E., Schlieper, K. A., Parry, N. M., Levine, S. S., Bodnar, W. M., Wishnok, J. S., et al. (2013) · Chemical Research in Toxicology · doi:10.1021/tx4002868 · Cited by 93
Effect of rifaximin on gut microbiota composition in advanced liver disease and its complications
Ponziani, F. R. (2015) · World Journal of Gastroenterology · doi:10.3748/wjg.v21.i43.12322 · Cited by 90
Obesity and Asthma: Microbiome–Metabolome Interactions
Shore, S. A., & Cho, Y. (2016) · American Journal of Respiratory Cell and Molecular Biology · doi:10.1165/rcmb.2016-0052ps · Cited by 86
Jayakumar, S., & Loomba, R. S. (2019) · Alimentary Pharmacology & Therapeutics · doi:10.1111/apt.15314 · Cited by 87
Bajaj, J. S., Sikaroodi, M., Fagan, A., Heuman, D. M., Gilles, H., Gavis, E. A., Fuchs, M. A., González‐Maeso, J., Nizam, S., Gillevet, P. M., et al. (2019) · American Journal of Physiology-Gastrointestinal and Liver Physiology · doi:10.1152/ajpgi.00194.2019 · Cited by 84
Mikkelsen, S. U., Allin, K. H., & Knop, F. K. (2016) · Diabetes Obesity and Metabolism · doi:10.1111/dom.12637 · Cited by 85
Novel perspectives in the management of decompensated cirrhosis
Bernardi, M., & Caraceni, P. (2018) · Nature Reviews Gastroenterology & Hepatology · doi:10.1038/s41575-018-0045-2 · Cited by 81
Tenorio, A. R., Chan, E. S., Bosch, R. J., Macatangay, B. J. C., Read, S. W., Yesmin, S., Taiwo, B., Margolis, D. M., Jacobson, J. M., LANDAY, A. L., et al. (2014) · The Journal of Infectious Diseases · doi:10.1093/infdis/jiu515 · Cited by 78
Pimentel, M. (2015) · Alimentary Pharmacology & Therapeutics · doi:10.1111/apt.13437 · Cited by 76
Tait, C., & Sayuk, G. S. (2021) · European Journal of Internal Medicine · doi:10.1016/j.ejim.2020.12.023 · Cited by 78
Żeber‐Lubecka, N., Kulecka, M., Ambrożkiewicz, F., Paziewska, A., Goryca, K., Karczmarski, J., Rubel, T., Wojtowicz, W., Młynarz, P., Marczak, Ł., et al. (2016) · Gut Microbes · doi:10.1080/19490976.2016.1215805 · Cited by 77
Intestinal microbiota in liver disease
Haque, T., & Barritt, A. S. (2016) · Best Practice & Research Clinical Gastroenterology · doi:10.1016/j.bpg.2016.02.004 · Cited by 76
Ghabril, M., Jackson, M., Gotur, R., Weber, R., Orman, E. S., Vuppalanchi, R., & Chalasani, N. (2017) · Clinical Gastroenterology and Hepatology · doi:10.1016/j.cgh.2017.01.027 · Cited by 76
Kimer, N., Pedersen, J. S., Busk, T. M., Gluud, L. L., Hobolth, L., Krag, A. A., Møller, S., Bendtsen, F., & Copenhagen Rifaximin (CoRif) Study Group (2016) · Hepatology · doi:10.1002/hep.28898 · Cited by 78
Metadata
- Authors
- Bajaj, J. S., Heuman, D. M., Sanyal, A. J., Hylemon, P. B., Sterling, R. K., Stravitz, R. T., Fuchs, M., Ridlon, J. M., Daita, K., Monteith, P., Noble, N. A., White, M. B., Fisher, A., Sikaroodi, M., Rangwala, H., & Gillevet, P. M.
- Affiliations
- Virginia Commonwealth University (US)
- George Mason University (US)
- Corresponding author
- Bajaj, Jasmohan S.
- ORCID
- Venue
- PLoS ONE
- Publisher
- Public Library of Science (PLoS)
- Published
- 2013-04-02
- Volume
- 8
- Issue
- 4
- Pages
- e60042
- ISSN
- 1932-6203 (ISSN-L)
- PMC
- PMC3615021
- OpenAlex
- W2138196119
- Cited by
- 430
- References
- 46
- Citations by year
- 2026: 19 · 2025: 27 · 2024: 34 · 2023: 34 · 2022: 25 · 2021: 40 · 2020: 31 · 2019: 37 · 2018: 45 · 2017: 27 · 2016: 31 · 2015: 43 · 2014: 25 · 2013: 9
- FWCI
- 22.45
- Type
- journal article
- Language
- en
- Open access
- gold
- doi.org
- Locations
- PLoS ONE (publishedVersion, cc-by)
- Europe PMC (PubMed Central) (publishedVersion, other-oa)
- PubMed Central (publishedVersion, cc-by)
- PubMed (publishedVersion)
- VCU Scholars Compass (Virginia Commonwealth University) (submittedVersion, cc-by)
- DOAJ (DOAJ: Directory of Open Access Journals) (submittedVersion)
- Figshare (submittedVersion, cc-by)
- Funders
- National Institutes of Health (UL1TR000058)
- University of California, Davis
- National Institute on Alcohol Abuse and Alcoholism (R01AA020203, RO1AA020203)
- National Institute of Diabetes and Digestive and Kidney Diseases (RO1AA020203, RO1DK087913, R01DK087913)
- National Center for Complementary and Alternative Medicine (RO1AA020203)
- National Center for Advancing Translational Sciences
- National Center for Complementary and Integrative Health (U01AT004428)
- Topics
- Health Sciences › Medicine › Hepatology › Liver Disease and Transplantation
- Life Sciences › Biochemistry, Genetics and Molecular Biology › Molecular Biology › Gut microbiota and health
- Health Sciences › Medicine › Gastroenterology › Gastrointestinal motility and disorders
- Keywords
- rifaximin, minimal hepatic encephalopathy, liver cirrhosis, gut microbiota, gut-brain axis, endotoxemia, cognitive function, serum metabolomics, urine metabolomics, fatty acids, Veillonellaceae, Enterobacteriaceae, Bacteroidaceae, Porphyromonadaceae
- MeSH terms
- Rifaximin, Cognition, Female, Hepatic Encephalopathy, Humans, Liver Cirrhosis, Male, Middle Aged, Rifamycins, Gastrointestinal Tract, Metagenome, Metabolomics, Metabolome
About these checks
Registry, retraction, Cites and statistics results are computed, not judged, with one exception: a printed reference that no index lists is read once by a model before it counts as a citation error. Claims are extracted by a model and kept only when their quote appears verbatim in the text; each cited source is then checked, with a model’s help, for whether it says what the claim relies on. Those verdicts can be wrong — read the claim’s quote and the cited source before relying on one.
Statistics and arithmetic are recomputed, not judged.
Confidence bands are shown only for fields calibrated on our annotated test set. None is calibrated yet, so no band is shown.
What counts as a claim ›How we measure confidence ›How we check this ›
Are you an author, or do you see a problem with this page? Request a review
