

The DOI matches its Crossref record; 28 of the 28 references it cites were found in a registry or an index.
Alzheimer's Associated β-Amyloid Protein Inhibits Influenza A Virus and Modulates Viral Interactions with Phagocytes
Open accessAbstract
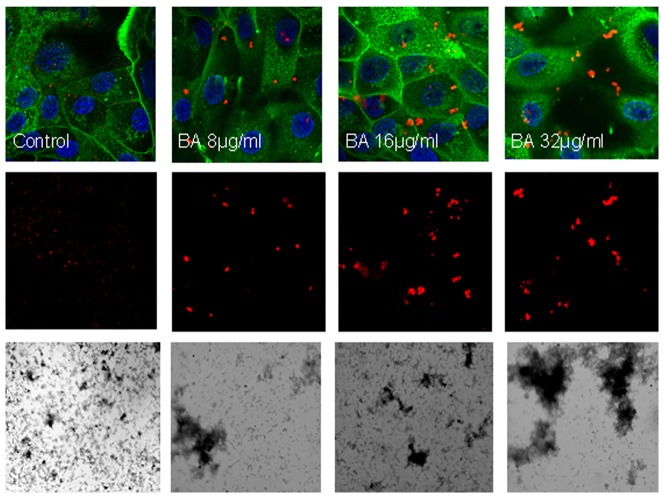
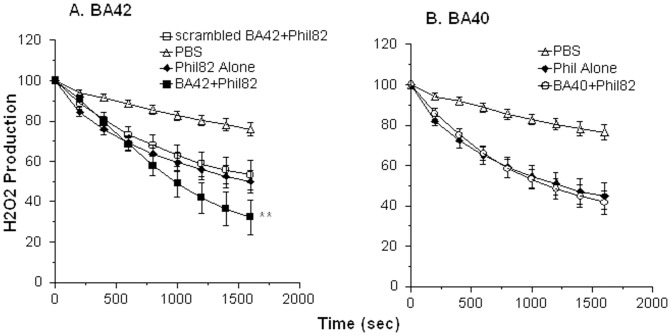
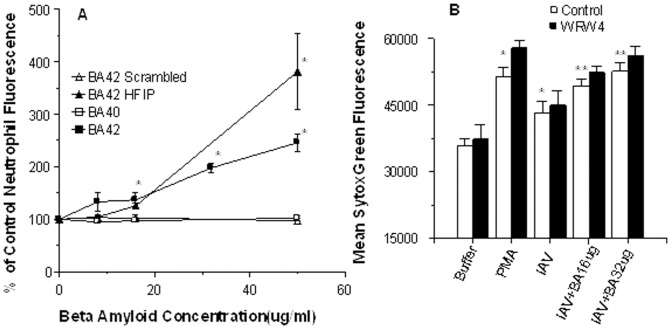
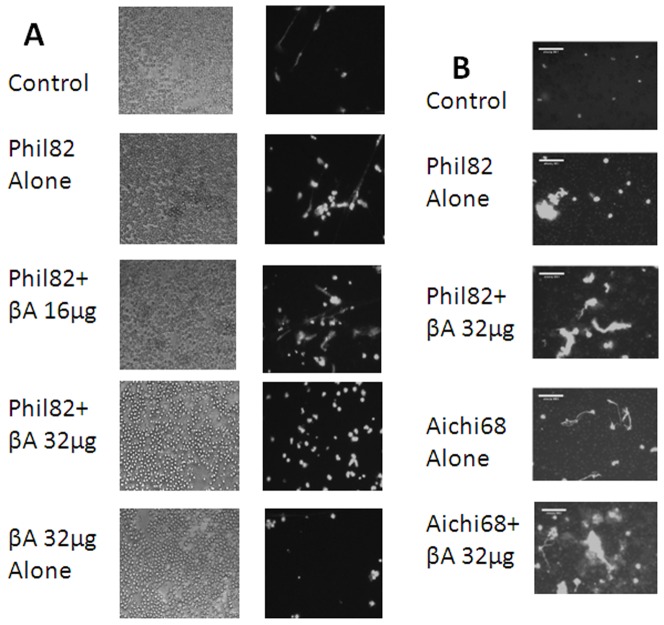
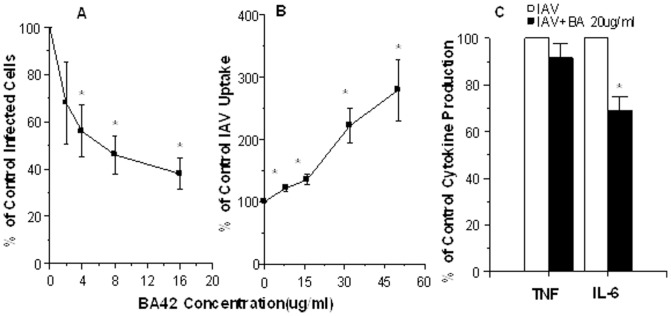
Accumulation of β-Amyloid (βA) is a key pathogenetic factor in Alzheimer's disease; however, the normal function of βA is unknown. Recent studies have shown that βA can inhibit growth of bacteria and fungi. In this paper we show that βA also inhibits replication of seasonal and pandemic strains of H3N2 and H1N1 influenza A virus (IAV) in vitro. The 42 amino acid fragment of βA (βA42) had greater activity than the 40 amino acid fragment. Direct incubation of the virus with βA42 was needed to achieve optimal inhibition. Using quantitative PCR assays βA42 was shown to reduce viral uptake by epithelial cells after 45 minutes and to reduce supernatant virus at 24 hours post infection. βA42 caused aggregation of IAV particles as detected by light transmission assays and electron and confocal microscopy. βA42 did not stimulate neutrophil H2O2 production or extracellular trap formation on its own, but it increased both responses stimulated by IAV. In addition, βA42 increased uptake of IAV by neutrophils. βA42 reduced viral protein synthesis in monocytes and reduced IAV-induced interleukin-6 production by these cells. Hence, we demonstrate for the first time that βA has antiviral activity and modulates viral interactions with phagocytes.
Overview
The claims and statistics of this paper haven’t been checked yet.
Run the check — free, no account needed. It reads the open-access text and checks the sources it cites.
Integrity signals
Registry
Cites
Statistics
Figures
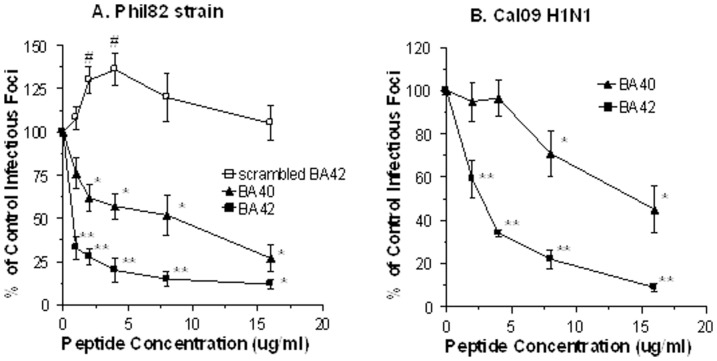
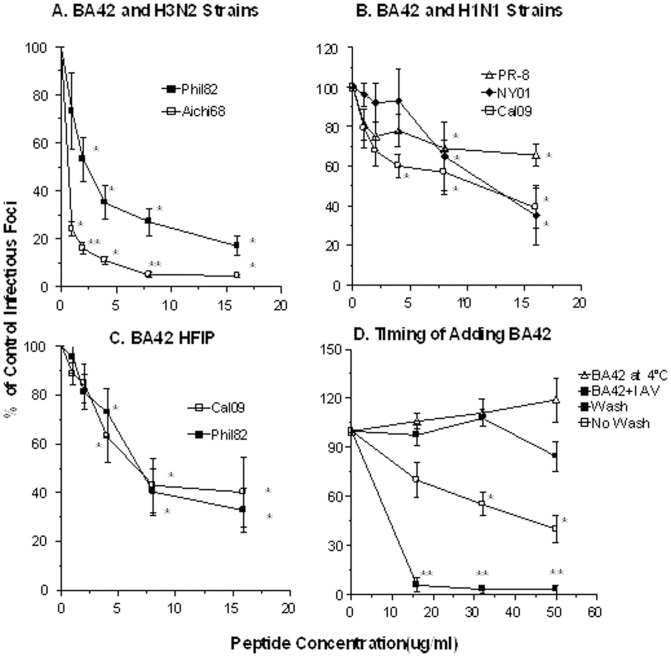
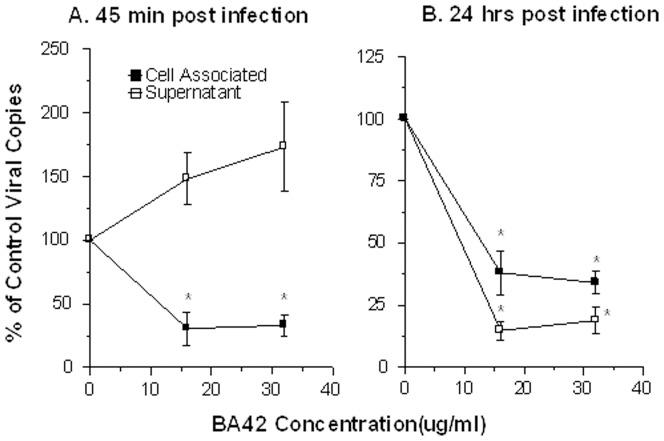
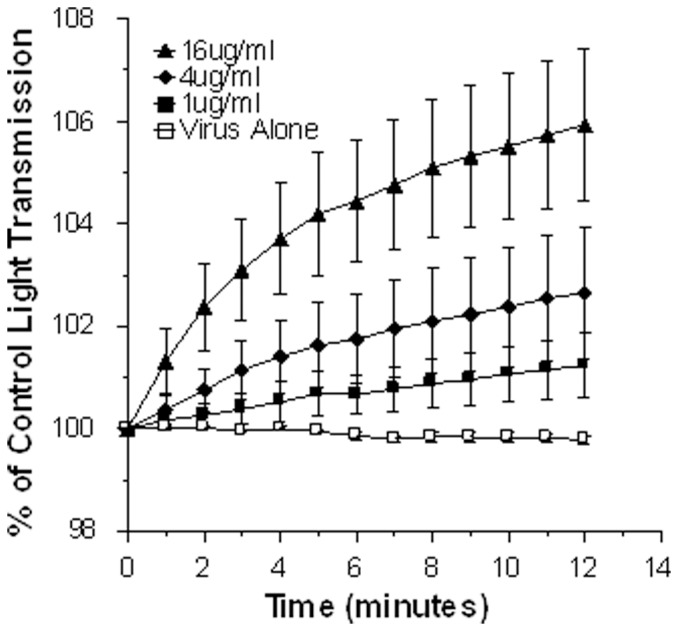
Verification
Claims the paper makes
The claims and statistics of this paper haven’t been checked yet.
Run the check — free, no account needed. It reads the open-access text and checks the sources it cites.
Claims other papers make about this one
Each is checked against this paper’s own text: does it say what the citing paper says it does?
The cited source says what the claim attributes to it.
In the citing paper
“Aβ42 can also suppress influenza A virus replication in vitro, and significantly increase the uptake of these viruses by neutrophils [112].”
From What would it take to prove that a chronic infection is a causal agent in Alzheimer’s disease? (2025) · cites this paper as [112]
The cited source says what the claim attributes to it.
In the citing paper
“Both Aβ42 and Aβ40 inhibited infectivity by influenza A.”
From What would it take to prove that a chronic infection is a causal agent in Alzheimer’s disease? (2025) · cites this paper as [112]
In the citing paper
“Other studies showed that Amyloid-β protein has antimicrobial properties [115], specifically against Influenza A [116]”
From Cognitive decline following acute viral infections: literature review and projections for post-COVID-19 (2022) · cites this paper as [116]
In the citing paper
“Aβ stimulated the aggregation of viral particles, which facilitated leukocyte-mediated uptake of viruses.405”
From Amyloid β-based therapy for Alzheimer’s disease: Challenges, successes and future (2023) · cites this paper as [405]
Self-check
Percentages, sums and reported differences re-computed from the paper’s own numbers.
The self-check needs the paper’s full text.
Citations
Cites
Isolation and quantification of soluble Alzheimer's β-peptide from biological fluids
Seubert, P., Vigo-Pelfrey, C., Esch, F., Lee, M., Dovey, H., Davis, D., Sinha, S., Schiossmacher, M., Whaley, J., Swindlehurst, C., et al. (1992) · Nature · doi:10.1038/359325a0 · Cited by 1,731
Oligomeric and fibrillar species of amyloid-β peptides differentially affect neuronal viability
Dahlgren, K. N., Manelli, A. M., Stine, W. B., Baker, L. K., Krafft, G. A., & LaDu, M. J. (2002) · Journal of Biological Chemistry · doi:10.1074/jbc.m201750200 · Cited by 1,452
The Alzheimer's Disease-Associated Amyloid β-Protein Is an Antimicrobial Peptide
Soscia, S. J., Kirby, J. E., Washicosky, K. J., Tucker, S. M., Ingelsson, M., Hyman, B., Burton, M. A., Goldstein, L. E., Duong, S., Tanzi, R. E., et al. (2010) · PLoS ONE · doi:10.1371/journal.pone.0009505 · Cited by 1,060
Alarmins: chemotactic activators of immune responses
Oppenheim, J. J., & Yang, D. (2005) · Current Opinion in Immunology · doi:10.1016/j.coi.2005.06.002 · Cited by 780
Biochemistry of Amyloid -Protein and Amyloid Deposits in Alzheimer DiseasePreprint
Masters, C. L., & Selkoe, D. J. (2012) · Cold Spring Harbor Perspectives in Medicine · doi:10.1101/cshperspect.a006262 · Cited by 554
Herpes simplex virus infection causes cellular β-amyloid accumulation and secretase upregulation
Wozniak, M. A., Itzhaki, R. F., Shipley, S. J., & Dobson, C. B. (2007) · Neuroscience Letters · doi:10.1016/j.neulet.2007.09.077 · Cited by 339
Fibrillar Amyloid-β Peptides Activate Microglia via TLR2: Implications for Alzheimer’s Disease
Jana, M., Palencia, C. A., & Pahan, K. (2008) · The Journal of Immunology · doi:10.4049/jimmunol.181.10.7254 · Cited by 338
Richard, K. L., Filali, M., Préfontaine, P., & Rivest, S. (2008) · The Journal of Neuroscience · doi:10.1523/jneurosci.1146-08.2008 · Cited by 298
Tripathi, S., Tecle, T., Verma, A., Crouch, E. C., White, M. R., & Hartshorn, K. L. (2012) · Journal of General Virology · doi:10.1099/vir.0.045013-0 · Cited by 213
Self-citationLurain, N. S., Hanson, B. A., Martinson, J., Leurgans, S. E., Landay, A. L., Bennett, D. A., & Schneider, J. A. (2013) · The Journal of Infectious Diseases · doi:10.1093/infdis/jit210 · Cited by 159
Cited by
Sorted by citations
Amyloid β-based therapy for Alzheimer’s disease: Challenges, successes and future
Zhang, Y., Chen, H., Li, R., Sterling, K., & Song, W. (2023) · Signal Transduction and Targeted Therapy · doi:10.1038/s41392-023-01484-7 · Cited by 988
“Aβ stimulated the aggregation of viral particles, which facilitated leukocyte-mediated uptake of viruses.(405) In addition, the damaged host cells released nucleic acids containing Aβ aggregates, which were immunogenic and elicited the secretion of type I interferons (IFNs) by adjacent microglia to accomplish the anti…”
BackgroundKumar, D. K. V., Choi, S. H., Washicosky, K. J., Eimer, W. A., Tucker, S., Ghofrani, J., Lefkowitz, A., McColl, G., Goldstein, L. E., Tanzi, R. E., et al. (2016) · Science Translational Medicine · doi:10.1126/scitranslmed.aaf1059 · Cited by 971
Eimer, W. A., Vijaya Kumar, D. K., Navalpur Shanmugam, N. K., Rodriguez, A. S., Mitchell, T., Washicosky, K. J., György, B., Breakefield, X. O., Tanzi, R. E., & Moir, R. D. (2018) · Neuron · doi:10.1016/j.neuron.2018.06.030 · Cited by 674
Microbes and Alzheimer’s Disease
Itzhaki, R. F., Lathe, R., Balin, B. J., Ball, M. J., Bearer, E. L., Braak, H., Bullido, M. J., Carter, C., Clerici, M., Cosby, S. L., et al. (2016) · Journal of Alzheimer’s Disease · doi:10.3233/jad-160152 · Cited by 532
The antimicrobial protection hypothesis of Alzheimer’s disease
Moir, R. D., Lathe, R., & Tanzi, R. E. (2018) · Alzheimer's & Dementia · doi:10.1016/j.jalz.2018.06.3040 · Cited by 456
The role of astrocytes in amyloid production and Alzheimer's disease
Frost, G. R., & Li, Y. (2017) · Open Biology · doi:10.1098/rsob.170228 · Cited by 448
Self-assembling dipeptide antibacterial nanostructures with membrane disrupting activity
Schnaider, L., Brahmachari, S., Schmidt, N. W., Mensa, B., Shaham‐Niv, S., Bychenko, D., Adler‐Abramovich, L., Shimon, L. J. W., Kolusheva, S., DeGrado, W. F., et al. (2017) · Nature Communications · doi:10.1038/s41467-017-01447-x · Cited by 411
The Infectious Etiology of Alzheimer’s Disease
Sochocka, M., Zwolińska, K., & Leszek, J. (2017) · Current Neuropharmacology · doi:10.2174/1570159x15666170313122937 · Cited by 399
The Physiological Roles of Amyloid-β Peptide Hint at New Ways to Treat Alzheimer's Disease
Brothers, H. M., Gosztyla, M. L., & Robinson, S. R. (2018) · Frontiers in Aging Neuroscience · doi:10.3389/fnagi.2018.00118 · Cited by 314
Periodontal disease associates with higher brain amyloid load in normal elderly
Kamer, A. R., Pirraglia, E., Tsui, W., Rusinek, H., Vallabhajosula, S., Mosconi, L., Li, Y., McHugh, P. F., Craig, R. G., Svetcov, S., et al. (2014) · Neurobiology of Aging · doi:10.1016/j.neurobiolaging.2014.10.038 · Cited by 276
Alzheimer’s Amyloid-β is an Antimicrobial Peptide: A Review of the Evidence
Gosztyla, M. L., Brothers, H. M., & Robinson, S. R. (2018) · Journal of Alzheimer s Disease · doi:10.3233/jad-171133 · Cited by 245
Bourgade, K., Garneau, H., Giroux, G., Le Page, A. Y., Bocti, C., Dupuis, G., Frost, E. H., & Fülöp, T. (2015) · Biogerontology · doi:10.1007/s10522-014-9538-8 · Cited by 208
Duarte, L. F., Farías, M. A., Álvarez, D. M., Bueno, S. M., Riedel, C. A., & González, P. A. (2019) · Frontiers in Cellular Neuroscience · doi:10.3389/fncel.2019.00046 · Cited by 192
The Possibility of an Infectious Etiology of Alzheimer Disease
Ashraf, G. M., Tarasov, V. V., Makhmutovа, A., Chubarev, V. N., Avila-Rodriguez, M., Bachurin, S. O., & Aliev, G. (2019) · Molecular Neurobiology · doi:10.1007/s12035-018-1388-y · Cited by 175
From inflamm-aging to immune-paralysis: a slippery slope during aging for immune-adaptation
Fülöp, T., Dupuis, G., Baëhl, S., Page, A. Y. L., Bourgade, K., Frost, E. H., Witkowski, J. M., Pawelec, G., Larbi, A., & Cunnane, S. C. (2015) · Biogerontology · doi:10.1007/s10522-015-9615-7 · Cited by 166
Time to test antibacterial therapy in Alzheimer’s disease
Panza, F., Lozupone, M., Solfrizzi, V., Watling, M., & Imbimbo, B. P. (2019) · Brain · doi:10.1093/brain/awz244 · Cited by 161
Harris, S. S., Wolf, F., De Strooper, B., & Busche, M. A. (2020) · Neuron · doi:10.1016/j.neuron.2020.06.005 · Cited by 161
Bourgade, K., Le Page, A., Bocti, C., Witkowski, J. M., Dupuis, G., Frost, E. H., & Fülöp, T. (2016) · Journal of Alzheimer’s Disease · doi:10.3233/jad-150652 · Cited by 161
Molecular Mechanisms for Herpes Simplex Virus Type 1 Pathogenesis in Alzheimer’s Disease
Harris, S. A., & Harris, E. A. (2018) · Frontiers in Aging Neuroscience · doi:10.3389/fnagi.2018.00048 · Cited by 154
Cerovic, M., Forloni, G., & Balducci, C. (2019) · Frontiers in Aging Neuroscience · doi:10.3389/fnagi.2019.00284 · Cited by 127
Fülöp, T., Itzhaki, R. F., Balin, B. J., Miklossy, J., & Barron, A. E. (2018) · Frontiers in Genetics · doi:10.3389/fgene.2018.00362 · Cited by 123
Human Herpesvirus 6 Detection in Alzheimer’s Disease Cases and Controls across Multiple Cohorts
Allnutt, M. A., Johnson, K., Bennett, D. A., Connor, S. M., Troncoso, J. C., Pletnikova, O., Albert, M. S., Resnick, S. M., Scholz, S. W., De Jager, P. L., et al. (2020) · Neuron · doi:10.1016/j.neuron.2019.12.031 · Cited by 119
Herpes simplex virus type 1 and Alzheimer's disease: possible mechanisms and signposts
Itzhaki, R. F. (2017) · The FASEB Journal · doi:10.1096/fj.201700360 · Cited by 120
Li, H., Liu, C.-C., Zheng, H., & Huang, T. Y. (2018) · Translational Neurodegeneration · doi:10.1186/s40035-018-0139-3 · Cited by 103
Lövheim, H., Olsson, J., Weidung, B., Johansson, A., Eriksson, S., Hallmans, G., & Elgh, F. (2018) · Journal of Alzheimer’s Disease · doi:10.3233/jad-161305 · Cited by 103
Microbial Infections Are a Risk Factor for Neurodegenerative Diseases
Lotz, S. K., Blackhurst, B. M., Reagin, K. L., & Funk, K. E. (2021) · Frontiers in Cellular Neuroscience · doi:10.3389/fncel.2021.691136 · Cited by 100
Damiano, R. F., Guedes, B. F., de Rocca, C. C., de Pádua Serafim, A., Castro, L. H. M., Munhoz, C. D., Nitrini, R., Filho, G. B., Miguel, E. C., Lucchetti, G., et al. (2022) · European Archives of Psychiatry and Clinical Neuroscience · doi:10.1007/s00406-021-01286-4 · Cited by 98
Anti-Viral Properties of Amyloid-β Peptides
Bourgade, K., Dupuis, G., Frost, E. H., & Fülöp, T. (2016) · Journal of Alzheimer s Disease · doi:10.3233/jad-160517 · Cited by 97
Carter, C., France, J., Crean, S., & Singhrao, S. K. (2017) · Frontiers in Aging Neuroscience · doi:10.3389/fnagi.2017.00408 · Cited by 102
Khatri, K., Klein, J., White, M. R., Grant, O. C., Leymarie, N., Woods, R. J., Hartshorn, K. L., & Zaia, J. (2016) · Molecular & Cellular Proteomics · doi:10.1074/mcp.m116.058016 · Cited by 93
Self-citationVojtechova, I., Machacek, T., Kristofikova, Z., Stuchlik, A., & Petrasek, T. (2022) · PLOS Pathogens · doi:10.1371/journal.ppat.1010929 · Cited by 92
Viral Involvement in Alzheimer’s Disease
Sait, A. M., Angeli, C., Doig, A. J., & Day, P. J. (2021) · ACS Chemical Neuroscience · doi:10.1021/acschemneuro.0c00719 · Cited by 90
Alzheimer’s disease as a viral disease: Revisiting the infectious hypothesis
Bruno, F., Abondio, P., Bruno, R., Ceraudo, L., Paparazzo, E., Citrigno, L., Luiselli, D., Bruni, A. C., Passarino, G., Colao, R., et al. (2023) · Ageing Research Reviews · doi:10.1016/j.arr.2023.102068 · Cited by 88
Hsieh, I.-N., & Hartshorn, K. L. (2016) · Pharmaceuticals · doi:10.3390/ph9030053 · Cited by 86
Self-citationRebuli, M. E., Glista-Baker, E. E., Hoffman, J. R., Duffney, P. F., Robinette, C., Speen, A. M., Pawlak, E. A., Dhingra, R., Noah, T. L., & Jaspers, I. (2020) · American Journal of Respiratory Cell and Molecular Biology · doi:10.1165/rcmb.2020-0164oc · Cited by 81
Human Herpesviruses 6A and 6B in Brain Diseases: Association versus Causation
Komaroff, A. L., Pellett, P. E., & Jacobson, S. (2020) · Clinical Microbiology Reviews · doi:10.1128/cmr.00143-20 · Cited by 77
Herpes and Alzheimer’s Disease: Subversion in the Central Nervous System and How It Might Be Halted
Itzhaki, R. F. (2016) · Journal of Alzheimer s Disease · doi:10.3233/jad-160607 · Cited by 76
Carter, C. (2017) · Journal of Alzheimer s Disease Reports · doi:10.3233/adr-170017 · Cited by 74
Kucheryavykh, L. Y., Dávila-Rodríguez, J., Rivera-Aponte, D. E., Zueva, L. V., Washington, A. V., Sanabria, P., & Inyushin, M. Y. (2016) · Brain Research Bulletin · doi:10.1016/j.brainresbull.2016.11.008 · Cited by 70
Alzheimer's disease and symbiotic microbiota: an evolutionary medicine perspective
Fox, M. M., Knorr, D. A., & Haptonstall, K. P. (2019) · Annals of the New York Academy of Sciences · doi:10.1111/nyas.14129 · Cited by 67
Page, A. Y. L., Garneau, H., Dupuis, G., Frost, E. H., Larbi, A., Witkowski, J. M., Pawelec, G., & Fülöp, T. (2017) · Frontiers in Immunology · doi:10.3389/fimmu.2017.00783 · Cited by 67
A mechanistic survey of Alzheimer's disease
Tang, Y., Zhang, D., Gong, X., & Zheng, J. (2021) · Biophysical Chemistry · doi:10.1016/j.bpc.2021.106735 · Cited by 66
Arginine-rich histones have strong antiviral activity for influenza A viruses
Hoeksema, M., Tripathi, S., White, M. R., Qi, L., Taubenberger, J. K., van Eijk, M., Haagsman, H. P., & Hartshorn, K. L. (2015) · Innate Immunity · doi:10.1177/1753425915593794 · Cited by 63
Self-citationAmyloid-β: A double agent in Alzheimer's disease?
Yu, H., & Wu, J. (2021) · Biomedicine & Pharmacotherapy · doi:10.1016/j.biopha.2021.111575 · Cited by 62
Kristen, H., Santana, S., Sastre, I., Recuero, M., Bullido, M. J., & Aldudo, J. (2015) · Neurobiology of Aging · doi:10.1016/j.neurobiolaging.2015.06.014 · Cited by 61
Liu, S., Gao, J., Liu, K., & Zhang, H. (2021) · Mechanisms of Ageing and Development · doi:10.1016/j.mad.2021.111560 · Cited by 59
Physiological Roles of Monomeric Amyloid-β and Implications for Alzheimer’s Disease Therapeutics
Jeong, H., Shin, H., Hong, S., & Kim, Y. S. (2022) · Experimental Neurobiology · doi:10.5607/en22004 · Cited by 59
Anti-herpetic tau preserves neurons via the cGAS-STING-TBK1 pathway in Alzheimer’s disease
Hyde, V. R., Zhou, C., y Fernández, J. R. M., Chatterjee, K., Ramakrishna, P., Lin, A., Fisher, G. W., Celiker, O. T., Caldwell, J., Bender, O., et al. (2025) · Cell Reports · doi:10.1016/j.celrep.2024.115109 · Cited by 61
The Use of Antimicrobial and Antiviral Drugs in Alzheimer’s Disease
Iqbal, U., Zeng, E., & Pasinetti, G. M. (2020) · International Journal of Molecular Sciences · doi:10.3390/ijms21144920 · Cited by 55
Exploring pathological link between antimicrobial and amyloid peptides
Tang, Y., Zhang, Y., Zhang, D., Liu, Y., Nussinov, R., & Zheng, J. (2024) · Chemical Society Reviews · doi:10.1039/d3cs00878a · Cited by 53
The Role of Amyloid-Beta and Tau in the Early Pathogenesis of Alzheimer’s Disease
Yin, X., Qiu, Y., Zhao, C., Zhou, Z., Bao, J., & Qian, W. (2021) · Medical Science Monitor · doi:10.12659/msm.933084 · Cited by 48
‘Evolutionary medicine’ perspectives on Alzheimer’s Disease: Review and new directions
Fox, M. M. (2018) · Ageing Research Reviews · doi:10.1016/j.arr.2018.07.008 · Cited by 48
Why does the Aβ peptide of Alzheimer share structural similarity with antimicrobial peptides?
Pastore, A., Raimondi, F., Rajendran, L., & Temussi, P. A. (2020) · Communications Biology · doi:10.1038/s42003-020-0865-9 · Cited by 48
Hosseini, S., Michaelsen‐Preusse, K., Schughart, K., & Körte, M. (2021) · Frontiers in Cellular Neuroscience · doi:10.3389/fncel.2021.643650 · Cited by 46
Zhang, Y., Liu, Y., Tang, Y., Zhang, D., He, H., Wu, J., & Zheng, J. (2021) · Chemical Science · doi:10.1039/d1sc01133b · Cited by 46
Amyloid peptides with antimicrobial and/or microbial agglutination activity
Chen, D., Liu, X., Chen, Y., & Lin, H. (2022) · Applied Microbiology and Biotechnology · doi:10.1007/s00253-022-12246-w · Cited by 44
Toxoplasma gondii: A possible etiologic agent for Alzheimer's disease
Nayeri, T., Sarvi, S., Sharif, M., & Daryani, A. (2021) · Heliyon · doi:10.1016/j.heliyon.2021.e07151 · Cited by 46
HSV presence in brains of individuals without dementia: the TASTY brain series
Olsson, J., Lövheim, H., Honkala, E., Karhunen, P. J., Elgh, F., & Kok, E. (2016) · Disease Models & Mechanisms · doi:10.1242/dmm.026674 · Cited by 43
The Cryo-EM structures of two amphibian antimicrobial cross-β amyloid fibrils
Bücker, R., Seuring, C., Cazey, C., Veith, K., García-Alai, M., Grünewald, K., & Landau, M. (2022) · Nature Communications · doi:10.1038/s41467-022-32039-z · Cited by 46
Platelet-generated amyloid beta peptides in Alzheimer's disease and glaucoma.
Inyushin, M. Y., Zayas‐Santiago, A., Rojas, L. V., Kucheryavykh, Y. V., & Kucheryavykh, L. Y. (2019) · PubMed · doi:10.14670/hh-18-111 · Cited by 40
On the Role of Platelet-Generated Amyloid Beta Peptides in Certain Amyloidosis Health Complications
Inyushin, M. Y., Zayas‐Santiago, A., Rojas, L. V., & Kucheryavykh, L. Y. (2020) · Frontiers in Immunology · doi:10.3389/fimmu.2020.571083 · Cited by 43
Impact of Gut Microbiome Manipulation in 5xFAD Mice on Alzheimer’s Disease-Like Pathology
Guilherme, M. D. S., Nguyen, V. T. T., Reinhardt, C., & Endres, K. (2021) · Microorganisms · doi:10.3390/microorganisms9040815 · Cited by 38
Catumbela, C. S. G., Giridharan, V. V., Barichello, T., & Morales, R. (2023) · Translational Neurodegeneration · doi:10.1186/s40035-023-00369-7 · Cited by 37
Abrahamson, E. E., Zheng, W., Muralidaran, V., Ikonomović, M. D., Bloom, D. C., Nimgaonkar, V. L., & D’Aiuto, L. (2020) · Journal of Virology · doi:10.1128/jvi.02219-20 · Cited by 39
Mechanisms and therapeutic potential of interactions between human amyloids and viruses
Michiels, E., Rousseau, F., & Schymkowitz, J. W. H. (2020) · Cellular and Molecular Life Sciences · doi:10.1007/s00018-020-03711-8 · Cited by 37
Targeting Infectious Agents as a Therapeutic Strategy in Alzheimer’s Disease
Fülöp, T., Munawara, U., Larbi, A., Desroches, M., Rodrigues, S., Catanzaro, M., Guidolin, A., Khalil, A., Bernier, F., Barron, A. E., et al. (2020) · CNS Drugs · doi:10.1007/s40263-020-00737-1 · Cited by 32
Biotic/Abiotic Stress-Driven Alzheimer's Disease
Li, C., Zheng, Q., Wang, Q., & Zeng, Q.-P. (2016) · Frontiers in Cellular Neuroscience · doi:10.3389/fncel.2016.00269 · Cited by 33
West Nile Virus-Induced Neurologic Sequelae—Relationship to Neurodegenerative Cascades and Dementias
Vittor, A. Y., Long, M. T., Chakrabarty, P., Aycock, L., Kollu, V., & DeKosky, S. T. (2020) · Current Tropical Medicine Reports · doi:10.1007/s40475-020-00200-7 · Cited by 32
Specificity of Adaptive Immune Responses in Central Nervous System Health, Aging and Diseases
Rickenbach, C., & Gericke, C. (2022) · Frontiers in Neuroscience · doi:10.3389/fnins.2021.806260 · Cited by 33
Andreadou, E. G., Katsipis, G., Tsolaki, M., & Pantazaki, A. A. (2021) · Journal of Neuroimmunology · doi:10.1016/j.jneuroim.2021.577561 · Cited by 31
Accumulation of amyloid beta in human glioblastomas
Zayas‐Santiago, A., Díaz-García, A., Nuñez-Rodríguez, R., & Inyushin, M. Y. (2020) · Clinical & Experimental Immunology · doi:10.1111/cei.13493 · Cited by 32
Licastro, F., Carbone, I., Raschi, E., & Porcellini, E. (2014) · Immunity & Ageing · doi:10.1186/s12979-014-0022-8 · Cited by 30
Gour, S., Kumar, V., Singh, A. K., Gadhave, K., Goyal, P., Pandey, J., Giri, R., & Yadav, J. K. (2019) · Journal of Peptide Science · doi:10.1002/psc.3151 · Cited by 28
AβPeptide Originated from Platelets Promises New Strategy in Anti-Alzheimer’s Drug Development
Inyushin, M. Y., Sanabria, P., Rojas, L. V., Kucheryavykh, Y. V., & Kucheryavykh, L. Y. (2017) · BioMed Research International · doi:10.1155/2017/3948360 · Cited by 30
Wu, C., Chu, C., Wang, F., Yang, H., Tseng, W.-S., Chang, C., & Chang, C. (2022) · Cell & Bioscience · doi:10.1186/s13578-022-00897-1 · Cited by 32
Moir, R. D., & Tanzi, R. E. (2019) · Frontiers in Aging Neuroscience · doi:10.3389/fnagi.2019.00070 · Cited by 29
Chasman, D. A., Walters, K., Lopes, T. J. S., Eisfeld, A. J., Kawaoka, Y., & Roy, S. (2016) · PLoS Computational Biology · doi:10.1371/journal.pcbi.1005013 · Cited by 28
Prion Protein PRNP: A New Player in Innate Immunity? The Aβ Connection
Lathe, R., & Darlix, J. (2017) · Journal of Alzheimer s Disease Reports · doi:10.3233/adr-170037 · Cited by 28
Han, Y., Chen, L., Guo, Y., Wang, C., Zhang, C., Kong, L., & Ma, H. (2021) · Frontiers in Aging Neuroscience · doi:10.3389/fnagi.2020.619866 · Cited by 26
Targeting Impaired Antimicrobial Immunity in the Brain for the Treatment of Alzheimer’s Disease
Fülöp, T., Tripathi, S., Rodrigues, S., Desroches, M., Bunt, T., Eiser, A. R., Bernier, F., Beauregard, P. B., Barron, A. E., Khalil, A., et al. (2021) · Neuropsychiatric Disease and Treatment · doi:10.2147/ndt.s264910 · Cited by 27
Self-citationThe antimicrobial protein, CAP37, is upregulated in pyramidal neurons during Alzheimer’s disease
Brock, A. J., Kasus‐Jacobi, A., Lerner, M. R., Logan, S., Adesina, A. M., & Pereira, H. A. (2015) · Histochemistry and Cell Biology · doi:10.1007/s00418-015-1347-x · Cited by 26
Regulatory Roles of Antimicrobial Peptides in the Nervous System: Implications for Neuronal Aging
Stuart, B. A. R., Franitza, A. L., & Lezi, E. (2022) · Frontiers in Cellular Neuroscience · doi:10.3389/fncel.2022.843790 · Cited by 28
Chakraborty, S., Chatterjee, R., & Chakravortty, D. (2022) · Computational and Structural Biotechnology Journal · doi:10.1016/j.csbj.2022.05.002 · Cited by 28
Nitric Oxide Influences HSV-1-Induced Neuroinflammation
Cymerys, J., Kowalczyk, A., Mikołajewicz, K., Słońska, A., & Krzyżowska, M. (2019) · Oxidative Medicine and Cellular Longevity · doi:10.1155/2019/2302835 · Cited by 26
Antimicrobial peptides for novel antiviral strategies in the current post‐COVID‐19 pandemic
Loffredo, M. R., Nencioni, L., Mangoni, M. L., & Casciaro, B. (2023) · Journal of Peptide Science · doi:10.1002/psc.3534 · Cited by 25
Human antimicrobial peptide LL-37 contributes to Alzheimer’s disease progression
Chen, X., Deng, S., Wang, W., Castiglione, S., Duan, Z., Luo, L., Cianci, F., Zhang, X., Xu, J., Li, H., et al. (2022) · Molecular Psychiatry · doi:10.1038/s41380-022-01790-6 · Cited by 25
Eimer, W. A., Rodriguez, A. S., DeFao, M. T., Ehricke, S., Park, J., Kumar, D. K. V., Shanmugam, N. K. N., Singh, S., Sawhney, T., Moir, R. D., et al. (2025) · Nature Neuroscience · doi:10.1038/s41593-025-02157-0 · Cited by 32
Xiao, J., Savonenko, A. V., & Yolken, R. H. (2022) · Neuroscience & Biobehavioral Reviews · doi:10.1016/j.neubiorev.2022.104660 · Cited by 23
Natural Antimicrobial Peptides Self-assemble as α/β Chameleon Amyloids
Ragonis‐Bachar, P., Rayan, B., Barnea, E., Engelberg, Y., Upcher, A., & Landau, M. (2022) · Biomacromolecules · doi:10.1021/acs.biomac.2c00582 · Cited by 27
White, M. R., Kandel, R., Hsieh, I.-N., Luna, X. D., & Hartshorn, K. L. (2018) · PLoS ONE · doi:10.1371/journal.pone.0194001 · Cited by 23
Self-citationPersistent infections, immune-senescence and Alzheimer's disease
Licastro, F., & Porcellini, E. (2016) · Oncoscience · doi:10.18632/oncoscience.309 · Cited by 21
Peripheral Pathways to Neurovascular Unit Dysfunction, Cognitive Impairment, and Alzheimer’s Disease
Nelson, A. R. (2022) · Frontiers in Aging Neuroscience · doi:10.3389/fnagi.2022.858429 · Cited by 24
Emery, D. C., Davies, M., Cerajewska, T. L., Taylor, J., Hazell, M., Paterson, A. R., Allen, S. J., & West, N. X. (2022) · Frontiers in Aging Neuroscience · doi:10.3389/fnagi.2022.1026260 · Cited by 24
Charonis, S. A., James, L. M., & Georgopoulos, A. P. (2020) · Current Research in Translational Medicine · doi:10.1016/j.retram.2020.06.002 · Cited by 21
DNA from multiple viral species is associated with Alzheimer's disease risk
Tejeda, M., Farrell, J. J., Zhu, C., Wetzler, L. M., Lunetta, K. L., Bush, W. S., Martin, E. R., Wang, L., Schellenberg, G. D., Pericak‐Vance, M. A., et al. (2023) · Alzheimer s & Dementia · doi:10.1002/alz.13414 · Cited by 19
What can AlphaFold do for antimicrobial amyloids?
Ragonis‐Bachar, P., Axel, G., Blau, S., Ben‐Tal, N., Kolodny, R., & Landau, M. (2023) · Proteins Structure Function and Bioinformatics · doi:10.1002/prot.26618 · Cited by 23
Amyloid Beta Peptide Is Released during Thrombosis in the Skin
Kucheryavykh, L. Y., Kucheryavykh, Y. V., Washington, A. V., & Inyushin, M. Y. (2018) · International Journal of Molecular Sciences · doi:10.3390/ijms19061705 · Cited by 20
Alzheimer’s Disease Genetics: A Dampened Microglial Response?
Chatila, Z. K., & Bradshaw, E. M. (2021) · The Neuroscientist · doi:10.1177/10738584211024531 · Cited by 20
Wei, K., Kong, W., & Wang, S. (2021) · Journal of Molecular Neuroscience · doi:10.1007/s12031-021-01888-6 · Cited by 19
Tang, Y., Zhang, D., Gong, X., & Zheng, J. (2022) · Chemical Science · doi:10.1039/d2sc01447e · Cited by 19
Metadata
- Authors
- White, M. R., Kandel, R., Tripathi, S., Condon, D., Qi, L., Taubenberger, J., & Hartshorn, K. L.
- Affiliations
- Boston University (US)
- Harvard University (US)
- National Institute of Allergy and Infectious Diseases (US)
- Corresponding author
- Hartshorn, Kevan L.
- Venue
- PLoS ONE
- Publisher
- Public Library of Science (PLoS)
- Published
- 2014-07-02
- Volume
- 9
- Issue
- 7
- Pages
- e101364
- ISSN
- 1932-6203 (ISSN-L)
- PMC
- PMC4079246
- OpenAlex
- W2164223927
- Cited by
- 193
- References
- 28
- Citations by year
- 2026: 13 · 2025: 19 · 2024: 15 · 2023: 13 · 2022: 32 · 2021: 23 · 2020: 18 · 2019: 13 · 2018: 12 · 2017: 12 · 2016: 15 · 2015: 4 · 2014: 4
- FWCI
- 8.84
- Type
- journal article
- Language
- en
- Open access
- gold
- doi.org
- Licence
- Locations
- PLoS ONE (publishedVersion, public-domain)
- Europe PMC (PubMed Central) (publishedVersion, public-domain)
- PubMed Central (publishedVersion, public-domain)
- PubMed (publishedVersion)
- Digital Access to Scholarship at Harvard (DASH) (Harvard University) (submittedVersion, cc-by)
- DOAJ (DOAJ: Directory of Open Access Journals) (submittedVersion, cc-by-sa)
- Funders
- National Institutes of Health
- National Heart, Lung, and Blood Institute (R01HL069031, HL-069031)
- National Institute of Allergy and Infectious Diseases (AI-83222, P01AI083222)
- Topics
- Health Sciences › Medicine › Epidemiology › Influenza Virus Research Studies
- Life Sciences › Neuroscience › Cellular and Molecular Neuroscience › Alzheimer's disease research and treatments
- Life Sciences › Neuroscience › Neurology › Neuroinflammation and Neurodegeneration Mechanisms
- Keywords
- amyloid-beta, Alzheimer's disease, influenza A virus, antiviral activity, amyloid-beta 42, H3N2, H1N1, viral replication inhibition, viral uptake, virus aggregation, neutrophils, neutrophil extracellular traps, hydrogen peroxide, monocytes, interleukin-6, phagocytes
- MeSH terms
- Animals, Antiviral Agents, Cell Line, Humans, Influenza, Human, Monocytes, Neutrophils, Orthomyxoviridae Infections, Influenza A virus, Peptide Fragments, Phagocytes, Amyloid beta-Peptides, Influenza A Virus, H1N1 Subtype, Influenza A Virus, H3N2 Subtype, Host-Pathogen Interactions
About these checks
Registry, retraction, Cites and statistics results are computed, not judged, with one exception: a printed reference that no index lists is read once by a model before it counts as a citation error. Claims are extracted by a model and kept only when their quote appears verbatim in the text; each cited source is then checked, with a model’s help, for whether it says what the claim relies on. Those verdicts can be wrong — read the claim’s quote and the cited source before relying on one.
Statistics and arithmetic are recomputed, not judged.
Confidence bands are shown only for fields calibrated on our annotated test set. None is calibrated yet, so no band is shown.
What counts as a claim ›How we measure confidence ›How we check this ›
Are you an author, or do you see a problem with this page? Request a review
