

The DOI matches its Crossref record; 137 of the 137 references it cites were found in a registry or an index.
Enteric Bacterial Metabolites Propionic and Butyric Acid Modulate Gene Expression, Including CREB-Dependent Catecholaminergic Neurotransmission, in PC12 Cells - Possible Relevance to Autism Spectrum Disorders
Open accessAbstract
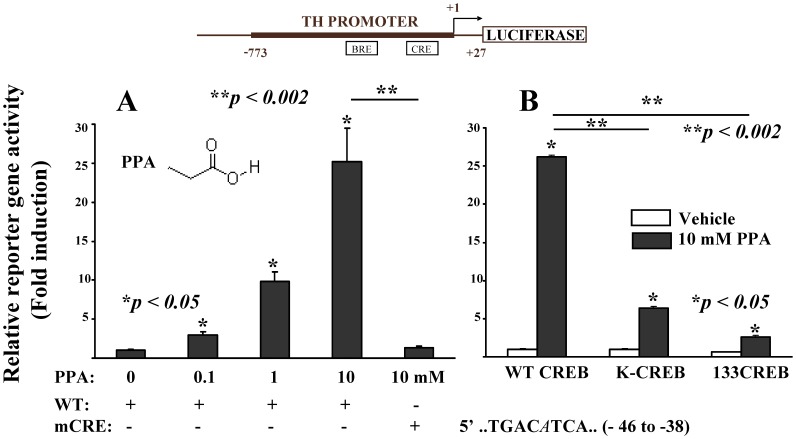
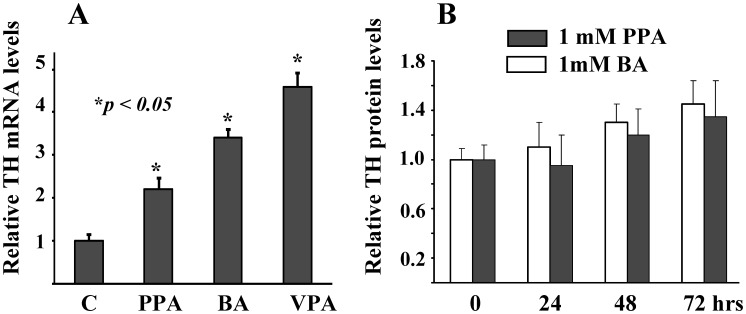
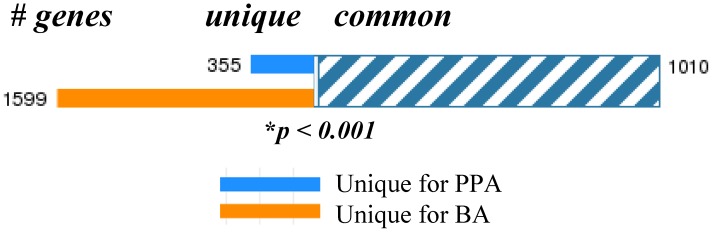
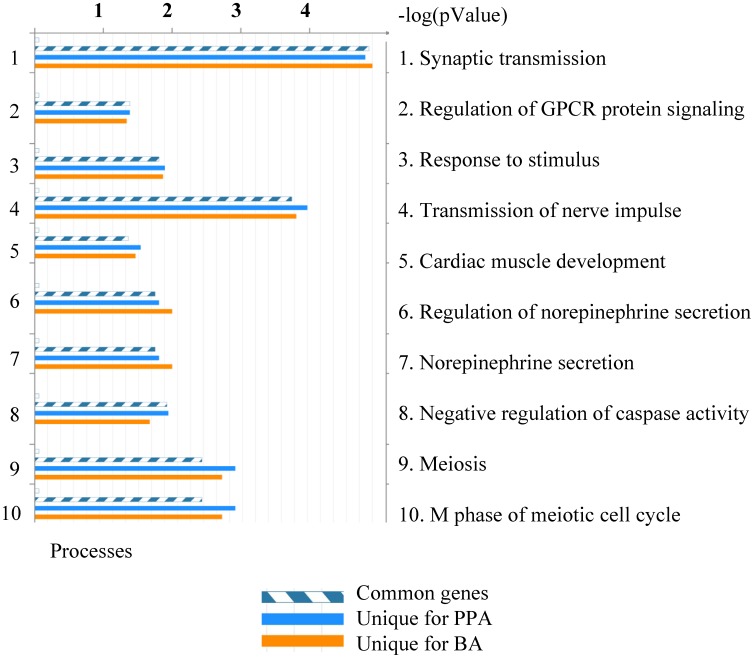
Alterations in gut microbiome composition have an emerging role in health and disease including brain function and behavior. Short chain fatty acids (SCFA) like propionic (PPA), and butyric acid (BA), which are present in diet and are fermentation products of many gastrointestinal bacteria, are showing increasing importance in host health, but also may be environmental contributors in neurodevelopmental disorders including autism spectrum disorders (ASD). Further to this we have shown SCFA administration to rodents over a variety of routes (intracerebroventricular, subcutaneous, intraperitoneal) or developmental time periods can elicit behavioral, electrophysiological, neuropathological and biochemical effects consistent with findings in ASD patients. SCFA are capable of altering host gene expression, partly due to their histone deacetylase inhibitor activity. We have previously shown BA can regulate tyrosine hydroxylase (TH) mRNA levels in a PC12 cell model. Since monoamine concentration is known to be elevated in the brain and blood of ASD patients and in many ASD animal models, we hypothesized that SCFA may directly influence brain monoaminergic pathways. When PC12 cells were transiently transfected with plasmids having a luciferase reporter gene under the control of the TH promoter, PPA was found to induce reporter gene activity over a wide concentration range. CREB transcription factor(s) was necessary for the transcriptional activation of TH gene by PPA. At lower concentrations PPA also caused accumulation of TH mRNA and protein, indicative of increased cell capacity to produce catecholamines. PPA and BA induced broad alterations in gene expression including neurotransmitter systems, neuronal cell adhesion molecules, inflammation, oxidative stress, lipid metabolism and mitochondrial function, all of which have been implicated in ASD. In conclusion, our data are consistent with a molecular mechanism through which gut related environmental signals such as increased levels of SCFA's can epigenetically modulate cell function further supporting their role as environmental contributors to ASD.
Overview
The claims and statistics of this paper haven’t been checked yet.
Run the check — free, no account needed. It reads the open-access text and checks the sources it cites.
Integrity signals
Registry
Cites
Statistics
Figures
Verification
Claims the paper makes
The claims and statistics of this paper haven’t been checked yet.
Run the check — free, no account needed. It reads the open-access text and checks the sources it cites.
Claims other papers make about this one
Each is checked against this paper’s own text: does it say what the citing paper says it does?
The source backs part of the claim, not all of it — or backs it for a different population, condition or comparison.
In the citing paper
“It was described that SCFAs may modulate the levels of neurotransmitters and neurotrophic factors.”
From The Role of Short-Chain Fatty Acids From Gut Microbiota in Gut-Brain Communication (2020) · cites this paper as [116]
Experimental — accuracy not yet measuredThe source backs part of the claim, not all of it — or backs it for a different population, condition or comparison.
In the citing paper
“these SCFAs regulate the expression levels of tryptophan 5-hydroxylase 1, the enzyme involved in synthesis of serotonin, and tyrosine hydroxylase, which is involved in a rate-limiting step in the biosynthesis of dopamine, noradrenaline and adrenaline; therefore, producing an effect on brain neurochemistry (21, 55, 56, 116, 117).”
From The Role of Short-Chain Fatty Acids From Gut Microbiota in Gut-Brain Communication (2020) · cites this paper as [116]
Experimental — accuracy not yet measuredThe cited source says what the claim attributes to it.
In the citing paper
“Other SCFA effects, especially of propionate and butyrate, are mediated through their HDAC inhibitory activity (108, 116).”
From The Role of Short-Chain Fatty Acids From Gut Microbiota in Gut-Brain Communication (2020) · cites this paper as [116]
In the citing paper
“Propionate and butyrate can influence the cell signaling system via modification of the intracellular potassium levels (104), and they regulate the expression levels of tryptophan 5-hydroxylase 1, involved in the synthesis of serotonin, and tyrosine hydroxylase, which is involved in the biosynthesis of dopamine, adrenaline, and noradrenaline (105).”
From The gut-brain axis: how microbiota and host inflammasome influence brain physiology and pathology (2020) · cites this paper as [105]
Self-check
Percentages, sums and reported differences re-computed from the paper’s own numbers.
The self-check needs the paper’s full text.
Citations
Cites
Bradford, M. M. (1976) · Analytical Biochemistry · doi:10.1016/0003-2697(76)90527-3 · Cited by 255,302
The Metabolic and Molecular Bases of Inherited Disease
Scriver, R. C. (1995) · Medical Entomology and Zoology · Cited by 12,101
Greene, L., & Tischler, A. S. (1976) · Proceedings of the National Academy of Sciences · doi:10.1073/pnas.73.7.2424 · Cited by 5,566
The Microbial Metabolites, Short-Chain Fatty Acids, Regulate Colonic T reg Cell Homeostasis
Smith, P. M., Howitt, M. R., Panikov, N., Michaud, M., Gallini, C. A., Bohlooly-Y, M., Glickman, J. N., & Garrett, W. S. (2013) · Science · doi:10.1126/science.1241165 · Cited by 5,413
Gut microbiota in health and disease
Sekirov, I., Russell, S. L., Antunes, L. C. M., & Finlay, B. B. (2010) · Physiological Reviews · doi:10.1152/physrev.00045.2009 · Cited by 4,182
The impact of the gut microbiota on human health: an integrative view
Clemente, J. C., Ursell, L. K., Parfrey, L. W., & Knight, R. (2012) · Cell · doi:10.1016/j.cell.2012.01.035 · Cited by 3,710
Hsiao, E. Y., McBride, S. W., Hsien, S., Sharon, G., Hyde, E. R., McCue, T., Codelli, J. A., Chow, J., Reisman, S. E., Petrosino, J. F., et al. (2013) · Cell · doi:10.1016/j.cell.2013.11.024 · Cited by 3,283
Normal gut microbiota modulates brain development and behavior
Heijtz, R. D., Wang, S., Anuar, F., Qian, Y., Björkholm, B., Samuelsson, A., Hibberd, M. L., Forssberg, H., & Pettersson, S. (2011) · Proceedings of the National Academy of Sciences · doi:10.1073/pnas.1010529108 · Cited by 3,228
Brown, A. J., Goldsworthy, S. M., Barnes, A. A., Eilert, M. M., Tcheang, L., Daniels, D., Muir, A. I., Wigglesworth, M. J., Kinghorn, I., Fraser, N. J., et al. (2003) · Journal of Biological Chemistry · doi:10.1074/jbc.m211609200 · Cited by 2,409
Genetic Heritability and Shared Environmental Factors Among Twin Pairs With Autism
Hallmayer, J. (2011) · Archives of General Psychiatry · doi:10.1001/archgenpsychiatry.2011.76 · Cited by 1,970
Cited by
Sorted by citations
The role of short-chain fatty acids in microbiota–gut–brain communication
Dalile, B., Van Oudenhove, L., Vervliet, B., & Verbeke, K. (2019) · Nature Reviews Gastroenterology & Hepatology · doi:10.1038/s41575-019-0157-3 · Cited by 3,357
The Role of Short-Chain Fatty Acids From Gut Microbiota in Gut-Brain Communication
Silva, Y. P., Bernardi, A., & Frozza, R. L. (2020) · Frontiers in Endocrinology · doi:10.3389/fendo.2020.00025 · Cited by 3,043
“In particular, these SCFAs regulate the expression levels of tryptophan 5-hydroxylase 1, the enzyme involved in synthesis of serotonin, and tyrosine hydroxylase, which is involved in a rate-limiting step in the biosynthesis of dopamine, noradrenaline and adrenaline; therefore, producing an effect on brain neurochemist…”
BackgroundPrebiotics: Definition, Types, Sources, Mechanisms, and Clinical Applications
Davani-Davari, D., Negahdaripour, M., Karimzadeh, I., Seifan, M., Mohkam, M., Masoumi, S. J., Berenjian, A., & Ghasemi, Y. (2019) · Foods · doi:10.3390/foods8030092 · Cited by 1,848
Short-Chain Fatty-Acid-Producing Bacteria: Key Components of the Human Gut Microbiota
Fusco, W. G., Bernabeu, M., Cintoni, M., Porcari, S., Rinninella, E., Kaitsas, F., Lener, E., Mele, M. C., Gasbarrini, A., Collado, M. C., et al. (2023) · Nutrients · doi:10.3390/nu15092211 · Cited by 1,397
Human Gut Microbiota from Autism Spectrum Disorder Promote Behavioral Symptoms in Mice
Sharon, G., Cruz, N. J., Kang, D.-W., Gandal, M. J., Wang, B., Kim, Y.-M., Zink, E. M., Casey, C. P., Taylor, B. C., Lane, C. J., et al. (2019) · Cell · doi:10.1016/j.cell.2019.05.004 · Cited by 1,182
The microbiota-gut-brain axis: from motility to mood
Margolis, K. G., Cryan, J. F., & Mayer, E. A. (2021) · Gastroenterology · doi:10.1053/j.gastro.2020.10.066 · Cited by 999
The gut-brain axis: how microbiota and host inflammasome influence brain physiology and pathology
Rutsch, A., Kantsjö, J. B., & Ronchi, F. (2020) · Frontiers in Immunology · doi:10.3389/fimmu.2020.604179 · Cited by 821
Microbiome, probiotics and neurodegenerative diseases: deciphering the gut brain axis
Westfall, S., Lomis, N., Kahouli, I., Dia, S. Y., Singh, S. P., & Prakash, S. (2017) · Cellular and Molecular Life Sciences · doi:10.1007/s00018-017-2550-9 · Cited by 570
Gut Bacteria and Neurotransmitters
Dicks, L. M. T. (2022) · Microorganisms · doi:10.3390/microorganisms10091838 · Cited by 482
Microbiota and the social brain
Sherwin, E., Bordenstein, S. R., Quinn, J. L., Dinan, T. G., & Cryan, J. F. (2019) · Science · doi:10.1126/science.aar2016 · Cited by 462
Role of microbiota-derived short-chain fatty acids in nervous system disorders
Mirzaei, R., Bouzari, B., Hosseini‐Fard, S. R., Mazaheri, M., Ahmadyousefi, Y., Abdi, M., Jalalifar, S., Karimitabar, Z., Teimoori, A., Keyvani, H., et al. (2021) · Biomedicine & Pharmacotherapy · doi:10.1016/j.biopha.2021.111661 · Cited by 408
Gut microbiome and depression: what we know and what we need to know
Winter, G., Hart, R. A., Charlesworth, R. P. G., & Sharpley, C. F. (2018) · Reviews in the Neurosciences · doi:10.1515/revneuro-2017-0072 · Cited by 394
A prebiotic intervention study in children with autism spectrum disorders (ASDs)
Grimaldi, R., Gibson, G. R., Vulevic, J., Giallourou, N., Castro-Mejía, J. L., Hansen, L. H., Leigh Gibson, E., Nielsen, D. S., & Costabile, A. (2018) · Microbiome · doi:10.1186/s40168-018-0523-3 · Cited by 369
The neuroendocrinology of the microbiota-gut-brain axis: a behavioural perspective
Cussotto, S., Sandhu, K. V., Dinan, T. G., & Cryan, J. F. (2018) · Frontiers in Neuroendocrinology · doi:10.1016/j.yfrne.2018.04.002 · Cited by 326
Sherwin, E., Sandhu, K. V., Dinan, T. G., & Cryan, J. F. (2016) · CNS Drugs · doi:10.1007/s40263-016-0370-3 · Cited by 309
Gut microbial metabolites in depression: understanding the biochemical mechanisms
Caspani, G., Kennedy, S. H., Foster, J. A., & Swann, J. R. (2019) · Microbial Cell · doi:10.15698/mic2019.10.693 · Cited by 289
Faecal short chain fatty acids profile is changed in Polish depressive women
Skonieczna-Żydecka, K., Grochans, E., Maciejewska, D., Szkup, M., Schneider-Matyka, D., Jurczak, A., Łoniewski, I., Kaczmarczyk, M., Marlicz, W., Czerwińska-Rogowska, M., et al. (2018) · Nutrients · doi:10.3390/nu10121939 · Cited by 284
Kim, Y., & Shin, C. (2018) · Current Neuropharmacology · doi:10.2174/1570159x15666170915141036 · Cited by 281
Communication of gut microbiota and brain via immune and neuroendocrine signaling
Kasarełło, K., Cudnoch‐Jędrzejewska, A., & Czarzasta, K. (2023) · Frontiers in Microbiology · doi:10.3389/fmicb.2023.1118529 · Cited by 283
MacFabe, D. F. (2015) · Microbial Ecology in Health and Disease · doi:10.3402/mehd.v26.28177 · Cited by 263
Self-citationThe microbiota-gut-brain axis and its potential therapeutic role in autism spectrum disorder
Li, Q., & Zhou, J.-M. (2016) · Neuroscience · doi:10.1016/j.neuroscience.2016.03.013 · Cited by 253
Zhang, Z., Mu, X., Cao, Q., Shi, Y., Hu, X., & Zheng, H. (2022) · Nature Communications · doi:10.1038/s41467-022-29760-0 · Cited by 246
Clinical and Molecular Characteristics of Mitochondrial Dysfunction in Autism Spectrum Disorder
Rose, S., Niyazov, D. M., Rossignol, D. A., Goldenthal, M. J., Kahler, S. G., & Frye, R. E. (2018) · Molecular Diagnosis & Therapy · doi:10.1007/s40291-018-0352-x · Cited by 237
Butyrate enhances mitochondrial function during oxidative stress in cell lines from boys with autism
Rose, S., Bennuri, S. C., Davis, J. E., Wynne, R., Slattery, J. C., Tippett, M., Delhey, L., Melnyk, S., Kahler, S. G., MacFabe, D. F., et al. (2018) · Translational Psychiatry · doi:10.1038/s41398-017-0089-z · Cited by 226
Self-citationThe Role of Gut Bacterial Metabolites in Brain Development, Aging and Disease
Tran, S. M.-S., & Mohajeri, M. H. (2021) · Nutrients · doi:10.3390/nu13030732 · Cited by 213
Host microbiota modulates development of social preference in mice
Arentsen, T., Raith, H., Qian, Y., Forssberg, H., & Heijtz, R. D. (2015) · Microbial Ecology in Health and Disease · doi:10.3402/mehd.v26.29719 · Cited by 207
Luca, M., Di Mauro, M., Di Mauro, M., & Luca, A. (2019) · Oxidative Medicine and Cellular Longevity · doi:10.1155/2019/4730539 · Cited by 190
Gut Microbiota: The Brain Peacekeeper
Mu, C., Yang, Y., & Zhu, W. (2016) · Frontiers in Microbiology · doi:10.3389/fmicb.2016.00345 · Cited by 188
Zhang, M., Ma, W., Zhang, J., He, Y., & Wang, J. (2018) · Scientific Reports · doi:10.1038/s41598-018-32219-2 · Cited by 188
Effect of ultra-processed diet on gut microbiota and thus its role in neurodegenerative diseases
Leo, E. E. M., & Campos, M. R. S. (2019) · Nutrition · doi:10.1016/j.nut.2019.110609 · Cited by 196
Dash, S., Syed, Y. A., & Khan, M. R. (2022) · Frontiers in Cell and Developmental Biology · doi:10.3389/fcell.2022.880544 · Cited by 193
Bojović, K., Ignjatović, Đ., Bajić, S. S., Milutinović, D. V., Tomić, M., Golić, N., & Tolinački, M. (2020) · Frontiers in Cellular and Infection Microbiology · doi:10.3389/fcimb.2020.00223 · Cited by 172
Enteric short‐chain fatty acids promote proliferation of human neural progenitor cells
Yang, L. L., Millischer, V., Rodin, S., MacFabe, D. F., Villaescusa, J. C., & Lavebratt, C. (2020) · Journal of Neurochemistry · doi:10.1111/jnc.14928 · Cited by 157
Self-citationAltered gut microbiota in Rett syndrome
Strati, F., Cavalieri, D., Albanese, D., Felice, C. D., Donati, C., Hayek, J., Jousson, O., Leoncini, S., Pindo, M., Renzi, D., et al. (2016) · Microbiome · doi:10.1186/s40168-016-0185-y · Cited by 149
Microbiota‐gut‐brain axis as a regulator of reward processes
García‐Cabrerizo, R., Carbia, C., O’Riordan, K. J., Schellekens, H., & Cryan, J. F. (2020) · Journal of Neurochemistry · doi:10.1111/jnc.15284 · Cited by 150
Potential Benefits of Probiotics and Prebiotics for Coronary Heart Disease and Stroke
Wu, H., & Chiou, J. A. (2021) · Nutrients · doi:10.3390/nu13082878 · Cited by 153
Frye, R. E., Rose, S., Slattery, J. M., & MacFabe, D. F. (2015) · Microbial Ecology in Health and Disease · doi:10.3402/mehd.v26.27458 · Cited by 145
Self-citationChoi, J., Lee, S., Won, J., Jin, Y., Hong, Y., Hur, T.-Y., Kim, J.-H., Lee, S.-R., & Hong, Y. (2018) · PLOS ONE · doi:10.1371/journal.pone.0192925 · Cited by 139
Small talk: microbial metabolites involved in the signaling from microbiota to brain
Caspani, G., & Swann, J. R. (2019) · Current Opinion in Pharmacology · doi:10.1016/j.coph.2019.08.001 · Cited by 144
Aljumaah, M. R., Bhatia, U., Roach, J., Gunstad, J., & Peril, M. A. A. (2022) · Clinical Nutrition · doi:10.1016/j.clnu.2022.09.012 · Cited by 140
Role of the gut microbiome in three major psychiatric disorders
Borkent, J., Ioannou, M., Laman, J. D., Haarman, B. C. M., & Sommer, I. E. (2022) · Psychological Medicine · doi:10.1017/s0033291722000897 · Cited by 139
Frye, R. E., Rose, S., Chacko, J., Wynne, R., Bennuri, S. C., Slattery, J. C., Tippett, M., Delhey, L., Melnyk, S., Kahler, S. G., et al. (2016) · Translational Psychiatry · doi:10.1038/tp.2016.189 · Cited by 130
Self-citationGut Microbiota, Inflammation, and Probiotics on Neural Development in Autism Spectrum Disorder
Doenyas, C. (2018) · Neuroscience · doi:10.1016/j.neuroscience.2018.01.060 · Cited by 123
Short chain fatty acids, a possible treatment option for autoimmune diseases
Golpour, F., Abbasi-Alaei, M., Babaei, F., Mirzababaei, M., Parvardeh, S., Mohammadi, G., & Nassiri‐Asl, M. (2023) · Biomedicine & Pharmacotherapy · doi:10.1016/j.biopha.2023.114763 · Cited by 123
Lefter, R., Ciobica, A., Timofte, D., Stanciu, C., & Trifan, A. (2019) · Medicina · doi:10.3390/medicina56010011 · Cited by 120
The impact of maternal high-fat diet on offspring neurodevelopment
Urbonaite, G., Knyzeliene, A., Bunn, F. S., Smalskys, A., & Neniškytė, U. (2022) · Frontiers in Neuroscience · doi:10.3389/fnins.2022.909762 · Cited by 124
Distant Site Effects of Ingested Prebiotics
Collins, S., & Reid, G. (2016) · Nutrients · doi:10.3390/nu8090523 · Cited by 112
Multiple roles of short-chain fatty acids in Alzheimer disease
Chen, H., Meng, L., & Shen, L. (2021) · Nutrition · doi:10.1016/j.nut.2021.111499 · Cited by 108
Shobeiri, P., Kalantari, A., Teixeira, A. L., & Rezaei, N. (2022) · Biology of Sex Differences · doi:10.1186/s13293-022-00422-6 · Cited by 113
Liu, F., Horton-Sparks, K., Hull, V. L., Li, R. W., & Martínez‐Cerdeño, V. (2018) · Molecular Autism · doi:10.1186/s13229-018-0251-3 · Cited by 108
Mitochondrial function and abnormalities implicated in the pathogenesis of ASD
Castora, F. J. (2018) · Progress in Neuro-Psychopharmacology and Biological Psychiatry · doi:10.1016/j.pnpbp.2018.12.015 · Cited by 107
The gut microbiome in Parkinson's disease: A culprit or a bystander?
Keshavarzian, A., Engen, P. A., Bonvegna, S., & Cilia, R. (2020) · Progress in brain research · doi:10.1016/bs.pbr.2020.01.004 · Cited by 108
How important are fatty acids in human health and can they be used in treating diseases?
Dicks, L. M. T. (2024) · Gut Microbes · doi:10.1080/19490976.2024.2420765 · Cited by 99
Foley, K. A., MacFabe, D. F., Kavaliers, M., & Ossenkopp, K. (2014) · Behavioural Brain Research · doi:10.1016/j.bbr.2014.09.032 · Cited by 100
Self-citationGut-Brain Axis in the Early Postnatal Years of Life: A Developmental Perspective
Jena, A., Montoya, C. A., Mullaney, J. A., Dilger, R. N., Young, W., McNabb, W. C., & Roy, N. C. (2020) · Frontiers in Integrative Neuroscience · doi:10.3389/fnint.2020.00044 · Cited by 98
Distinct Roles of Honeybee Gut Bacteria on Host Metabolism and Neurological Processes
Zhang, Z., Mu, X., Shi, Y., & Zheng, H. (2022) · Microbiology Spectrum · doi:10.1128/spectrum.02438-21 · Cited by 91
Moțățăianu, A., Şerban, G. M., & Andone, S. R. (2023) · International Journal of Molecular Sciences · doi:10.3390/ijms242015094 · Cited by 94
Gut microbiota, kynurenine pathway and mental disorders – Review
Więdłocha, M., Marcinowicz, P., Janoska-Jaździk, M., & Szulc, A. (2020) · Progress in Neuro-Psychopharmacology and Biological Psychiatry · doi:10.1016/j.pnpbp.2020.110145 · Cited by 90
Sanborn, V. E., Azcárate-Peril, M. A., Updegraff, J. A., Manderino, L. M., & Gunstad, J. (2020) · Neuropsychiatric Disease and Treatment · doi:10.2147/ndt.s270035 · Cited by 89
Rose, S., Bennuri, S. C., Murray, K. F., Buie, T., Winter, H., & Frye, R. E. (2017) · PLOS ONE · doi:10.1371/journal.pone.0186377 · Cited by 82
Chen, Y.-H., Xue, F., Yu, S.-F., Li, X.-S., Liu, L., Jia, Y., Yan, W., Tan, Q.-R., Wang, H., & Peng, Z. (2020) · Journal of Affective Disorders · doi:10.1016/j.jad.2020.12.143 · Cited by 83
An approach to gut microbiota profile in children with autism spectrum disorder
Andreo‐Martínez, P., García-Martínez, N., Sánchez‐Samper, E. P., & Martínez‐González, A. E. (2019) · Environmental Microbiology Reports · doi:10.1111/1758-2229.12810 · Cited by 77
Dong, X.-L., Wang, X., Liu, F., Liu, X., Du, Z.-R., Li, R. W., Xue, C.-H., Wong, K.-H., Wong, W.-T., Zhao, Q., et al. (2020) · International Journal of Biological Macromolecules · doi:10.1016/j.ijbiomac.2020.07.180 · Cited by 75
Approaches to studying and manipulating the enteric microbiome to improve autism symptoms
Frye, R. E., Slattery, J. M., MacFabe, D. F., Allen‐Vercoe, E., Parker, W., Rodakis, J., Adams, J. B., Krajmalnik‐Brown, R., Bolte, E. R., Kahler, S. G., et al. (2015) · Microbial Ecology in Health and Disease · doi:10.3402/mehd.v26.26878 · Cited by 78
Self-citationRegulation of endocrine systems by the microbiome: Perspectives from comparative animal models
Williams, C. L., García‐Reyero, N., Martyniuk, C. J., Tubbs, C. W., & Bisesi, J. H. (2020) · General and Comparative Endocrinology · doi:10.1016/j.ygcen.2020.113437 · Cited by 75
Slattery, J. M., MacFabe, D. F., & Frye, R. E. (2016) · Clinical Medicine Insights Pediatrics · doi:10.4137/cmped.s38338 · Cited by 72
Self-citationHoney bee genetics shape the strain-level structure of gut microbiota in social transmission
Wu, J., Lang, H., Mu, X., Zhang, Z., Su, Q., Hu, X., & Zheng, H. (2021) · Microbiome · doi:10.1186/s40168-021-01174-y · Cited by 72
Microbiota Metabolite Regulation of Host Immune Homeostasis: A Mechanistic Missing Link
Steinmeyer, S. H., Lee, K., Jayaraman, A., & Alaniz, R. C. (2015) · Current Allergy and Asthma Reports · doi:10.1007/s11882-015-0524-2 · Cited by 73
The Gut Microbiota and Oxidative Stress in Autism Spectrum Disorders (ASD)
Hu, T., Dong, Y., He, C., Zhao, M., & He, Q. (2020) · Oxidative Medicine and Cellular Longevity · doi:10.1155/2020/8396708 · Cited by 72
Gut microbiota and aging-A focus on centenarians
Cӑtoi, A. F., Corina, A., Katsiki, N., Vodnar, D. C., Andreicuț, A. D., Stoian, A. P., Rizzo, M., & Pérez-Martínez, P. (2020) · Biochimica et Biophysica Acta (BBA) - Molecular Basis of Disease · doi:10.1016/j.bbadis.2020.165765 · Cited by 70
Metformin, Cognitive Function, and Changes in the Gut Microbiome
Rosell-Díaz, M., & Fernández‐Real, J. M. (2023) · Endocrine Reviews · doi:10.1210/endrev/bnad029 · Cited by 68
Hsu, C., Khachatryan, L., Younis, N. K., Mustafa, M. A., Ahmad, N., Athab, Z. H., Валерьевна, П. А., Викторовна, К. Е., Mirzaei, R., & Karampoor, S. (2024) · Frontiers in Microbiology · doi:10.3389/fmicb.2024.1456793 · Cited by 71
Gut Microbiota Influences Alzheimer’s Disease Pathogenesis by Regulating Acetate in Drosophila Model
Kong, Y., Jiang, B., & Luo, X. (2018) · Future Microbiology · doi:10.2217/fmb-2018-0185 · Cited by 69
Palmas, V., Pisanu, S., Madau, V., Casula, E., Deledda, A., Cusano, R., Uva, P., Loviselli, A., Velluzzi, F., & Manzin, A. (2022) · Nutrients · doi:10.3390/nu14122436 · Cited by 68
The Microbiome and Sustainable Healthcare
Dietert, R. R., & Dietert, J. M. (2015) · Healthcare · doi:10.3390/healthcare3010100 · Cited by 71
The Role of Short Chain Fatty Acids in Irritable Bowel Syndrome
Jiang, W., Wu, J., Zhu, S., Xin, L., Yu, C., & Shen, Z. (2022) · Journal of Neurogastroenterology and Motility · doi:10.5056/jnm22093 · Cited by 70
Hofford, R. S., Mervosh, N. L., Euston, T. J., Meckel, K. R., Orr, A. T., & Kiraly, D. D. (2021) · Neuropsychopharmacology · doi:10.1038/s41386-021-01043-0 · Cited by 67
Zhao, R., Chu, L., Wang, Y., Song, Y., Liu, P., Li, C., Huang, J., & Kang, X. (2017) · Clinica Chimica Acta · doi:10.1016/j.cca.2017.02.016 · Cited by 63
The Impact of Gut Microbiota-Derived Metabolites in Autism Spectrum Disorders
Marzal, L. N. P., Prince, N., Bajić, D., Roussin, L., Naudon, L., Rabot, S., Garssen, J., Kraneveld, A. D., & Perez‐Pardo, P. (2021) · International Journal of Molecular Sciences · doi:10.3390/ijms221810052 · Cited by 67
Central and peripheral regulations mediated by short-chain fatty acids on energy homeostasis
Luo, P., Lednovich, K., Xu, K., Nnyamah, C., Layden, B. T., & Xu, P. (2022) · Translational research · doi:10.1016/j.trsl.2022.06.003 · Cited by 62
Carissimi, C., Laudadio, I., Palone, F., Fulci, V., Cesi, V., Cardona, F., Alfonsi, C., Cucchiara, S., Isoldi, S., & Stronati, L. (2019) · Digestive and Liver Disease · doi:10.1016/j.dld.2019.06.006 · Cited by 62
Giuffrè, M., Moretti, R., Campisciano, G., da Silveira, A. B. M., Monda, V., Comar, M., Bella, S. D., Antonello, R. M., Luzzati, R., & Crocè, L. S. (2020) · Journal of Clinical Medicine · doi:10.3390/jcm9113705 · Cited by 64
Exploring the microbiota-gut-brain axis: impact on brain structure and function
Yassin, L. K., Nakhal, M. M., Alderei, A., Almehairbi, A., Mydeen, A. B., Akour, A. A., & Hamad, M. I. K. (2025) · Frontiers in Neuroanatomy · doi:10.3389/fnana.2025.1504065 · Cited by 64
Liang, Y., Cui, L., Gao, J., Zhu, M., Zhang, Y., & Zhang, H. (2021) · Molecular Neurobiology · doi:10.1007/s12035-021-02375-0 · Cited by 59
Rahi, S., Gupta, R., Sharma, A., & Mehan, S. (2021) · Human & Experimental Toxicology · doi:10.1177/09603271211013456 · Cited by 59
Al-Khafaji, A. H., Jepsen, S. D., Christensen, K. R., & Vigsnæs, L. K. (2020) · Journal of Functional Foods · doi:10.1016/j.jff.2020.104176 · Cited by 62
Khera, R., Mehan, S., Bhalla, S., Kumar, S., Alshammari, A., Alharbi, M., & Sadhu, S. S. (2022) · Molecules · doi:10.3390/molecules27030889 · Cited by 62
Kim, S., Park, S., Choi, T. G., & Kim, S. S. (2022) · Nutrients · doi:10.3390/nu14142982 · Cited by 62
Cutuli, D., Decandia, D., Giacovazzo, G., & Coccurello, R. (2023) · International Journal of Molecular Sciences · doi:10.3390/ijms241914686 · Cited by 61
Béopoulos, A., Géa, M., Fasano, A., & Iris, F. (2022) · Frontiers in Neuroscience · doi:10.3389/fnins.2022.988735 · Cited by 60
Frye, R. E., Nankova, B., Bhattacharyya, S., Rose, S., Bennuri, S. C., & MacFabe, D. F. (2017) · Frontiers in Immunology · doi:10.3389/fimmu.2017.01670 · Cited by 51
Self-citationMudaliar, S. B., Poojary, S. S., Prasad, A. S. B., & Mazumder, N. (2024) · Probiotics and Antimicrobial Proteins · doi:10.1007/s12602-024-10214-6 · Cited by 53
Shiadeh, S. M. J., Chan, W. K., Rasmusson, S., Hassan, N., Joca, S. R. L., Westberg, L., Elfvin, A., Mallard, C. E., & Ardalan, M. (2025) · Translational Psychiatry · doi:10.1038/s41398-025-03504-2 · Cited by 52
Sharma, A. R., Batra, G., Saini, L. K., Sharma, S., Mishra, A., Singla, R., Singh, A. K., Singh, R. S., Jain, A., Bansal, S., et al. (2021) · CNS & Neurological Disorders - Drug Targets · doi:10.2174/1871527320666210806165430 · Cited by 49
Ottria, R., Mirmajidi, S., & Ciuffreda, P. (2026) · International Journal of Molecular Sciences · doi:10.3390/ijms27021095 · Cited by 49
Ağagündüz, D., Çelik, E., Cemali, Ö., Bingöl, F. G., Özenir, Ç., Özoğul, F., & Capasso, R. (2023) · Probiotics and Antimicrobial Proteins · doi:10.1007/s12602-023-10092-4 · Cited by 47
Sharma, A., Bhalla, S., & Mehan, S. (2022) · Metabolic Brain Disease · doi:10.1007/s11011-022-01026-0 · Cited by 47
RetractedOstendorf, F., Metzdorf, J., Gold, R., Haghikia, A., & Tönges, L. (2020) · Molecules · doi:10.3390/molecules25112502 · Cited by 46
Dietary Fatty Acids and Microbiota-Brain Communication in Neuropsychiatric Diseases
Marrone, M. C., & Coccurello, R. (2019) · Biomolecules · doi:10.3390/biom10010012 · Cited by 48
A controversy on the role of short-chain fatty acids in the pathogenesis of Parkinson's disease
Mulak, A. (2018) · Movement Disorders · doi:10.1002/mds.27304 · Cited by 45
Metadata
- Authors
- Nankova, B. B., Agarwal, R., MacFabe, D. F., & La Gamma, E. F.
- Affiliations
- New York Medical College (US)
- Western University (CA)
- Corresponding author
- Nankova, Bistra B.
- ORCID
- Nankova, Bistra B.
- Venue
- PLoS ONE
- Publisher
- Public Library of Science (PLoS)
- Published
- 2014-08-29
- Volume
- 9
- Issue
- 8
- Pages
- e103740
- ISSN
- 1932-6203 (ISSN-L)
- PMC
- PMC4149359
- OpenAlex
- W2028901643
- Cited by
- 294
- References
- 136
- Citations by year
- 2026: 24 · 2025: 26 · 2024: 30 · 2023: 29 · 2022: 43 · 2021: 34 · 2020: 37 · 2019: 19 · 2018: 21 · 2017: 8 · 2016: 14 · 2015: 8 · 2014: 1
- FWCI
- 4.23
- Type
- journal article
- Language
- en
- Open access
- gold
- doi.org
- Locations
- PLoS ONE (publishedVersion, cc-by)
- Europe PMC (PubMed Central) (publishedVersion, cc-by)
- PubMed Central (publishedVersion, cc-by)
- PubMed (publishedVersion)
- Touro Scholar (Touro College) (submittedVersion)
- DOAJ (DOAJ: Directory of Open Access Journals) (submittedVersion)
- Figshare (submittedVersion, cc-by)
- Funders
- Autism Research Institute
- Topics
- Life Sciences › Biochemistry, Genetics and Molecular Biology › Molecular Biology › Gut microbiota and health
- Life Sciences › Neuroscience › Cognitive Neuroscience › Autism Spectrum Disorder Research
- Life Sciences › Neuroscience › Biological Psychiatry › Tryptophan and brain disorders
- Keywords
- propionic acid, butyrate, short-chain fatty acids, gut microbiota, autism spectrum disorder, catecholaminergic neurotransmission, tyrosine hydroxylase, CREB transcription factor, PC12 cells, histone deacetylase inhibition, epigenetic regulation, monoamines, neurodevelopmental disorders, gut-brain axis
- MeSH terms
- Animals, Child Development Disorders, Pervasive, Enterobacteriaceae, Gene Expression Regulation, Synaptic Transmission, Propionates, Tyrosine 3-Monooxygenase, Transcriptional Activation, PC12 Cells, Cyclic AMP Response Element-Binding Protein, Butyric Acid, Rats, Gene Regulatory Networks, Host-Pathogen Interactions
About these checks
Registry, retraction, Cites and statistics results are computed, not judged, with one exception: a printed reference that no index lists is read once by a model before it counts as a citation error. Claims are extracted by a model and kept only when their quote appears verbatim in the text; each cited source is then checked, with a model’s help, for whether it says what the claim relies on. Those verdicts can be wrong — read the claim’s quote and the cited source before relying on one.
Statistics and arithmetic are recomputed, not judged.
Confidence bands are shown only for fields calibrated on our annotated test set. None is calibrated yet, so no band is shown.
What counts as a claim ›How we measure confidence ›How we check this ›
Are you an author, or do you see a problem with this page? Request a review
