

The DOI matches its Crossref record; 43 of the 44 references it cites were found in a registry or an index.
Regional early and progressive loss of brain pericytes but not vascular smooth muscle cells in adult mice with disrupted platelet-derived growth factor receptor-β signaling
Open accessAbstract
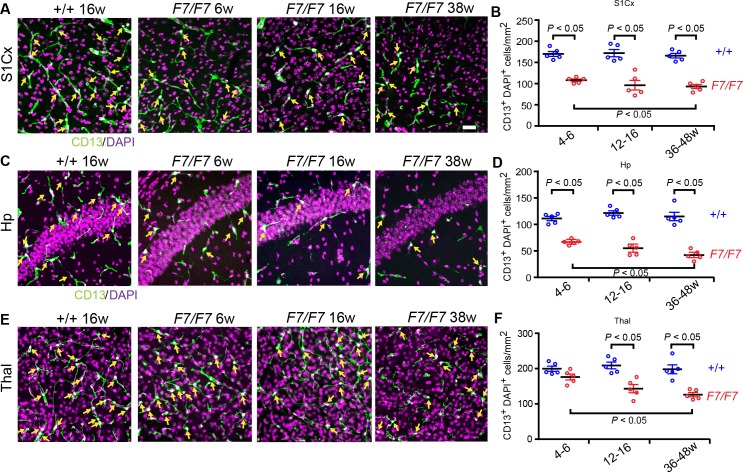
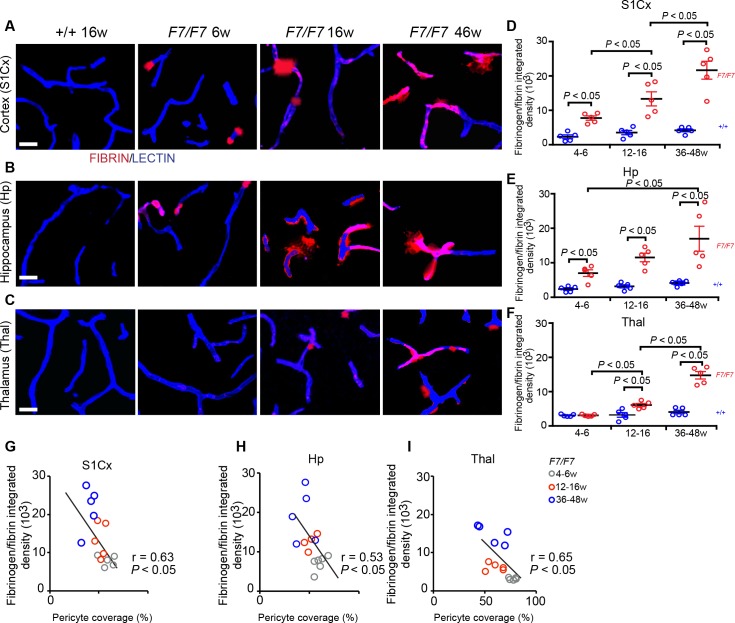
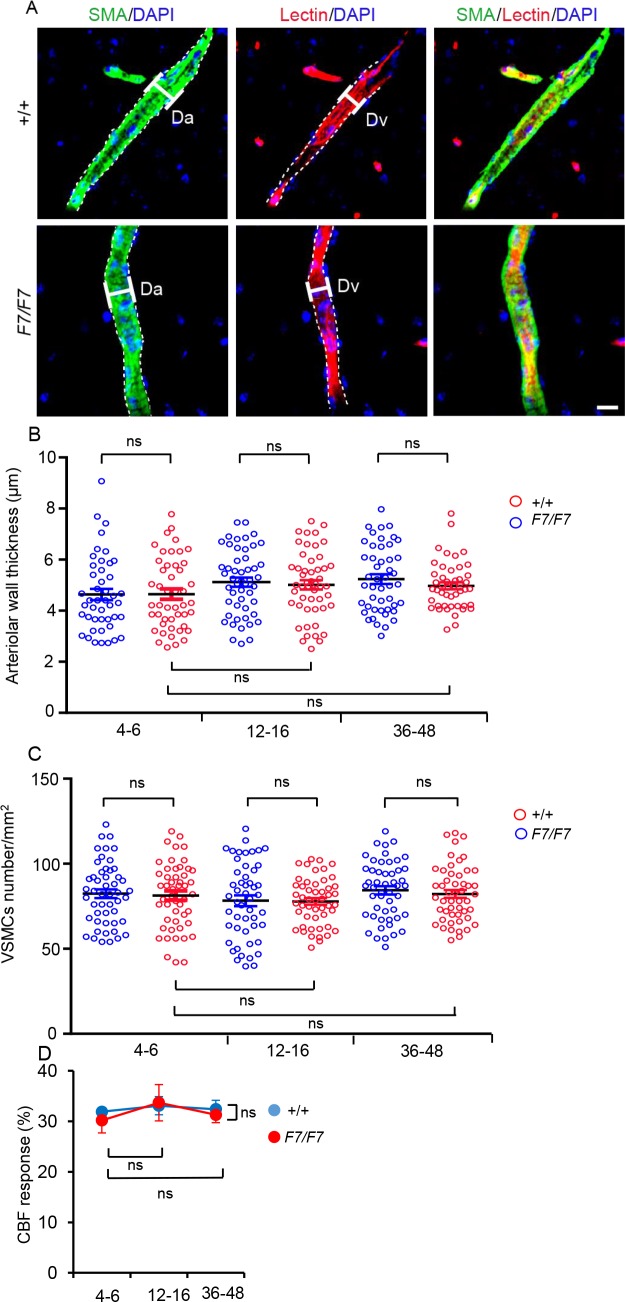
Pericytes regulate key neurovascular functions of the brain. Studies in pericyte-deficient transgenic mice with aberrant signaling between endothelial-derived platelet-derived growth factor BB (PDGF-BB) and platelet-derived growth factor receptor β (PDGFRβ) in pericytes have contributed to better understanding of the role of pericytes in the brain. Here, we studied PdgfrβF7/F7 mice, which carry seven point mutations that disrupt PDGFRβ signaling causing loss of pericytes and vascular smooth muscle cells (VSMCs) in the developing brain. We asked whether these mice have a stable or progressive vascular phenotype after birth, and whether both pericyte and VSMCs populations are affected in the adult brain. We found an early and progressive region-dependent loss of brain pericytes, microvascular reductions and blood-brain barrier (BBB) breakdown, which were more pronounced in the cortex, hippocampus and striatum than in the thalamus, whereas VSMCs population remained unaffected at the time when pericyte loss was already established. For example, compared to age-matched controls, PdgfrβF7/F7 mice between 4-6 and 36-48 weeks of age developed a region-dependent loss in pericyte coverage (22-46, 24-44 and 4-31%) and cell numbers (36-49, 34-64 and 11-36%), reduction in capillary length (20-39, 13-46 and 1-30%), and an increase in extravascular fibrinogen-derived deposits (3.4-5.2, 2.8-4.1 and 0-3.6-fold) demonstrating BBB breakdown in the cortex, hippocampus and thalamus, respectively. Capillary reductions and BBB breakdown correlated with loss of pericyte coverage. Our data suggest that PdgfrβF7/F7 mice develop an aggressive and rapid vascular phenotype without appreciable early involvement of VSMCs, therefore providing a valuable model to study regional effects of pericyte loss on brain vascular and neuronal functions. This model could be a useful tool for future studies directed at understanding the role of pericytes in the pathogenesis of neurological disorders associated with pericyte loss such as vascular dementia, Alzheimer's disease, amyotrophic lateral sclerosis, stroke and human immunodeficiency virus-associated neurocognitive disorder.
Overview
The claims and statistics of this paper haven’t been checked yet.
Run the check — free, no account needed. It reads the open-access text and checks the sources it cites.
Integrity signals
Registry
Cites
Statistics
Figures
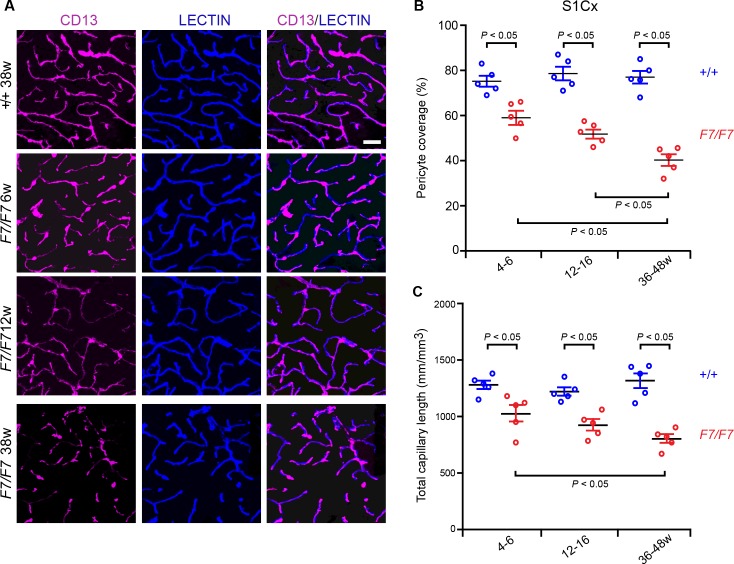
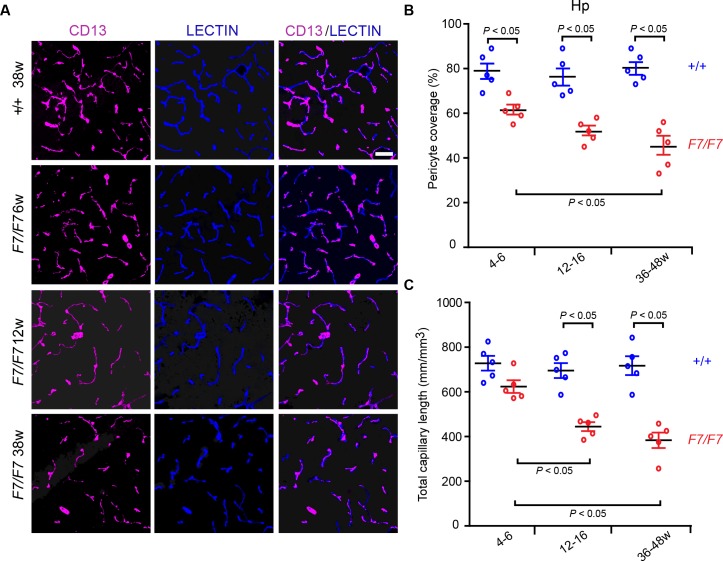
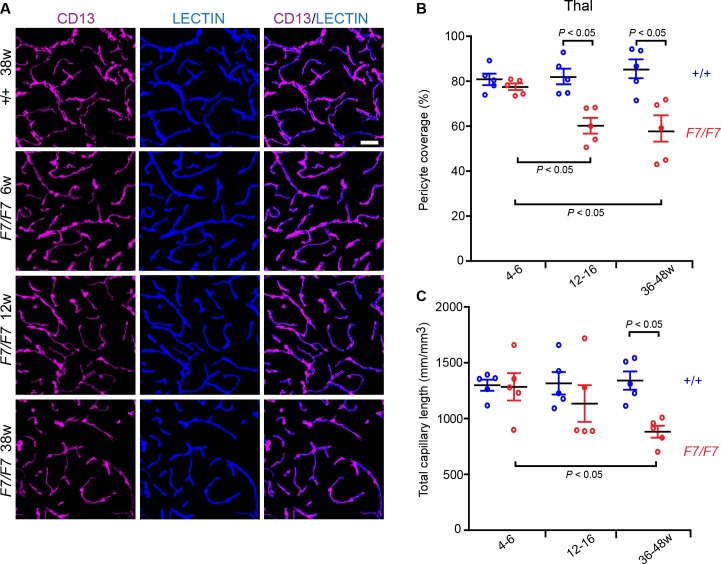
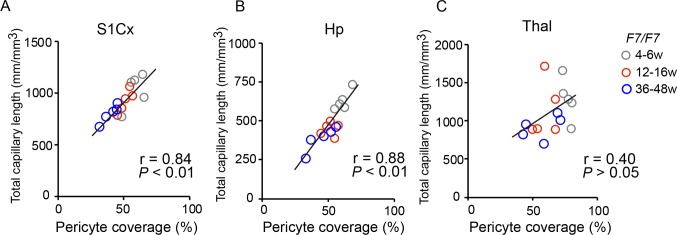
Verification
Claims the paper makes
The claims and statistics of this paper haven’t been checked yet.
Run the check — free, no account needed. It reads the open-access text and checks the sources it cites.
Claims other papers make about this one
Each is checked against this paper’s own text: does it say what the citing paper says it does?
The cited source says what the claim attributes to it.
In the citing paper
“Pericytedeficient mouse models caused by aberrant PDGF-BB/ PDGFR𝛃 signaling (365, 419, 436, 570, 575) exhibit impaired BBB formation (28, 59, 130) and maintenance (59, 436).”
From Blood-Brain Barrier: From Physiology to Disease and Back (2019) · cites this paper as [436]
Self-check
Percentages, sums and reported differences re-computed from the paper’s own numbers.
The self-check needs the paper’s full text.
Citations
Cites
1 retracted
RETRACTED ARTICLE: Pericyte loss influences Alzheimer-like neurodegeneration in mice
Sagare, A. P., Bell, R. D., Zhao, Z., Ma, Q., Winkler, E. A., Ramanathan, A., & Zlokovic, B. V. (2013) · Nature Communications · doi:10.1038/ncomms3932 · Cited by 589
Self-citationRetractedA Threshold Selection Method from Gray-Level Histograms
Otsu, N. (1979) · IEEE Transactions on Systems, Man and Cybernetics · doi:10.1109/tsmc.1979.4310076 · Cited by 44,708
Cahoy, J. D., Emery, B., Kaushal, A., Foo, L. C., Zamanian, J. L., Christopherson, K. S., Xing, Y., Lubischer, J. L., Krieg, P. A., Krupenko, S. A., et al. (2008) · The Journal of Neuroscience · doi:10.1523/jneurosci.4178-07.2008 · Cited by 3,129
Pericytes regulate the blood–brain barrier
Armulik, A., Genové, G., Mäe, M., Nisancioglu, M. H., Wallgard, E., Niaudet, C., He, L., Norlin, J., Lindblom, P., Strittmatter, K., et al. (2010) · Nature · doi:10.1038/nature09522 · Cited by 2,843
Pericytes: Developmental, Physiological, and Pathological Perspectives, Problems, and Promises
Armulik, A., Genové, G., & Betsholtz, C. (2011) · Developmental Cell · doi:10.1016/j.devcel.2011.07.001 · Cited by 2,653
Pericyte Loss and Microaneurysm Formation in PDGF-B-Deficient Mice
Lindahl, P., Johansson, B. R., Levéen, P., & Betsholtz, C. (1997) · Science · doi:10.1126/science.277.5323.242 · Cited by 2,226
Pericytes are required for blood–brain barrier integrity during embryogenesis
Daneman, R., Zhou, L., Kebede, A. A., & Barres, B. A. (2010) · Nature · doi:10.1038/nature09513 · Cited by 2,128
Blood-brain barrier breakdown in the aging human hippocampus
Montagne, A., Barnes, S. R., Sweeney, M. D., Halliday, M. R., Sagare, A. P., Zhao, Z., Toga, A. W., Jacobs, R. E., Liu, C. Y., Amezcua, L., et al. (2015) · Neuron · doi:10.1016/j.neuron.2014.12.032 · Cited by 2,102
Self-citationCapillary pericytes regulate cerebral blood flow in health and disease
Hall, C. N., Reynell, C., Gesslein, B., Hamilton, N. B., Mishra, A., Sutherland, B. A., O’Farrell, F. M., Buchan, A. M., Lauritzen, M., & Attwell, D. (2014) · Nature · doi:10.1038/nature13165 · Cited by 1,870
Hellström, M., Kalén, M., Lindahl, P., Abramsson, A., & Betsholtz, C. (1999) · Development · doi:10.1242/dev.126.14.3047 · Cited by 1,734
Cited by
Sorted by citations
Blood-Brain Barrier: From Physiology to Disease and Back
Sweeney, M. D., Zhao, Z., Montagne, A., Nelson, A. R., & Zlokovic, B. V. (2019) · Physiological Reviews · doi:10.1152/physrev.00050.2017 · Cited by 2,312
Self-citationThe role of brain vasculature in neurodegenerative disorders
Sweeney, M. D., Kisler, K., Montagne, A., Toga, A. W., & Zlokovic, B. V. (2018) · Nature Neuroscience · doi:10.1038/s41593-018-0234-x · Cited by 998
Self-citationDual microglia effects on blood brain barrier permeability induced by systemic inflammation
Haruwaka, K., Ikegami, A., Tachibana, Y., Ohno, N., Konishi, H., Hashimoto, A., Matsumoto, M., Kato, D., Ono, R., Kiyama, H., et al. (2019) · Nature Communications · doi:10.1038/s41467-019-13812-z · Cited by 923
Alzheimer’s disease: A matter of blood–brain barrier dysfunction?
Montagne, A., Zhao, Z., & Zlokovic, B. V. (2017) · Journal of Experimental Medicine · doi:10.1084/jem.20171406 · Cited by 672
“…transgenic mice, including Pdgfrβ+/− mice and PdgfrβF7/F7 mice with disrupted Pdgfrβ signaling, develop an early and progressive BBB breakdown (Bell et al., 2010; Daneman et al., 2010; Nikolakopoulou et al., 2017) and impaired hemodynamic responses (Kisler et al., 2017b) beginning at 1 mo of age.”
BackgroundSelf-citationFibrinogen in neurological diseases: mechanisms, imaging and therapeutics
Petersen, M. A., Ryu, J. K., & Akassoglou, K. (2018) · Nature reviews. Neuroscience · doi:10.1038/nrn.2018.13 · Cited by 527
Pericyte loss leads to circulatory failure and pleiotrophin depletion causing neuron loss
Nikolakopoulou, A. M., Montagne, A., Kisler, K., Dai, Z., Wang, Y., Huuskonen, M. T., Sagare, A. P., Lazić, D., Sweeney, M. D., Kong, P., et al. (2019) · Nature Neuroscience · doi:10.1038/s41593-019-0434-z · Cited by 386
“Ten-micron maximum projection z-stacks were reconstructed, and the fibrin(ogen)-positive perivascular signal on the abluminal side of lectin-positive endothelial profiles on microvessels < 6 μm in diameter was analyzed using ImageJ 4,64 .”
Self-citationRonaldson, P. T., & Davis, T. P. (2020) · Journal of Cerebral Blood Flow & Metabolism · doi:10.1177/0271678x20951995 · Cited by 392
“Several published studies have identified astrocyte-released effector molecules that can contribute to development of the BBB phenotype including members of the hedgehog family,11 angiotensin II,12 and/or apolipoprotein E (APOE)/ lipoprotein receptor-related protein 1 (LRP1) signaling.13 Similarly, pericyte-deficient…”
BackgroundInfluentialRole of Blood-Brain Barrier in Alzheimer’s Disease
Cai, Z., Qiao, P.-F., Wan, C.-Q., Cai, M., Zhou, N.-K., & Li, Q. (2018) · Journal of Alzheimer's Disease · doi:10.3233/jad-180098 · Cited by 370
Montagne, A., Nikolakopoulou, A. M., Zhao, Z., Sagare, A. P., Si, G., Lazic, D., Barnes, S. R., Daianu, M., Ramanathan, A., Go, A., et al. (2018) · Nature Medicine · doi:10.1038/nm.4482 · Cited by 344
Self-citationRetractedIdentification of early pericyte loss and vascular amyloidosis in Alzheimer’s disease retina
Shi, H., Koronyo, Y., Rentsendorj, A., Regis, G. C., Sheyn, J., Fuchs, D.-T., Kramerov, A. A., Ljubimov, A. V., Dumitrascu, O. M., Rodriguez, A. R., et al. (2020) · Acta Neuropathologica · doi:10.1007/s00401-020-02134-w · Cited by 230
Tau Protein and Its Role in Blood–Brain Barrier Dysfunction
Michalicová, A., Majerová, P., & Kováč, A. (2020) · Frontiers in Molecular Neuroscience · doi:10.3389/fnmol.2020.570045 · Cited by 185
Montagne, A., Nikolakopoulou, A. M., Huuskonen, M. T., Sagare, A. P., Lawson, E. J., Lazic, D., Rege, S. V., Grond, A., Zuniga, E., Barnes, S. R., et al. (2021) · Nature Aging · doi:10.1038/s43587-021-00073-z · Cited by 188
Self-citationEmerging links between cerebrovascular and neurodegenerative diseases—a special role for pericytes
Lendahl, U., Nilsson, P., & Betsholtz, C. (2019) · EMBO Reports · doi:10.15252/embr.201948070 · Cited by 148
Li, J., Li, M., Ge, Y., Chen, J., Ma, J., Wang, C., Sun, M., Wang, L., Yao, S., & Yao, C. (2022) · Cell & Bioscience · doi:10.1186/s13578-022-00807-5 · Cited by 146
Mechanisms of Pathogen Invasion into the Central Nervous System
Cain, M. D., Salimi, H., Diamond, M., & Klein, R. S. (2019) · Neuron · doi:10.1016/j.neuron.2019.07.015 · Cited by 137
Miners, J. S., Kehoe, P. G., Love, S., Zetterberg, H., & Blennow, K. (2019) · Alzheimer s Research & Therapy · doi:10.1186/s13195-019-0534-8 · Cited by 143
PDGF/PDGFR axis in the neural systems
Sil, S., Periyasamy, P., Thangaraj, A., Chivero, E. T., & Buch, S. J. (2018) · Molecular Aspects of Medicine · doi:10.1016/j.mam.2018.01.006 · Cited by 141
“Recently, it has been shown that PdgfrβF7/F7 mutant mice with disrupted PDGFR-β signaling showed an early and progressive region-dependent loss of brain pericytes and vascular smooth muscle cells (VSMCs) in the developing brain, leading to an aggressive and rapid microvascular phenotype without the early involvement o…”
BackgroundPathological changes within the cerebral vasculature in Alzheimer’s disease: New perspectives
Fisher, R. A., Miners, J. S., & Love, S. (2022) · Brain Pathology · doi:10.1111/bpa.13061 · Cited by 133
Endothelial LRP1 protects against neurodegeneration by blocking cyclophilin A
Nikolakopoulou, A. M., Wang, Y., Ma, Q., Sagare, A. P., Montagne, A., Huuskonen, M. T., Rege, S. V., Kisler, K., Dai, Z., Körbelin, J., et al. (2021) · The Journal of Experimental Medicine · doi:10.1084/jem.20202207 · Cited by 131
Self-citationAlzheimer’s Retinopathy: Seeing Disease in the Eyes
Mirzaei, N., Shi, H., Oviatt, M., Doustar, J., Rentsendorj, A., Fuchs, D.-T. S., Sheyn, J., Black, K. L., Koronyo, Y., & Koronyo‐Hamaoui, M. (2020) · Frontiers in Neuroscience · doi:10.3389/fnins.2020.00921 · Cited by 136
Faal, T., Phan, D. T. T., Davtyan, H., Scarfone, V. M., Varady, E., Blurton-Jones, M., Hughes, C. C. W., & Inlay, M. A. (2019) · Stem Cell Reports · doi:10.1016/j.stemcr.2019.01.005 · Cited by 124
Smyth, L. C. D., Highet, B., Jansson, D., Wu, J., Rustenhoven, J., Aalderink, M., Tan, A. Y. S., Li, S., Johnson, R. H., Coppieters, N., et al. (2022) · Communications Biology · doi:10.1038/s42003-022-03180-8 · Cited by 123
PDGFR-β restores blood-brain barrier functions in a mouse model of focal cerebral ischemia
Shen, J., Xu, G., Zhu, R., Yuan, J., Ishii, Y., Hamashima, T., Matsushima, T., Yamamoto, S., Takatsuru, Y., Nabekura, J., et al. (2018) · Journal of Cerebral Blood Flow & Metabolism · doi:10.1177/0271678x18769515 · Cited by 105
Tsao, C.-C., Baumann, J., Huang, S., Kindler, D., Schroeter, A., Kachappilly, N., Gassmann, M., Rudin, M., & Ogunshola, O. O. (2021) · Angiogenesis · doi:10.1007/s10456-021-09796-4 · Cited by 103
Blood-brain barrier disruption: a culprit of cognitive decline?
Che, J., Sun, Y., Deng, Y., & Zhang, J. (2024) · Fluids and Barriers of the CNS · doi:10.1186/s12987-024-00563-3 · Cited by 111
“PDGFRβ knockout model exhibits pericyte deficiency and progressive BBB damage secondary to hemodynamic disturbances [15], causing vascular and perivascular calcium accumulation.”
BackgroundThe blood–brain barrier: a help and a hindrance
Rust, R., Yin, H. R., Buil, B. A., Sagare, A. P., & Kisler, K. (2025) · Brain · doi:10.1093/brain/awaf068 · Cited by 109
“48-53 All peri-cytes develop projections that grow along and enwrap the endothelium, but present with heterogenous morphologies that depend on their location in the vascular tree.”
Yamazaki, Y., Shinohara, M., Yamazaki, A., Ren, Y., Asmann, Y. W., Kanekiyo, T., & Bu, G. (2020) · Arteriosclerosis, Thrombosis, and Vascular Biology · doi:10.1161/atvbaha.119.313169 · Cited by 89
Wang, L., & Mao, X. (2021) · International Journal of Molecular Sciences · doi:10.3390/ijms22052360 · Cited by 86
“This mechanism reflects what has been described in the brain in association with BBB breakdown, which has been demonstrated to be related to cognitive decline in AD patients [51,182,183].”
BackgroundEndothelial BACE1 Impairs Cerebral Small Vessels via Tight Junctions and eNOS
Zhou, H., Gao, F., Yang, X., Lin, T., Li, Z., Wang, Q., Yao, Y., Li, L., Ding, X., Shi, K., et al. (2022) · Circulation Research · doi:10.1161/circresaha.121.320183 · Cited by 82
A “multi-omics” analysis of blood–brain barrier and synaptic dysfunction in APOE4 mice
Barisano, G., Kisler, K., Wilkinson, B., Nikolakopoulou, A. M., Sagare, A. P., Wang, Y., Gilliam, W., Huuskonen, M. T., Hung, S.-T., Ichida, J. K., et al. (2022) · Journal of Experimental Medicine · doi:10.1084/jem.20221137 · Cited by 78
“…were reconstructed, and the areas occupied by CD13 + -PC on brain capillary lectin + -en- dothelial profiles (<6 µm in diameter) were analyzed using ImageJ, as previously described (Nikolakopoulou et al., 2017; Nikolakopoulou et al., 2019; Nikolakopoulou et al., 2021; Montagne et al., 2021).”
Self-citationVulnerability of the Hippocampus to Insults: Links to Blood–Brain Barrier Dysfunction
Davidson, T. L., & Stevenson, R. J. (2024) · International Journal of Molecular Sciences · doi:10.3390/ijms25041991 · Cited by 80
“Another study involving members of the same research group [202] reported that a transgenic mouse model exhibited a progressive, age-related loss of pericyte coverage and BBB break-down, which was not confined to the hippocampus, but was also observed in the cortex and thalamus.”
BackgroundDivecha, Y. A., Rampes, S., Tromp, S., Boyanova, S., Fleckney, A. L., Fidanboylu, M., & Thomas, S. A. (2025) · Pharmacological Reviews · doi:10.1016/j.pharmr.2025.100052 · Cited by 83
“However, PDGFR b is expressed in vascular smooth muscle cells, but its concentration is higher in pericytes, and pericytes are more sensitive to PDGFR b depletion (Nikolakopoulou et al, 2017).”
Wu, Y., Wu, H., Zeng, J., Pluimer, B. R., Dong, S., Xie, X., Guo, X., Ge, T., Liang, X., Feng, S., et al. (2021) · Acta Neuropathologica Communications · doi:10.1186/s40478-021-01178-7 · Cited by 76
“…coverage, ten-micron maximum projection z-stacks were reconstructed, and the areas occupied by CD13-positive (pericyte) and lectin-positive (endothelium) fluorescent signals on vessels ≤ 6 µm were subjected separately to threshold processing and analyzed using ImageJ as previously described [32].”
MethodInfluentialSelf-citationAcute Ablation of Cortical Pericytes Leads to Rapid Neurovascular Uncoupling
Kisler, K., Nikolakopoulou, A. M., Sweeney, M. D., Lazić, D., Zhao, Z., & Zloković, B. V. (2020) · Frontiers in Cellular Neuroscience · doi:10.3389/fncel.2020.00027 · Cited by 73
“In each animal, 4–6 randomly selected fields (640 × 480 μm) in the somatosensory cortex were analyzed from four non-adjacent sections (∼100 μm apart), and averaged per mouse, as we have previously described (Bell et al., 2010; Nikolakopoulou et al., 2017).”
BackgroundMethodInfluentialSelf-citationLoss of Regulator of G-Protein Signaling 5 Leads to Neurovascular Protection in Stroke
Özen, Í., Roth, M., Barbariga, M., Gaceb, A., Deierborg, T., Genové, G., & Paul, G. (2018) · Stroke · doi:10.1161/strokeaha.118.020124 · Cited by 69
A Practical Guide to the Automated Analysis of Vascular Growth, Maturation and Injury in the Brain
Rust, R., Kirabali, T., Grönnert, L., Doğançay, B., Limasale, Y. D. P., Meinhardt, A., Werner, C., Laviña, B., Kulic, L., Nitsch, R. M., et al. (2020) · Frontiers in Neuroscience · doi:10.3389/fnins.2020.00244 · Cited by 60
“The measured pericyte coverage of blood vessels in our samples (both human and mice) ranged between 40–60% and has been previously reported to be around 80% (Nikolakopoulou et al., 2017; Montagne et al., 2018).”
BackgroundA Leaky Blood–Brain Barrier to Fibrinogen Contributes to Oxidative Damage in Alzheimer’s Disease
McLarnon, J. G. (2021) · Antioxidants · doi:10.3390/antiox11010102 · Cited by 63
“to AD, mice incorporating multiple gene mutations were used to reduce the number of functional pericytes [54].”
MethodCocaine-induced release of CXCL10 from pericytes regulates monocyte transmigration into the CNS
Niu, F., Liao, K., Hu, G., Sil, S., Callen, S. E., Guo, M., Yang, L., & Buch, S. J. (2019) · The Journal of Cell Biology · doi:10.1083/jcb.201712011 · Cited by 56
“For MIVs, only those with a diameter <6 μm were used for quantification for both pericyte coverage and fibrinogen leakage, which were described previously (Mehla et al., 2012; Nikolakopoulou et al., 2017).”
MethodQuantitative Relationship Between Cerebrovascular Network and Neuronal Cell Types in Mice
Wu, Y.-T., Bennett, H. C., Chon, U., Vanselow, D. J., Zhang, Q., Muñoz-Castañeda, R., Cheng, K. C., Osten, P., Drew, P. J., & Kim, Y. (2022) · Cell Reports · doi:10.1016/j.celrep.2022.110978 · Cited by 60
“Interestingly, thalamic pericytes have shown resistance to disrupted PDGFRb signaling, whereas cortical and striatal pericytes were more vulnerable (Nikolakopoulou et al., 2017).”
BackgroundIn Vivo Targeting of the Neurovascular Unit: Challenges and Advancements
Naranjo, O., Osborne, O., Torices, S., & Toborek, M. J. (2021) · Cellular and Molecular Neurobiology · doi:10.1007/s10571-021-01113-3 · Cited by 57
Disruption of the Blood-Brain Barrier During Neuroinflammatory and Neuroinfectious Diseases
Salimi, H., & Klein, R. S. (2019) · Contemporary clinical neuroscience · doi:10.1007/978-3-030-19515-1_7 · Cited by 56
“While Pdgfrβ mice and mice with modified PDGF-BB bioavailability are viable, they exhibit reductions in pericyte coverage along vasculature, leading to poor maintenance of BBB function and increased permeability [33].”
BackgroundZhao, Q., Dai, W., Chen, H. Y., Jacobs, R. E., Zlokovic, B. V., Lund, B. T., Montagne, A., & Bonnin, A. (2022) · Proceedings of the National Academy of Sciences · doi:10.1073/pnas.2113310119 · Cited by 52
Self-citationThe Role of Basement Membranes in Cerebral Amyloid Angiopathy
Howe, M. D., McCullough, L. D., & Urayama, A. (2020) · Frontiers in Physiology · doi:10.3389/fphys.2020.601320 · Cited by 50
“Nidogen-1 • Brain microvessels (Niquet and Represa, 1996) • Astrocytes (Grimpe et al., 1999) • Endothelial cells (Thomsen et al., 2017a) • Meningeal cells (Sievers et al., 1994) Nidogen-2 • Brain microvessels (Keable et al., 2016) • Endothelial cells (Thomsen et al., 2017a)”
BackgroundLocation Matters: Navigating Regional Heterogeneity of the Neurovascular Unit
Bernier, L., Brunner, C., Cottarelli, A., & Balbi, M. (2021) · Frontiers in Cellular Neuroscience · doi:10.3389/fncel.2021.696540 · Cited by 52
Pericytes Across the Lifetime in the Central Nervous System
Bennett, H. C., & Kim, Y. (2021) · Frontiers in Cellular Neuroscience · doi:10.3389/fncel.2021.627291 · Cited by 49
Cellular and Molecular Heterogeneity Associated with Vessel Formation Processes
Castro, P. R., Barbosa, A. S., Pereira, J. M., Ranfley, H., Felipetto, M., Gonçalves, C. A. X., Paiva, I. R., Berg, B. B., & Barcelos, L. S. (2018) · BioMed Research International · doi:10.1155/2018/6740408 · Cited by 47
“A recent study shows that PDGFR-βF7/F7 mice, which carry seven-point mutations which disrupt PDGFR-β signalling, have a loss of pericytes and SMC during brain development, but only a progressive region-dependent loss of BP on cortex, hippocampus, and striatum after birth; SMC populations were not affected at the time…”
Pericytes: Problems and Promises for CNS Repair
Laredo, F., Plebanski, J., & Tedeschi, A. (2019) · Frontiers in Cellular Neuroscience · doi:10.3389/fncel.2019.00546 · Cited by 44
“80% reduction in pericyte coverage) where PDGF-B binding to heparan sulfate proteoglycans is disrupted and PDGFRβF7/F7 mice which have approximately 40% of the pericytes coverage of control littermates, have elucidated the impact that loss of pericytes has on the BBB (Lindblom et al., 2003; Armulik et al., 2010; Danem…”
BackgroundLiu, G., Wang, J., Wei, Z., Fang, C., Shen, K., Cheng, Q., Qi, C., Li, T., Gao, P., Wong, P. C., et al. (2023) · Advanced Science · doi:10.1002/advs.202206938 · Cited by 44
Wu, S. Z., Masurkar, A. V., & Balcer, L. J. (2020) · Frontiers in Aging Neuroscience · doi:10.3389/fnagi.2020.572337 · Cited by 38
“Within the brain, platelet-derived growth factor receptor β signaling is proposed to play a role in preserving pericyte count and thus maintaining the blood-brain barrier (Nikolakopoulou et al., 2017).”
BackgroundLü, L., Huang, L., Wang, L., Wu, Y., Chen, Z., & Liu, L. (2021) · Frontiers in Aging Neuroscience · doi:10.3389/fnagi.2021.775244 · Cited by 38
Blood–Brain Barrier ( BBB ) Dysfunction in CNS Diseases: Paying Attention to Pericytes
Yu, T., Wang, Z., Chen, Y., Xiang, Y., Wu, M., Zhang, M., Yin, X., & Chen, Z. (2025) · CNS Neuroscience & Therapeutics · doi:10.1111/cns.70422 · Cited by 37
“Previous studies have shown that pericyte loss and vascular platelet-derived growth factor receptor-β (PDGFRβ) signaling defects are significant features of BBB dysfunction in AD [35].”
da Silva, R. A., Fernandes, C. J. D. C., Feltran, G. D. S., Gomes, A. M., Andrade, A. F. D. C., Andia, D. C., Peppelenbosch, M. P., & Zambuzzi, W. F. (2018) · Journal of Cellular Physiology · doi:10.1002/jcp.27374 · Cited by 33
Wang, K., Zhang, H., He, Y., Jiang, Q., Tanaka, Y., Park, I., Pober, J. S., Wang, M., & Zhou, H. J. (2020) · Arteriosclerosis Thrombosis and Vascular Biology · doi:10.1161/atvbaha.120.314586 · Cited by 33
Role of pericytes in the development of cerebral cavernous malformations
Dai, Z., Li, J., Li, Y., Wang, R., Yan, H., Xiong, Z., Wu, S., Yang, X., Lu, D., Zhang, D., et al. (2022) · iScience · doi:10.1016/j.isci.2022.105642 · Cited by 28
Pericytes in Alzheimer’s Disease: Novel Clues to Cerebral Amyloid Angiopathy Pathogenesis
Salmina, A. B., Komleva, Y. K., Lopatina, O. L., & Birbrair, A. (2019) · Advances in experimental medicine and biology · doi:10.1007/978-3-030-16908-4_7 · Cited by 29
Hort, J., Vališ, M., Kuča, K., & Angelucci, F. (2019) · International Journal of Molecular Sciences · doi:10.3390/ijms20102405 · Cited by 27
“The mechanism of pericyte loss in neurodegenerative disorders has not been yet elucidated [107].”
BackgroundAstrocytes Are a Key Target for Neurotropic Viral Infection
Potokar, M., Zorec, R., & Jorgačevski, J. (2023) · Cells · doi:10.3390/cells12182307 · Cited by 23
“In addition to endothelial cells, astrocytes and pericytes are critical for the development and maintenance of the BBB by regulating the TJs [23–25] (see also Figure 1B).”
BackgroundPeripheral Routes to Neurodegeneration: Passing Through the Blood–Brain Barrier
Giannoni, P., Claeysen, S., Noè, F. M., & Marchi, N. (2020) · Frontiers in Aging Neuroscience · doi:10.3389/fnagi.2020.00003 · Cited by 25
Pericytes in Alzheimer's disease: Key players and therapeutic targets
Zhang, Y., Mu, B., Zhao, R., Zhu, T., Huang, X., Yang, X., Wang, D., Ma, Q., & Lu, M. (2024) · Experimental Neurology · doi:10.1016/j.expneurol.2024.114825 · Cited by 24
Blood-brain barrier biomarkers
Zapata-Acevedo, J. F., Mantilla-Galindo, A., Vargas-Sánchez, K., & González-Reyes, R. E. (2024) · Advances in clinical chemistry · doi:10.1016/bs.acc.2024.04.004 · Cited by 23
Platelet-derived growth factor signalling in neurovascular function and disease
Li, S. Y., Johnson, R. H., Smyth, L. C. D., & Dragunow, M. (2022) · The International Journal of Biochemistry & Cell Biology · doi:10.1016/j.biocel.2022.106187 · Cited by 22
Wang, Y., Kisler, K., Nikolakopoulou, A. M., Fernández, J. A., Griffin, J. H., & Zloković, B. V. (2022) · Frontiers in Neuroscience · doi:10.3389/fnins.2022.841916 · Cited by 20
Self-citationPericyte infection by HIV-1: a fatal attraction
Naranjo, O., Torices, S., Clifford, P. R., Daftari, M., Osborne, O., Fattakhov, N. S., & Toborek, M. J. (2022) · Retrovirology · doi:10.1186/s12977-022-00614-3 · Cited by 19
Neurovascular glial unit: A target of phytotherapy for cognitive impairments
Chen, L., Zhen, Y., Wang, X., Wang, J., & Zhu, G. (2023) · Phytomedicine · doi:10.1016/j.phymed.2023.155009 · Cited by 19
Molecular signature and functional properties of human pluripotent stem cell-derived brain pericytesPreprint
Rust, R., Sagare, A. P., Kisler, K., Kim, Y., Zhang, M., Griffin, C., Wang, Y., Clementel, V. A., Shwartz, A., Fraser, S. E., et al. (2023) · bioRxiv (Cold Spring Harbor Laboratory) · doi:10.1101/2023.06.26.546577 · Cited by 18
Rnf-213 Knockout Induces Pericyte Reduction and Blood-Brain Barrier Impairment in Mouse
Li, W., Niu, X., Dai, Y., Wu, X., Li, J., & Sheng, W. (2023) · Molecular Neurobiology · doi:10.1007/s12035-023-03480-y · Cited by 17
“The quantification analysis of pericyte coverage and numbers was restricted to CD13-positive pericyte that were associated with brain capillaries defined as vessels with ≤ 6 μm in diameter, as previously described [34, 35].”
MethodTada, S., Okuno, T., Shimizu, M., Sakai, Y., Sumi‐Akamaru, H., Kinoshita, M., Yamashita, K., Sanda, E., Choong, C., Namba, A., et al. (2019) · Scientific Reports · doi:10.1038/s41598-019-41771-4 · Cited by 18
Gradual Not Sudden Change: Multiple Sites of Functional Transition Across the Microvascular Bed
Shaw, K., Boyd, K., Anderle, S., Hammond‐Haley, M., Amin, D., Bonnar, O., & Hall, C. N. (2022) · Frontiers in Aging Neuroscience · doi:10.3389/fnagi.2021.779823 · Cited by 14
“, 2015) and mutations that block PDGFRβ signaling reduce pericyte number and increase capillary leakiness, without affecting smooth muscle cells (Nikolakopoulou et al., 2017).”
BackgroundSelhorst, S., Nakisli, S., Kandalai, S., Adhicary, S., & Nielsen, C. M. (2022) · Frontiers in Human Neuroscience · doi:10.3389/fnhum.2022.974033 · Cited by 14
“For example, Pdgf-B/Pdgfrβ signaling between ECs and pericytes is critical for recruiting pericytes to microvessels and maintaining the cells’ close juxtaposition (Armulik et al., 2010; Daneman et al., 2010; Chen et al., 2017; Nikolakopoulou et al., 2017).”
BackgroundYang, K., Zhang, Z., Zhang, Q., Zhang, H., Liu, X., Jia, Z., Ying, Z., & Liu, W. (2024) · Journal of Periodontal Research · doi:10.1111/jre.13220 · Cited by 11
Rudnitskaya, E. A., Kozlova, T., Burnyasheva, A. O., Peunov, D., Tyumentsev, M., Stefanova, N. A., & Kolosova, N. G. (2023) · International Journal of Molecular Sciences · doi:10.3390/ijms242115649 · Cited by 10
“Moreover, loss-of-function mutations in the PDGFB gene within the endothelium or in the PDGFRB gene within pericytes can cause primary familial brain calcification, which is characterized by per-Int icyte loss and neurological symptoms including motor and cognitive impairments [40,41].”
BackgroundAli, H. T., Sula, I., AbuHamdia, A., Elejla, S. A., Elrefaey, A., Hamdar, H., & Elfil, M. (2024) · Journal of Molecular Neuroscience · doi:10.1007/s12031-024-02193-8 · Cited by 12
“Growth factors and neurotrophic factors have significant therapeutic potential in neurotrauma; however, their use in clinical applications is still an active area of research (Kahn and De Vellis 1995; Nikolakopoulou et al. 2017; Wofford et al. 2019).”
BackgroundGyőri, F., Mészáros, Á., Krecsmarik, M., Molnár, K., Baltă, C., Hermenean, A. O., Farkas, A. E., Krizbai, I. A., & Wilhelm, I. (2024) · GeroScience · doi:10.1007/s11357-024-01429-0 · Cited by 9
“In mouse models of ageing, pericyte vulnerability and decreased remodelling were shown to result in BBB opening or deficits in CBF [18, 36, 37].”
Partial Mural Cell Ablation Disrupts Coronary Vasculature Integrity and Induces Systolic Dysfunction
Cornuault, L., Hérion, F.-X., Bourguignon, C., Rouault, P., Foussard, N., Alzieu, P., Chapouly, C., Gadeau, A., Couffinhal, T., & Renault, M. (2023) · Journal of the American Heart Association · doi:10.1161/jaha.122.029279 · Cited by 11
Alterations in Retinal Signaling Across Age and Sex in 3xTg Alzheimer’s Disease Mice
Frame, G., Schuller, A. J., Smith, M. A., Crish, S. D., & Crish, S. D. (2022) · Journal of Alzheimer s Disease · doi:10.3233/jad-220016 · Cited by 8
P2Y1 receptor in Alzheimer’s disease
Luo, S., Wang, Y., & Hisatsune, T. (2024) · Neural Regeneration Research · doi:10.4103/nrr.nrr-d-23-02103 · Cited by 8
“Indeed, pericyte depletion, which can be measured with the pericyte marker platelet-derived growth factor receptor-β (PDGFRβ) in the BBB, is strongly linked to the functional collapse of BBB (Nikolakopoulou et al., 2017).”
BackgroundBannykh, K. S., Fuentes-Fayos, A. C., Linesch, P. W., Breunig, J. J., & Bannykh, S. I. (2024) · Journal of Histochemistry & Cytochemistry · doi:10.1369/00221554241281896 · Cited by 7
Nguyen, E. H., Dombroe, M. J., Fisk, D. L., Daly, W. T., Sorenson, C. M., Murphy, W. L., & Sheibani, N. (2019) · Applied In Vitro Toxicology · doi:10.1089/aivt.2018.0025 · Cited by 7
The physiological functions of central nervous system pericytes and a potential role in pain
Beazley‐Long, N., Durrant, A. M., Swift, M. N., & Donaldson, L. F. (2018) · F1000Research · doi:10.12688/f1000research.13548.1 · Cited by 7
“Mice with deficient PDGFR β signalling ( pdgfr β F7/F7 ) demonstrated region-dependent losses in pericytes that related to BBB breakdown 35 .”
BackgroundPericytes in the optic nerve head
Waxman, S., Villafranca‐Baughman, D., Phillippi, J. A., Jakobs, T., Alarcón-Martínez, L., Polo, A. D., & Sigal, I. A. (2025) · Progress in Retinal and Eye Research · doi:10.1016/j.preteyeres.2025.101375 · Cited by 6
Zhang, M., Kim, Y., Bosworth, A., Julia, T. C. W., Nih, L. R., Kisler, K., Sagare, A. P., & Rust, R. (2025) · Stem Cells · doi:10.1093/stmcls/sxaf055 · Cited by 7
The liver and muscle secreted HFE2-protein maintains central nervous system blood vessel integrity
Wang, X. F., Vigouroux, R. J., Syonov, M., Baglaenko, Y., Nikolakopoulou, A. M., Ringuette, D., Rus, H., DiStefano, P. V., Dufour, S., Shabanzadeh, A. P., et al. (2024) · Nature Communications · doi:10.1038/s41467-024-45303-1 · Cited by 8
Self-citationSun, C., Liu, J., Li, N., Liu, M., Luo, Z., & Li, H. (2021) · Evidence-based Complementary and Alternative Medicine · doi:10.1155/2021/6648455 · Cited by 6
“Several studies using transgenic animal models harboring PDGFR-i-derived genes have demonstrated the functional effects of disruption of the PDGF-B/PDGFR-initiated signaling pathway [34, 35].”
BackgroundRole of receptor tyrosine kinases in neurodegenerative disorders
Fu, L., & Liu, B. (2023) · Elsevier eBooks · doi:10.1016/b978-0-443-18677-6.00002-6 · Cited by 6
Zhang, Y., Ren, Y., Zhang, Y., Li, Y., Xu, C., Peng, Z., Jia, Y., Qiao, S., Zhang, Z., & Shi, L. (2023) · Frontiers in Molecular Neuroscience · doi:10.3389/fnmol.2023.1073723 · Cited by 5
“Only Pdgfbret/ret mice, in which the tissue distribution of PDGF-B is altered, probably due to the loss of a proteoglycan-binding motif, develop brain calcification (Keller et al., 2013; Vanlandewijck et al., 2015; Nikolakopoulou et al., 2017; Nahar et al., 2020).”
BackgroundDisruption of the Blood-Brain Barrier During Neuroinflammatory and Neuroinfectious Diseases
Salimi, H., & Klein, R. S. (2024) · Springer eBooks · doi:10.1007/978-3-031-60006-7_7 · Cited by 4
Padti, A. C., Bhavi, S. M., Thokchom, B., Singh, S. R., Bhat, S. S., Harini, B. P., Sillanpää, M. E. T., & Yarajarla, R. B. (2025) · Neurochemical Research · doi:10.1007/s11064-025-04333-x · Cited by 6
Wu, Y., Li, P., Liu, L., Fan, H., & Liu, M. (2026) · Molecular Therapy · doi:10.1016/j.ymthe.2026.01.040 · Cited by 2
HDAC inhibition reprograms stem cell fate to suppress infantile hemangioma vasculogenesis
Chen, Q., Rong, H., Liu, C., Li, J., Zheng, J., & Bian, Q. (2026) · Angiogenesis · doi:10.1007/s10456-026-10057-5 · Cited by 2
“Analysis of pericyte coverage was performed based on sections co-stained with CD31 and αSMA as previously described [ 51 ].”
Atak, D., Yıldız, E., Özkan, E., Yousefi, M., Özkan, A., Yılmaz, A. B., Kızılırmak, A. B., Alnajjar, I. A., Kanar, Ç., Caan, Z. L., et al. (2025) · Journal of Neurochemistry · doi:10.1111/jnc.70035 · Cited by 2
A role for pericytes in chronic pain?
Durrant, A. M., Swift, M. N., & Beazley‐Long, N. (2018) · Current Opinion in Supportive and Palliative Care · doi:10.1097/spc.0000000000000342 · Cited by 1
Liu, J., Yin, X., & Dong, Y. (2024) · Scientific Reports · doi:10.1038/s41598-024-75694-6 · Cited by 1
“These pathological changes may ultimately be the cause of cognitive dysfunction 34,35 .”
BackgroundIn Vivo Optical Imaging and Manipulation of Brain Pericytes
Berthiaume, A., Coelho‐Santos, V., Hartmann, D. A., & Shih, A. Y. (2021) · Stem cell biology and regenerative medicine · doi:10.1007/978-3-030-62129-2_1 · Cited by 1
Cardiac pericytes are necessary for coronary vasculature integrity and cardiomyocyte differentiationPreprint
Cornuault, L., Hérion, F.-X., Rouault, P., Foussard, N., Alzieu, P., Chapouly, C., Gadeau, A., Couffinhal, T., & Renault, M. (2022) · bioRxiv (Cold Spring Harbor Laboratory) · doi:10.1101/2022.08.29.505703 · Cited by 1
“Then mice harboring mutations within the Pdgfrb gene (the Pdgfrbredeye/redeye mutant (Jadeja et al. 2013) and the PdgfrbF7/F7 mutant (Angeliki Maria Nikolakopoulou et al. 2017)) have been used.”
MethodBrain susceptibility to hypoxia/hypoxemia and metabolic dysfunction in Alzheimer's disease
Baldassarro, V. A., Bighinati, A., Sannia, M., Giardino, L., & Calzà, L. (2020) · Elsevier eBooks · doi:10.1016/b978-0-12-815868-5.00026-8
Jansson, D., & Iliff, J. J. (2023) · Springer eBooks · doi:10.1007/978-3-031-39558-1_8
Research Progress on Platelet-Derived Growth Factor and Blood-Brain Barrier
汪, 怡. (2025) · Advances in Clinical Medicine · doi:10.12677/acm.2025.151040
Kim, Y., Zhang, M., Bosworth, A., Julia, T. C. W., Nih, L. R., Kisler, K., Sagare, A. P., & Rust, R. (2025) · bioRxiv (Cold Spring Harbor Laboratory) · doi:10.1101/2025.04.10.648232
“All samples were stained and imaged using identical image acquisition settings; images were processed and analyzed using ImageJ (Fiji), similar to previous studies 30 .”
Cerebrovascular p16INK4A expression induces cerebral small vessel disease-related phenotypes
Kawatani, K., Aikawa, T., Tabrizi, Z., Pan, Y., Ren, Y., Wang, N., Kurti, A., Nambara, T., Ikezu, C. C., Shue, F., et al. (2025) · Acta Neuropathologica Communications · doi:10.1186/s40478-025-02085-x
Youssef, P., Chua, M., Andersson, L. I., Galper, J., Gunawardana, C. W., Matar, E., Halliday, G. M., Lewis, S. J. G., & Dzamko, N. L. (2025) · Parkinsonism & Related Disorders · doi:10.1016/j.parkreldis.2025.108094
Metadata
- Authors
- Nikolakopoulou, A. M., Zhao, Z., Montagne, A., & Zlokovic, B. V.
- Affiliations
- University of Southern California (US)
- Venue
- PLOS ONE
- Publisher
- Public Library of Science (PLoS)
- Published
- 2017-04-25
- Volume
- 12
- Issue
- 4
- Pages
- e0176225
- ISSN
- 1932-6203 (ISSN-L)
- PMC
- PMC5404855
- OpenAlex
- W2607556181
- Cited by
- 109
- References
- 44
- Citations by year
- 2026: 7 · 2025: 12 · 2024: 12 · 2023: 10 · 2022: 17 · 2021: 13 · 2020: 11 · 2019: 14 · 2018: 12 · 2017: 1
- FWCI
- 5.18
- Type
- journal article
- Language
- en
- Open access
- gold
- doi.org
- Licence
- Locations
- PLoS ONE (publishedVersion, cc-by)
- PubMed Central (publishedVersion, cc-by)
- PubMed (publishedVersion)
- DOAJ (DOAJ: Directory of Open Access Journals) (submittedVersion, cc-by-sa)
- Figshare (submittedVersion, cc-by)
- Funders
- National Institutes of Health (AG039452, AG023084, NS034467, NS100459)
- Topics
- Life Sciences › Neuroscience › Neurology › Barrier Structure and Function Studies
- Life Sciences › Biochemistry, Genetics and Molecular Biology › Molecular Biology › Angiogenesis and VEGF in Cancer
- Life Sciences › Neuroscience › Neurology › Neuroinflammation and Neurodegeneration Mechanisms
- Keywords
- brain pericytes, vascular smooth muscle cells, PDGFRβ signaling, PDGF-BB, pericyte loss, blood-brain barrier disruption, cerebral microvasculature, neurovascular unit
- MeSH terms
- Animals, Blood-Brain Barrier, Brain, Mice, Transgenic, Muscle, Smooth, Vascular, Signal Transduction, Pericytes, Receptor, Platelet-Derived Growth Factor beta, Myocytes, Smooth Muscle, Mice
About these checks
Registry, retraction, Cites and statistics results are computed, not judged, with one exception: a printed reference that no index lists is read once by a model before it counts as a citation error. Claims are extracted by a model and kept only when their quote appears verbatim in the text; each cited source is then checked, with a model’s help, for whether it says what the claim relies on. Those verdicts can be wrong — read the claim’s quote and the cited source before relying on one.
Statistics and arithmetic are recomputed, not judged.
Confidence bands are shown only for fields calibrated on our annotated test set. None is calibrated yet, so no band is shown.
What counts as a claim ›How we measure confidence ›How we check this ›
Are you an author, or do you see a problem with this page? Request a review
