

The DOI matches its Crossref record; 87 of the 87 references it cites were found in a registry or an index.
IRF-3, IRF-5, and IRF-7 Coordinately Regulate the Type I IFN Response in Myeloid Dendritic Cells Downstream of MAVS Signaling
Open accessAbstract
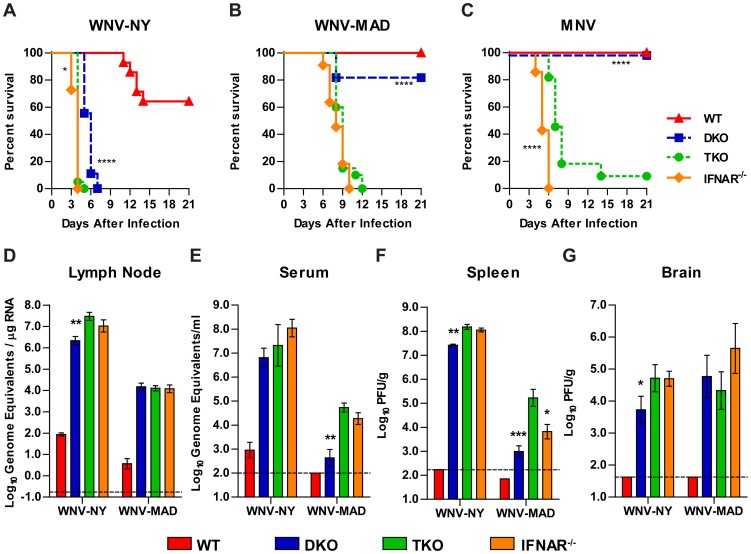
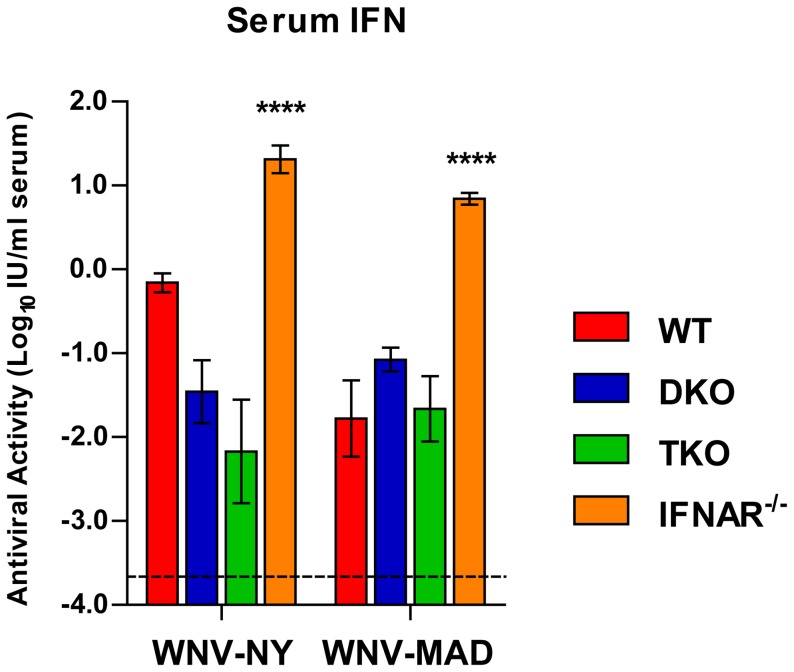
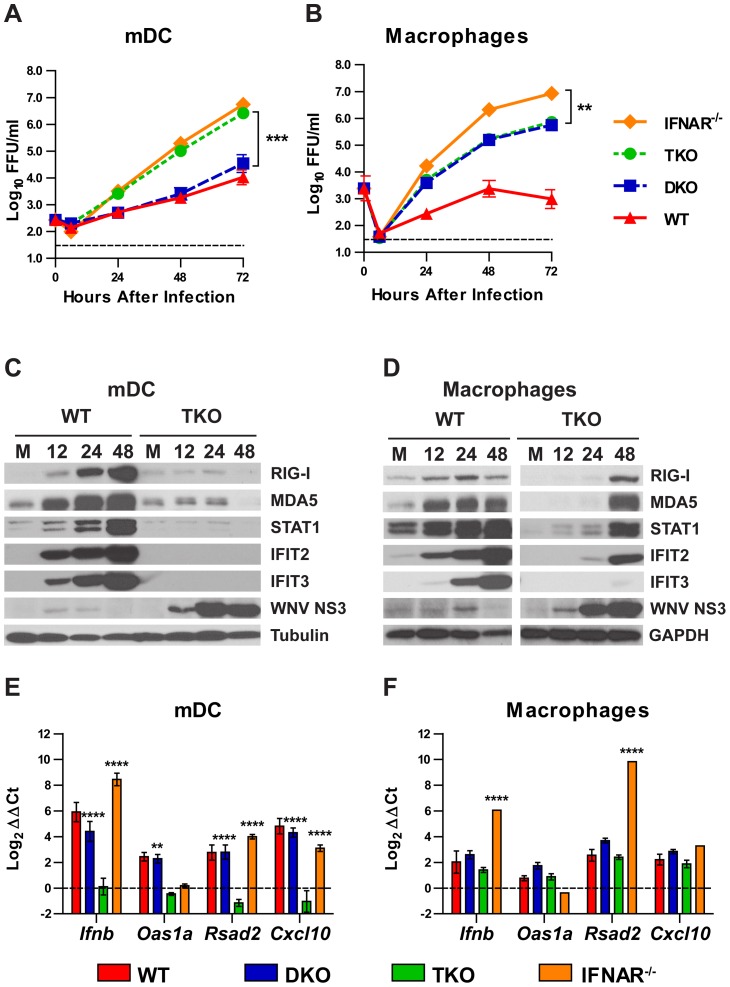
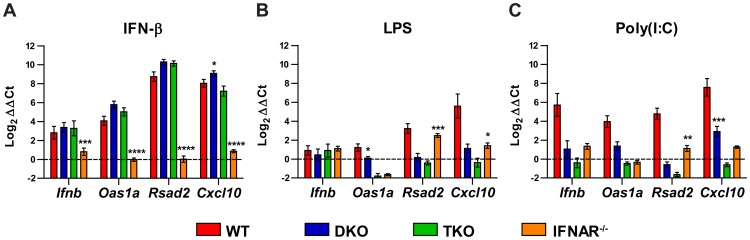
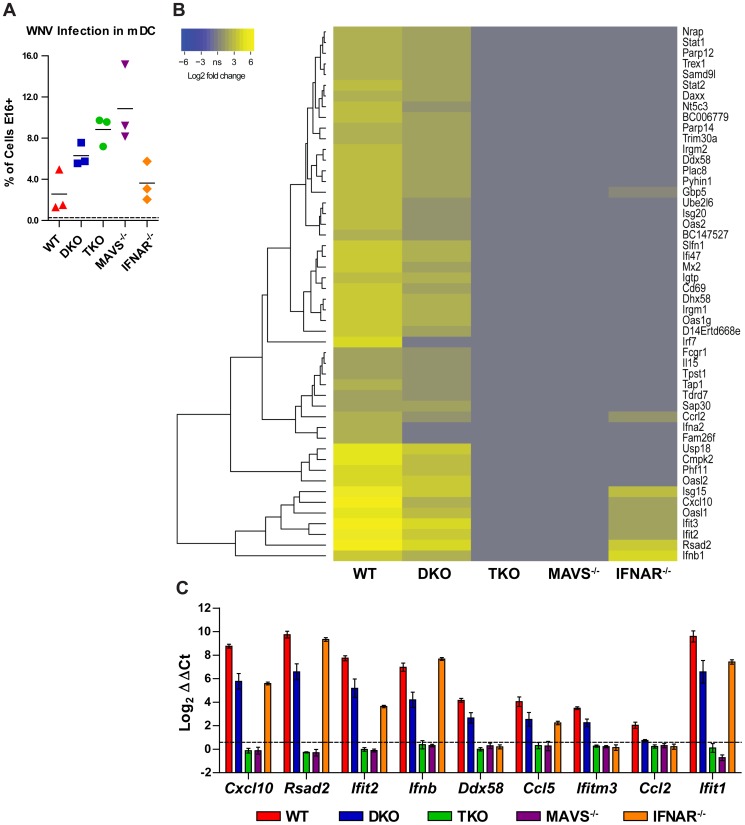
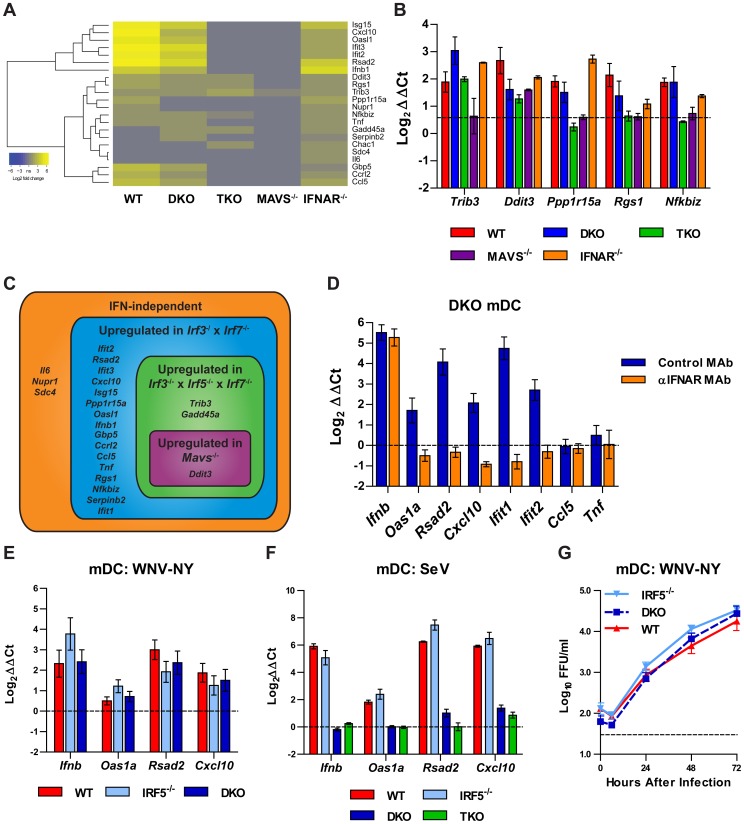
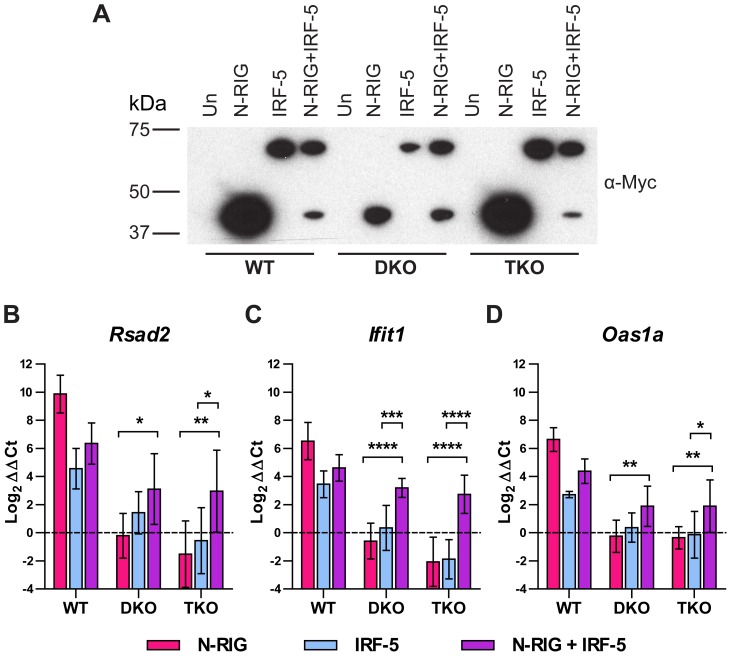
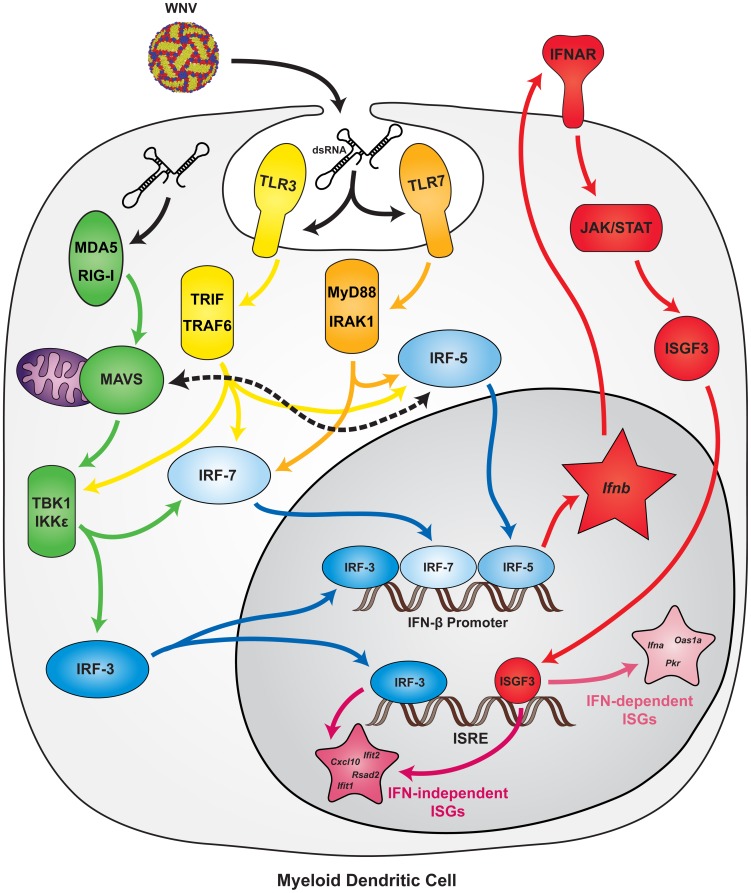
Although the transcription factors IRF-3 and IRF-7 are considered master regulators of type I interferon (IFN) induction and IFN stimulated gene (ISG) expression, Irf3(-/-)×Irf7(-/-) double knockout (DKO) myeloid dendritic cells (mDC) produce relatively normal levels of IFN-β after viral infection. We generated Irf3(-/-)×Irf5(-/-)×Irf7(-/-) triple knockout (TKO) mice to test whether IRF-5 was the source of the residual induction of IFN-β and ISGs in mDCs. In pathogenesis studies with two unrelated positive-sense RNA viruses (West Nile virus (WNV) and murine norovirus), TKO mice succumbed at rates greater than DKO mice and equal to or approaching those of mice lacking the type I IFN receptor (Ifnar(-/-)). In ex vivo studies, after WNV infection or exposure to Toll-like receptor agonists, TKO mDCs failed to produce IFN-β or express ISGs. In contrast, this response was sustained in TKO macrophages following WNV infection. To define IRF-regulated gene signatures, we performed microarray analysis on WNV-infected mDC from wild type (WT), DKO, TKO, or Ifnar(-/-) mice, as well as from mice lacking the RIG-I like receptor adaptor protein MAVS. Whereas the gene induction pattern in DKO mDC was similar to WT cells, remarkably, almost no ISG induction was detected in TKO or Mavs(-/-) mDC. The relative equivalence of TKO and Mavs(-/-) responses suggested that MAVS dominantly regulates ISG induction in mDC. Moreover, we showed that MAVS-dependent induction of ISGs can occur through an IRF-5-dependent yet IRF-3 and IRF-7-independent pathway. Our results establish IRF-3, -5, and -7 as the key transcription factors responsible for mediating the type I IFN and ISG response in mDC during WNV infection and suggest a novel signaling link between MAVS and IRF-5.
Overview
The claims and statistics of this paper haven’t been checked yet.
Run the check — free, no account needed. It reads the open-access text and checks the sources it cites.
Integrity signals
Registry
Cites
Statistics
Figures
Verification
Claims the paper makes
The claims and statistics of this paper haven’t been checked yet.
Run the check — free, no account needed. It reads the open-access text and checks the sources it cites.
Claims other papers make about this one
Each is checked against this paper’s own text: does it say what the citing paper says it does?
In the citing paper
“Enhanced IFN-regulatory factor activity might also explain the observed increase in CXCL9-11 and CXCL13 (Kanda and Watanabe, 2007; Lazear et al., 2013; Muthalagu et al., 2020).”
From SHP2 inhibition diminishes KRASG12C cycling and promotes tumor microenvironment remodeling (2021) · cites this paper as Lazear et al., 2013
Self-check
Percentages, sums and reported differences re-computed from the paper’s own numbers.
The self-check needs the paper’s full text.
Citations
Cites
Analysis of Relative Gene Expression Data Using Real-Time Quantitative PCR and the 2−ΔΔCT Method
Livak, K. J., & Schmittgen, T. D. (2001) · Methods · doi:10.1006/meth.2001.1262 · Cited by 180,860
limma: Linear Models for Microarray Data
Smyth, G. K. (2005) · Statistics for Biology and Health · doi:10.1007/0-387-29362-0_23 · Cited by 5,796
Mechanisms of type-I- and type-II-interferon-mediated signalling
Platanias, L. C. (2005) · Nature reviews. Immunology · doi:10.1038/nri1604 · Cited by 3,631
Bioinformatics and Computational Biology Solutions Using R and Bioconductor
Gentleman, R. C., Carey, V. J., Huber, W. K., Irizarry, R. A., & Dudoit, S. (2005) · Statistics in the health sciences · doi:10.1007/0-387-29362-0 · Cited by 3,470
A diverse range of gene products are effectors of the type I interferon antiviral response
Schoggins, J. W., Wilson, S. J., Panis, M., Murphy, M. Y., Jones, C. T., Bieniasz, P. D., & Rice, C. M. (2011) · Nature · doi:10.1038/nature09907 · Cited by 2,412
IRF-7 is the master regulator of type-I interferon-dependent immune responses
Honda, K., Yanai, H., Negishi, H., Asagiri, M., Sato, M., Mizutani, T., Shimada, N., Ohba, Y., Takaoka, A., Yoshida, N., et al. (2005) · Nature · doi:10.1038/nature03464 · Cited by 2,229
Interferon-inducible antiviral effectors
Sadler, A. J., & Williams, B. R. G. (2008) · Nature Reviews Immunology · doi:10.1038/nri2314 · Cited by 2,160
Type I Inteferon Gene Induction by the Interferon Regulatory Factor Family of Transcription Factors
Honda, K., Takaoka, A., & Taniguchi, T. (2006) · Immunity · doi:10.1016/j.immuni.2006.08.009 · Cited by 1,386
Toll-like receptor 3 mediates West Nile virus entry into the brain causing lethal encephalitis
Wang, T., Town, T., Alexopoulou, L., Anderson, J. F., Fikrig, E., & Flavell, R. A. (2004) · Nature Medicine · doi:10.1038/nm1140 · Cited by 1,142
Integral role of IRF-5 in the gene induction programme activated by Toll-like receptors
Takaoka, A., Yanai, H., Kondo, S., Duncan, G. S., Negishi, H., Mizutani, T., Kano, S., Honda, K., Ohba, Y., Mak, T. W., et al. (2005) · Nature · doi:10.1038/nature03308 · Cited by 1,066
Cited by
Sorted by citations
Shared and Distinct Functions of Type I and Type III Interferons
Lazear, H. M., Schoggins, J. W., & Diamond, M. S. (2019) · Immunity · doi:10.1016/j.immuni.2019.03.025 · Cited by 1,138
Self-citationA Mouse Model of Zika Virus Pathogenesis
Lazear, H. M., Govero, J., Smith, A. M., Platt, D. J., Fernandez, E., Miner, J. J., & Diamond, M. S. (2016) · Cell Host & Microbe · doi:10.1016/j.chom.2016.03.010 · Cited by 909
“, 2011), Irf3−/− Irf5−/− Irf7−/− TKO (Lazear et al., 2013), Mavs−/− (Suthar et al.”
BackgroundInfluentialSelf-citationGoubau, D., Deddouche, S., & Sousa, C. R. E. (2013) · Immunity · doi:10.1016/j.immuni.2013.05.007 · Cited by 875
“In addition to IRF-3 and IRF-7, IRF-5 might also induce type I IFN responses downstream of MAVS in some dendritic cells (Lazear et al., 2013).”
BackgroundType I Interferon in the Pathogenesis of Lupus
Crow, M. K. (2014) · The Journal of Immunology · doi:10.4049/jimmunol.1002795 · Cited by 581
“IRF5 might also be relevant to induction of IFN-I by cytoplasmic nucleic acid sensors (53, 54).”
BackgroundLi, W., Feng, G., Gauthier, J. M., Lokshina, I., Higashikubo, R., Evans, S., Liu, X., Hassan, A., Tanaka, S., Cicka, M., et al. (2019) · Journal of Clinical Investigation · doi:10.1172/jci126428 · Cited by 500
“Donor hearts that lacked expression of type I interferon receptor (IFNAR) or the combination of IRF3, IRF5 and IRF7 displayed increased neutrophil rolling velocity, failure of neutrophils to adhere to the vessel wall, and marked reductions in neutrophil extravasation into the myocardium compared to wildtype grafts (Fi…”
BackgroundInfluentialNegishi, H., Taniguchi, T., & Yanai, H. (2017) · Cold Spring Harbor Perspectives in Biology · doi:10.1101/cshperspect.a028423 · Cited by 467
“Additionally, IRF5 is involved in the RIG-I/MAVS signaling pathway (Yanai et al. 2007; Paun et al. 2008; Lazear et al. 2013).”
BackgroundVaginal Exposure to Zika Virus during Pregnancy Leads to Fetal Brain Infection
Yockey, L. J., Varela, L., Rakib, T., Khoury-Hanold, W., Fink, S. L., Stutz, B., Szigeti‐Buck, K., van den Pol, A. N., Lindenbach, B. D., Horváth, T. L., et al. (2016) · Cell · doi:10.1016/j.cell.2016.08.004 · Cited by 358
“This is consistent with previous studies showing that mice lacking IRF3 and IRF7 have an intact IFN-b responses to West Nile virus (Daffis et al., 2009; Lazear et al., 2013).”
Impact of mRNA chemistry and manufacturing process on innate immune activation
Nelson, J., Sorensen, E. W., Mintri, S., Rabideau, A. E., Zheng, W., Besin, G., Khatwani, N., Su, S. V., Miracco, E. J., Issa, W. J., et al. (2020) · Science Advances · doi:10.1126/sciadv.aaz6893 · Cited by 354
“MAVS, an adaptor protein that activates type I IFN through transcription factors IFN regulatory factor 3 (IRF3), IRF7, and NF- B ( 27 , 28 ), is downstream of both RIG-I and MDA5 ( 17 ).”
Ouyang, J., Zhu, X., Chen, Y., Wei, H., Chen, Q., Chi, X., Qi, B., Zhang, L., Zhao, Y. C., Gao, G. F., et al. (2014) · Cell Host & Microbe · doi:10.1016/j.chom.2014.10.001 · Cited by 344
“(Lazear et al., 2013).”
The Roles of Type I Interferon in Bacterial Infection
Boxx, G. M., & Cheng, G. (2016) · Cell Host & Microbe · doi:10.1016/j.chom.2016.05.016 · Cited by 335
“Interestingly, IRF5 appears to play a more dominant role in the induction of type I IFNs in response to bacterial pathogens (Bergstrom et al., 2015; Castiglia et al., 2016; Gratz et al., 2011; Pandey et al., 2009; Parker et al., 2014), and to a lesser extent against viruses (Lazear et al., 2013).”
BackgroundOnorati, M., Li, Z., Liu, F., Sousa, A. M. M., Nakagawa, N., Li, M., Dell’Anno, M. T., Gulden, F. O., Pochareddy, S., Tebbenkamp, A. T. N., et al. (2016) · Cell Reports · doi:10.1016/j.celrep.2016.08.038 · Cited by 292
“Given that other flaviviruses induce RLR-mediatedMAVS signaling (Lazear et al., 2013; Suthar et al., 2013), it is likely that mitochondrial relocalization of pTBK1 in ZIKV-infected NES cells and RGCs occurs via MAVS signaling.”
BackgroundThe regulation of inflammation by interferons and their STATs
Rauch, I., Müller, M. M., & Decker, T. (2013) · JAK-STAT · doi:10.4161/jkst.23820 · Cited by 292
Immune tolerance in liver disease
Crispe, I. N. (2014) · Hepatology · doi:10.1002/hep.27254 · Cited by 289
“In humans, classic mDCs (BDCA11) are present in the liver and depleted from the blood, but enriched in the liver in the context of HCV infection,25 where they undergo classic activation with increased expression of multiple costimulatory molecules.26 Human liver pDCs express BCDA2 and CD123 and respond to HCV to secre…”
BackgroundInfluentialSHP2 inhibition diminishes KRASG12C cycling and promotes tumor microenvironment remodeling
Fedele, C., Li, S., Teng, K. W., Foster, C. J. R., Peng, D., Ran, H., Mita, P., Geer, M. J., Hattori, T., Koide, A., et al. (2021) · Journal of Experimental Medicine · doi:10.1084/jem.20201414 · Cited by 265
“Enhanced IFN-regulatory factor activity might also explain the observed increase in CXCL9-11 and CXCL13 (Kanda andWatanabe, 2007; Lazear et al., 2013; Muthalagu et al., 2020).”
BackgroundImmune Response to Dengue and Zika
Ngono, A. E., & Shresta, S. (2018) · Annual Review of Immunology · doi:10.1146/annurev-immunol-042617-053142 · Cited by 269
“Based on studies showing that TLR3 and TLR7 can sense DENV infection in cells (122, 123) and that IRF-5 (85, 124, 125) and IRF-1 (126) contribute to host defense against ZIKV and the closely related WNV, MyD88/TRIF and IRF-5/IRF-1 signaling, respectively, are likely candidates for mediating MAVS-independent and IRF-3-…”
The IRF Family Transcription Factors at the Interface of Innate and Adaptive Immune ResponsesPreprint
Ikushima, H., Negishi, H., & Taniguchi, T. (2013) · Cold Spring Harbor Symposia on Quantitative Biology · doi:10.1101/sqb.2013.78.020321 · Cited by 273
“More recent study also showed the involvement of IRF5 in West Nile virus or murine norovirus infectionmediated Ifnb gene induction (Lazear et al. 2013).”
Pokatayev, V., Hasin, N., Chon, H., Cerritelli, S. M., Sakhuja, K., Ward, J. M., Morris, H. D., Yan, N., & Crouch, R. J. (2016) · Journal of Experimental Medicine · doi:10.1084/jem.20151464 · Cited by 245
Daniels, B. P., Holman, D. W., Cruz-Orengo, L., Jujjavarapu, H., Durrant, D. M., & Klein, R. S. (2014) · mBio · doi:10.1128/mbio.01476-14 · Cited by 235
“Thus, mice lacking type I IFN receptors, ligands, and key transcription factors exhibit expanded viral tropism and replication, resulting in accelerated and enhanced death (16, 18, 19).”
BackgroundDalrymple, N. A., Cimica, V., & Mackow, E. R. (2015) · mBio · doi:10.1128/mbio.00553-15 · Cited by 228
“MAVS activation of constitutively expressed TBK1, or its induced homologue IKK , directs IRF3/7 phosphorylation and transcription from ISRE and IFN- promoters (31, 32).”
BackgroundDanger signalling during cancer cell death: origins, plasticity and regulation
Garg, A. D., Martin, S., Gołąb, J., & Agostinis, P. (2013) · Cell Death and Differentiation · doi:10.1038/cdd.2013.48 · Cited by 232
Interferon regulatory factors: at the crossroads of immunity, metabolism, and disease
Zhao, G., Jiang, D.-S., & Li, H. (2014) · Biochimica et Biophysica Acta (BBA) - Molecular Basis of Disease · doi:10.1016/j.bbadis.2014.04.030 · Cited by 218
Dalmas, E., Toubal, A., Alzaid, F., Blazek, K., Eames, H. L., Lebozec, K., Pini, M., Hainault, I., Montastier, E., Denis, R. G. P., et al. (2015) · Nature Medicine · doi:10.1038/nm.3829 · Cited by 205
Fourati, S., Cristescu, R., Loboda, A., Talla, A., Filali, A., Railkar, R., Schaeffer, A. K., Favre, D., Gagnon, D., Peretz, Y., et al. (2016) · Nature Communications · doi:10.1038/ncomms10369 · Cited by 183
The Multiple Roles of Interferon Regulatory Factor family in Health and Disease
Wang, L., Zhu, Y., Zhang, N., Xian, Y., Tang, Y., Ye, J., Reza, F., He, G., Wen, X., & Jiang, X. (2024) · Signal Transduction and Targeted Therapy · doi:10.1038/s41392-024-01980-4 · Cited by 178
Errett, J. S., Suthar, M. S., McMillan, A., Diamond, M., & Gale, M. (2013) · Journal of Virology · doi:10.1128/jvi.01488-13 · Cited by 201
“The central role of MAVS-dependent signaling in controlling WNV infection and pathogenesis has been established and implicates an essential role for RLRs in immunity against WNV (12, 14, 29, 47).”
BackgroundResultSelf-citationRegulation of Mitochondrial Biogenesis and Its Intersection with Inflammatory Responses
Cherry, A. D., & Piantadosi, C. A. (2015) · Antioxidants and Redox Signaling · doi:10.1089/ars.2014.6200 · Cited by 192
Das, A., Kim, S. H., Arifuzzaman, S., Yoon, T., Chai, J. C., Lee, Y. S., Park, K. S., Jung, K. H., & Chai, Y. G. (2016) · Journal of Neuroinflammation · doi:10.1186/s12974-016-0644-1 · Cited by 183
“tors that contribute to IRGs [37, 50, 51].”
Intracellular Pathogen Detection by RIG-I-Like Receptors
Dixit, E., & Kagan, J. C. (2013) · Advances in immunology · doi:10.1016/b978-0-12-410524-9.00004-9 · Cited by 172
“Interestingly, in dendritic cells, IRF5 can also function to promote IFN-β expression (Lazear et al., 2013).”
BackgroundType I interferon signaling, regulation and gene stimulation in chronic virus infection
Lukhele, S., Boukhaled, G. M., & Brooks, D. G. (2019) · Seminars in Immunology · doi:10.1016/j.smim.2019.05.001 · Cited by 173
“It has also been suggested that IRF5 may utilize the MAVS adaptor to induce IFN-I responses in some subsets of dendritic cells (15).”
BackgroundTranscriptome analysis reveals strong and complex antiviral response in a mollusc
He, Y., Jouaux, A., Ford, S. E., Lelong, C., Sourdaine, P., Mathieu, M., & Guo, X. (2015) · Fish & Shellfish Immunology · doi:10.1016/j.fsi.2015.05.023 · Cited by 158
The unique role of STAT2 in constitutive and IFN-induced transcription and antiviral responses
Błaszczyk, K., Nowicka, H., Kostyrko, K., Antonczyk, A., Wesoły, J., & Bluyssen, H. A. R. (2016) · Cytokine & Growth Factor Reviews · doi:10.1016/j.cytogfr.2016.02.010 · Cited by 157
Viral recognition and the antiviral interferon response
Dalskov, L., Gad, H. H., & Hartmann, R. (2023) · The EMBO Journal · doi:10.15252/embj.2022112907 · Cited by 139
Mapping the crossroads of immune activation and cellular stress response pathways
Cláudio, N., Dalet, A., Gatti, E., & Pierre, P. (2013) · The EMBO Journal · doi:10.1038/emboj.2013.80 · Cited by 134
“…in DCs by West Nile virus infection suggests that GADD34 represents a key signature gene associated to the triggering of RLRs and of mitochondria-associated adapter molecule (MAVS, also called IPS-1, VISA or CARDIF), and could depend on IRF5 translocation for its expression (Lazear et al , 2013).”
STING-associated lung disease in mice relies on T cells but not type I interferon
Luksch, H., Stinson, W. A., Platt, D. J., Qian, W., Kalugotla, G., Miner, C. A., Bennion, B. G., Gerbaulet, A., Rösen‐Wolff, A., & Miner, J. J. (2019) · Journal of Allergy and Clinical Immunology · doi:10.1016/j.jaci.2019.01.044 · Cited by 131
Feng, H., Zhang, Y.-B., Zhang, Q.-M., Li, Z., Zhang, Q.-Y., & Gui, J. (2014) · The Journal of Immunology · doi:10.4049/jimmunol.1402415 · Cited by 123
Mladinich, M. C., Schwedes, J. F., & Mackow, E. R. (2017) · mBio · doi:10.1128/mbio.00952-17 · Cited by 123
“IRF7 and IRF9 1 to 9 dpi (Table 1) (64), as IRF9 reportedly induces ISGs, including ISG15, without IFN and IFNAR-directed STAT1/2 phosphorylation (50).”
BackgroundBarrett, J. P., Henry, R. J., Shirey, K. A., Doran, S. J., Makarevich, O. D., Ritzel, R. M., Meadows, V. A., Vogel, S. N., Faden, A. I., Stoica, B. A., et al. (2020) · Journal of Neuroscience · doi:10.1523/jneurosci.2516-19.2020 · Cited by 129
“We also evaluated interferon regulatory factors (IRFs), transcription factors that induce type I IFNs (IRF3, IRF7) and propagate type I IFN responses (IRF1, IRF4, and IRF5; Honda et al., 2006; Günthner and Anders, 2013; Lazear et al., 2013).”
MethodPropagation, Quantification, Detection, and Storage of West Nile Virus
Brien, J. D., Lazear, H. M., & Diamond, M. (2013) · Current Protocols in Microbiology · doi:10.1002/9780471729259.mc15d03s31 · Cited by 120
“…strain, is endemic in North America, Europe, the Middle East, and Africa and has been responsible for most outbreaks of human disease (Tsai et al., 1998; Han et al., 1999; Hubalek and Halouzka, 1999; Jia et al., 1999; Lanciotti et al., 1999; Hayes, 2001; Briese et al., 2002; May et al., 2011).”
BackgroundMethodSelf-citationELF4 is critical for induction of type I interferon and the host antiviral response
You, F., Wang, P., Yang, L., Yang, G., Zhao, Y. O., Qian, F., Walker, W. E., Sutton, R. E., Montgomery, R. R., Lin, R., et al. (2013) · Nature Immunology · doi:10.1038/ni.2756 · Cited by 122
Advances in understanding the role of type I interferons in systemic lupus erythematosus
Crow, M. K. (2014) · Current Opinion in Rheumatology · doi:10.1097/bor.0000000000000087 · Cited by 117
“New information is also suggesting that IRF5 is involved in IFN-induced gene transcription mediated by the TLR-independent pathway in some cell types [38].”
BackgroundHuang, Y., Huang, X., Cai, J. X., Ouyang, Z., Wei, S., Wei, J., & Qin, Q. (2014) · Fish & Shellfish Immunology · doi:10.1016/j.fsi.2014.11.025 · Cited by 116
Tang, Q., Rigby, R. E., Young, G. R., Hvidt, A. K., Davis, T., Tan, T. K., Bridgeman, A., Townsend, A., Kassiotis, G., & Rehwinkel, J. (2021) · Immunity · doi:10.1016/j.immuni.2021.08.011 · Cited by 118
Wilson, J. A. C., Prow, N. A., Schroder, W. A., Ellis, J. J., Cumming, H. E., Gearing, L. J., Poo, Y. S., Taylor, A., Hertzog, P. J., Giallonardo, F. D., et al. (2017) · PLoS Pathogens · doi:10.1371/journal.ppat.1006155 · Cited by 116
“The direct upstream regulator function of IPA identified IRF7, STAT1, IRF3, IRF1 and IRF5 [80] in the top 10 upstream regulators for each time PLOS Pathogens | DOI:10.1371/journal.ppat.1006155 February 16, 2017 10 / 32 point (ranked by activation Z scores), with these transcription factors also showing (i) high fold c…”
BackgroundInfluentialWong, M.-T., & Chen, S. S.-L. (2014) · Cellular and Molecular Immunology · doi:10.1038/cmi.2014.127 · Cited by 121
“137 Thus, IRF7-mediated transcriptional cascades serve as an intrinsic antiviral mechanism allowing rapid ISG expression before IFN production.”
BackgroundTse, S., McKinney, K. M., Walker, W., Nguyen, M., Iacovelli, J., Small, C. G., Hopson, K., Zaks, T. Z., & Huang, E. (2021) · Molecular Therapy · doi:10.1016/j.ymthe.2021.03.002 · Cited by 114
“(MAVS) is an adaptor for PRRs that senses double-stranded RNA, which also activates type I IFNs through transcription factors IRF3, IRF7, andNF-kB.(23) Adjuvants that could induce cell-mediated immunity via PRRs could be beneficial for designing T cell vaccines.”
BackgroundReynaud, J. M., Kim, D., Atasheva, S., Aliaksandra, R., White, J. P., Diamond, M., Weaver, S. C., Frolova, E. I., & Frolov, I. V. (2015) · PLoS Pathogens · doi:10.1371/journal.ppat.1004863 · Cited by 114
“Wild type, IFIT1, IFIT2 and IFIT-locus murine embryonic fibroblasts (MEFs) were generated and maintained according to published protocols [61] in DMEM supplemented with 10% FBS.”
MethodSelf-citationThe Molecular Basis of Viral Inhibition of IRF- and STAT-Dependent Immune Responses
Chiang, H.-S., & Liu, H. M. (2019) · Frontiers in Immunology · doi:10.3389/fimmu.2018.03086 · Cited by 108
MAVS-dependent host species range and pathogenicity of human hepatitis A virus
Hirai-Yuki, A., Hensley, L., McGivern, D. R., González‐López, O., Das, A., Feng, H., Sun, L., Wilson, J. E., Hu, F., Feng, Z., et al. (2016) · Science · doi:10.1126/science.aaf8325 · Cited by 104
Age-related mitochondrial dysfunction as a key factor in COVID-19 disease
Fernández‐Ayala, D. J. M., Navas, P., & López‐Lluch, G. (2020) · Experimental Gerontology · doi:10.1016/j.exger.2020.111147 · Cited by 110
Han, Y. W., Choi, J., Uyangaa, E., Kim, S. B., Kim, J. H., Kim, B. S., Kim, K., & Eo, S. K. (2014) · PLoS Pathogens · doi:10.1371/journal.ppat.1004319 · Cited by 104
“This result was consistent with the fact that TLR3 BMDC showed slightly higher or identical secretion of IFN-b compared to wild-type BMDC (Figure 7F), because IFN-independent ISG genes can also be induced through ISRE binding of ISGF3 complex initiated by type I IFN receptor [15].”
IKKβ is an IRF5 kinase that instigates inflammation
Ren, J., Chen, X., & Chen, Z. J. (2014) · Proceedings of the National Academy of Sciences · doi:10.1073/pnas.1418516111 · Cited by 104
“IRF5 also functions together with IRF3 and IRF7 to mediate type I IFN production in response to viral infections (11).”
BackgroundJohn, S. P., Sun, J., Carlson, R. J., Cao, B., Bradfield, C. J., Song, J., Smelkinson, M. G., & Fraser, I. D. C. (2018) · Cell Reports · doi:10.1016/j.celrep.2018.09.002 · Cited by 103
“It has been shown that type I IFN gene induction involves an initial phase dependent on IRF3 recruitment and a secondary phase that is supported by IRF7 and IRF8 activity (Ikushima et al., 2013; Honda et al., 2004; Kawai et al., 2004; Lazear et al., 2013; Li et al., 2011).”
BackgroundInnate Immune Signaling and Its Role in Metabolic and Cardiovascular Diseases
Xu, M. M., Liu, P. P., & Li, H. (2018) · Physiological Reviews · doi:10.1152/physrev.00065.2017 · Cited by 100
Mitochondrial Dysfunction and the Aging Immune System
McGuire, P. J. (2019) · Biology · doi:10.3390/biology8020026 · Cited by 103
“Downstream of MAVS, IRF3, IRF5 and IRF7 bind to their cognate promoters, leading to the production of type I interferons [36].”
Integrating the Hallmarks of Aging Throughout the Tree of Life: A Focus on Mitochondrial Dysfunction
van der Rijt, S., Molenaars, M., McIntyre, R. L., Janssens, G. E., & Houtkooper, R. H. (2020) · Frontiers in Cell and Developmental Biology · doi:10.3389/fcell.2020.594416 · Cited by 102
Bai, F., Thompson, E. A., Vig, P. J. S., & Leis, A. A. (2019) · Pathogens · doi:10.3390/pathogens8040193 · Cited by 98
“Recent studies showed that IL-1 β , IFN regulatory factors (IRF) 3, 5 and 7 are important to induce DC-mediated antivirus IFN responses against WNV infection [71–73].”
The role of type I interferons in intestinal infection, homeostasis, and inflammation
Cho, H., & Kelsall, B. L. (2014) · Immunological Reviews · doi:10.1111/imr.12195 · Cited by 94
“Moreover, IFNAR KO mice orally infected with MNV-1 succumb to the viral infection very rapidly, indicating that the IFN-I signaling is essential for controlling the norovirus infection in vivo (93).”
BackgroundFeng, H., Lenarcic, E. M., Yamane, D., Wauthier, E., Mo, J., Guo, H., McGivern, D. R., González‐López, O., Misumi, I., Reid, L. M., et al. (2017) · Nature Immunology · doi:10.1038/ni.3853 · Cited by 93
Proença‐Módena, J. L., Sesti‐Costa, R., Pinto, A. K., Richner, J. M., Lazear, H. M., Lucas, T. M., Hyde, J., & Diamond, M. (2015) · Journal of Virology · doi:10.1128/jvi.00077-15 · Cited by 87
Self-citationAcute Infection of Viral Pathogens and Their Innate Immune Escape
Rai, K. R., Shrestha, P., Yang, B., Chen, Y., Liu, S., Maarouf, M., & Chen, J. (2021) · Frontiers in Microbiology · doi:10.3389/fmicb.2021.672026 · Cited by 87
“The PRR-mediated signaling pathways ultimately lead to the secretion of numerous antiviral molecules, including type I and type III IFNs, and other pro-inflammatory cytokines and chemokines (Koyama et al., 2008; Ishikawa et al., 2009; Kawai and Akira, 2010; Rathinam and Fitzgerald, 2011; Jensen and Thomsen, 2012; Goub…”
BackgroundInfluentialHost Competence: An Organismal Trait to Integrate Immunology and Epidemiology
Martin, L. B., Burgan, S. C., Adelman, J. S., & Gervasi, S. S. (2016) · Integrative and Comparative Biology · doi:10.1093/icb/icw064 · Cited by 83
Traumatic Brain Injury Induces cGAS Activation and Type I Interferon Signaling in Aged Mice
Barrett, J. P., Knoblach, S. M., Bhattacharya, S., Gordish‐Dressman, H., Stoica, B. A., & Loane, D. J. (2021) · Frontiers in Immunology · doi:10.3389/fimmu.2021.710608 · Cited by 90
Innate immune escape by Dengue and West Nile viruses
Gack, M. U., & Diamond, M. (2016) · Current Opinion in Virology · doi:10.1016/j.coviro.2016.09.013 · Cited by 83
Self-citationFeng, H., Zhang, Q.-M., Zhang, Y.-B., Li, Z., Zhang, J., Xiong, Y.-W., Wu, M., & Gui, J. (2016) · The Journal of Immunology · doi:10.4049/jimmunol.1600159 · Cited by 79
“IRF3, IRF5, and IRF7 coordinately act in myeloid DCs downstream of mitochondrial antiviral signaling protein signaling (20).”
BackgroundRevisiting IRF1-mediated antiviral innate immunity
Zhou, H., Tang, Y., & Zheng, C. (2022) · Cytokine & Growth Factor Reviews · doi:10.1016/j.cytogfr.2022.01.004 · Cited by 83
A Role for Ifit2 in Restricting West Nile Virus Infection in the Brain
Cho, H., Shrestha, B., Sen, G. C., & Diamond, M. (2013) · Journal of Virology · doi:10.1128/jvi.01097-13 · Cited by 82
“cells by plaque or focus-forming assay as described previously (27, 28).”
MethodSelf-citationThe Roles of IRF-3 and IRF-7 in Innate Antiviral Immunity against Dengue Virus
Chen, H., King, K., Tu, J., Sanchez, M., Luster, A. D., & Shresta, S. (2013) · The Journal of Immunology · doi:10.4049/jimmunol.1300799 · Cited by 81
“Based on the most recent publication reporting that the MAVS-dependent induction of ISGs in WNVinfected mDCs can occur through an IRF-5–dependent pathway in the absence of IRF-3 and IRF-7 (25), IRF-5 is a likely candidate for the IRF-3– and IRF-7–independent signaling against DENV.”
BackgroundRsad2 is necessary for mouse dendritic cell maturation via the IRF7-mediated signaling pathway
Jang, J.-S., Lee, J., Jung, N.-C., Choi, S.-Y., Park, S.-Y., Yoo, J. Y., Song, J., Seo, H. G., Lee, H. S., & Lim, D. (2018) · Cell Death and Disease · doi:10.1038/s41419-018-0889-y · Cited by 82
At the crossway of ER‐stress and proinflammatory responses
Reverendo, M., Mendes, A., Argüello, R., Gatti, E., & Pierre, P. (2019) · The FEBS Journal · doi:10.1111/febs.14391 · Cited by 72
Protein synthesis inhibition and GADD34 control IFN‐β heterogeneous expression in response to dsRNA
Dalet, A., Argüello, R. J., Combes, A. J., Spinelli, L., Jaeger, S., Fallet, M., Manh, T. V., Mendes, A. V., Perego, J., Reverendo, M., et al. (2017) · The EMBO Journal · doi:10.15252/embj.201695000 · Cited by 77
DNA-binding landscape of IRF3, IRF5 and IRF7 dimers: implications for dimer-specific gene regulation
Andrilenas, K. K., Ramlall, V., Kurland, J. V., Leung, B., Harbaugh, A. G., & Siggers, T. (2018) · Nucleic Acids Research · doi:10.1093/nar/gky002 · Cited by 77
Intestinal Dysmotility Syndromes following Systemic Infection by Flaviviruses
White, J. P., Xiong, S., Malvin, N. P., Khoury-Hanold, W., Heuckeroth, R. O., Stappenbeck, T. S., & Diamond, M. (2018) · Cell · doi:10.1016/j.cell.2018.08.069 · Cited by 75
Self-citationHERC5 and the ISGylation Pathway: Critical Modulators of the Antiviral Immune Response
Mathieu, N. A., Paparisto, E., Barr, S. D., & Spratt, D. E. (2021) · Viruses · doi:10.3390/v13061102 · Cited by 84
Carlin, A. F., Plummer, E. M., Vizcarra, E. A., Sheets, N., Joo, Y., Tang, W. W., Day, J., Greenbaum, J., Glass, C. K., Diamond, M., et al. (2017) · Cell Reports · doi:10.1016/j.celrep.2017.10.054 · Cited by 77
“IRF-1, IRF-3, IRF-5, and IRF-7 contribute to the suppression of viruses, oftentimes in a cell-type- and viral-specific manner (Brien et al., 2011; Chen et al., 2013; Lazear et al., 2013).”
BackgroundMethodSelf-citationInterfering with immunity: detrimental role of type I IFNs during infection
Stifter, S. A., & Feng, C. G. (2015) · The Journal of Immunology · doi:10.4049/jimmunol.1402794 · Cited by 78
Molecular mechanisms controlling age‐associated B cells in autoimmunity*
Phalke, S., Rivera‐Correa, J., Jenkins, D., Flores-Castro, D., Γιαννοπούλου, Ε., & Pernis, A. B. (2022) · Immunological Reviews · doi:10.1111/imr.13068 · Cited by 79
Ding, S., Zhu, S., Ren, L., Feng, N., Song, Y., Ge, X., Li, B., Flavell, R. A., & Greenberg, H. B. (2018) · eLife · doi:10.7554/elife.39494 · Cited by 72
Rasa, S. M. M., Annunziata, F., Křepelová, A., Nunna, S., Omrani, O., Gebert, N., Adam, L., Käppel, S., Hoehn, S., Donati, G., et al. (2022) · Cell Reports · doi:10.1016/j.celrep.2022.111017 · Cited by 72
Webster, B., Werneke, S. W., Zafirova, B., This, S., Coléon, S., Décembre, É., Païdassi, H., Bouvier, I., Joubert, P.-E., Duffy, D., et al. (2018) · eLife · doi:10.7554/elife.34273 · Cited by 73
“…the persistence of IFN-I-mediated viral control under these conditions depends on IRF5 or IRF1 signaling ( Carlin et al., 2017 ; Chen et al., 2013 ; Lazear et al., 2013 ; Rudd et al., 2012 ), as control of flaviviral infections is still contingent on IFNAR signaling in the absence of Irf3/Irf7…”
Lucas, T. M., Richner, J. M., & Diamond, M. S. (2015) · Journal of Virology · doi:10.1128/jvi.02463-15 · Cited by 77
Self-citationSun, J., Ye, F., Wu, A., Yang, R., Pan, M., Sheng, J., Zhu, W., Mao, L., Wang, M., Xia, Z., et al. (2020) · Frontiers in Microbiology · doi:10.3389/fmicb.2020.593857 · Cited by 67
“Among the four regulator genes, IRF7 is responsible for the expression of most IFN-α subtypes and the type I IFN amplification loop (Lazear et al., 2013), and IRF9, STAT1, and STAT2 form the ISGF3 complex that binds to interferonstimulated response elements and thereby induces the expression of interferon-stimulated g…”
BackgroundDeficient IFN Signaling by Myeloid Cells Leads to MAVS-Dependent Virus-Induced Sepsis
Pinto, A. K., Ramos, H. J., Wu, X., Aggarwal, S., Shrestha, B., Gorman, M. J., Kim, K. Y., Suthar, M. S., Atkinson, J. P., Gale, M., et al. (2014) · PLoS Pathogens · doi:10.1371/journal.ppat.1004086 · Cited by 67
“A similar phenomenon was observed ex vivo after WNV infection of Ifnar BMDCs, in which a maximum of 10 to 20% of cells was infected even at high multiplicities of infection [35].”
BackgroundSelf-citationRubinow, K. B., Wall, V., Nelson, J. D., Mar, D., Bomsztyk, K., Askari, B., Lai, M. A., Smith, K. D., Han, M. S., Vivekanandan‐Giri, A., et al. (2013) · Journal of Biological Chemistry · doi:10.1074/jbc.m113.458372 · Cited by 67
“For example, macrophages deficient in IRF3, IRF5, and IRF7 are still able to produce IFN- following viral infection (48).”
BackgroundGrowing tumors induce a local STING dependent Type I IFN response in dendritic cells
Andzinski, L., Spanier, J., Kasnitz, N., Kröger, A., Jin, L., Brinkmann, M. M., Kalinke, U., Weiß, S., Jabłońska, J., & Lienenklaus, S. (2016) · International Journal of Cancer · doi:10.1002/ijc.30159 · Cited by 67
“They had been shown to depend on IRF5 for induction of Type I IFN after viral infections.(14) From the receptors responsible for induction of Type I IFN under our conditions, we excluded TLRs and we found a minor contribution of RLRs.”
BackgroundSiegfried, A., Berchtold, S., Manncke, B., Deuschle, E., Reber, J., Ott, T., Weber, M., Kalinke, U., Hofer, M. J., Hatesuer, B., et al. (2013) · The Journal of Immunology · doi:10.4049/jimmunol.1203305 · Cited by 70
“Transfection experiments showed that IFIT3 bridges MAVSwith TBK1 and thus (40) upregulates IRF3 phosphorylation and subsequently IFN-b expression.”
BackgroundZBTB24 is a transcriptional regulator that coordinates with DNMT3B to control DNA methylation
Thompson, J. J., Kaur, R., Sosa, C. P., Lee, J., Kashiwagi, K., Zhou, D., & Robertson, K. D. (2018) · Nucleic Acids Research · doi:10.1093/nar/gky682 · Cited by 67
“IPA analysis predicts that the transcription factors IRF3/IRF5/IRF7, which share overlapping and distinct functions in regulating the type I interferon response (50,51), are targeted for activation in the absence of ZBTB24, while TRIM24, a cofactor coordinating with hormone receptors to drive proliferation (52) and ne…”
BackgroundNon-structural proteins of bovine viral diarrhea virus
Chi, S., Chen, S. E., Jia, W., He, Y., Ren, L., & Wang, X. (2022) · Virus Genes · doi:10.1007/s11262-022-01914-8 · Cited by 64
Protective and Pathogenic Effects of Interferon Signaling During Pregnancy
Casazza, R. L., Lazear, H. M., & Miner, J. J. (2019) · Viral Immunology · doi:10.1089/vim.2019.0076 · Cited by 60
“Uncontrolled viral replication and dysregulated cytokine signaling in Ifnar1 mice result in high serum concentrations of type I IFN (60,86), which could contribute to severe infection-induced pathology in Ifnar1 fetuses within Ifnar1 dams.”
Self-citationInterleukin-1β Signaling in Dendritic Cells Induces Antiviral Interferon Responses
Aarreberg, L. D., Wilkins, C. R., Ramos, H. J., Green, R. R., Davis, M. A., Chow, K. T., & Gale, M. (2018) · mBio · doi:10.1128/mbio.00342-18 · Cited by 64
Self-citationO’Neal, J. T., Upadhyay, A. A., Wolabaugh, A. N., Patel, N. B., Bosinger, S. E., & Suthar, M. S. (2019) · Journal of Virology · doi:10.1128/jvi.01778-18 · Cited by 57
“Pattern recognition 75 receptors, including toll-like receptors (TLRs) and retinoic acid-inducible gene I (RIG-I)76 like receptors (RLRs), detect broad viral signatures, such as 5’-triphosphate ssRNA or 77 dsRNA, in the cytosolic and endosomal compartments (9, 11, 12, 14).”
BackgroundSelf-citationLazear, H. M., Pinto, A. K., Ramos, H. J., Vick, S. C., Shrestha, B., Suthar, M. S., Gale, M., & Diamond, M. (2013) · Journal of Virology · doi:10.1128/jvi.01403-13 · Cited by 61
Self-citationHatesuer, B., Hoang, H. T. T., Riese, P., Trittel, S., Gerhauser, I., Elbahesh, H., Geffers, R., Wilk, E., & Schughart, K. (2016) · Journal of Innate Immunity · doi:10.1159/000450705 · Cited by 61
Proença‐Módena, J. L., Hyde, J., Sesti‐Costa, R., Lucas, T. M., Pinto, A. K., Richner, J. M., Gorman, M. J., Lazear, H. M., & Diamond, M. (2015) · Journal of Virology · doi:10.1128/jvi.02276-15 · Cited by 58
“After MAVS signaling, IRF-5 acts coordinately with IRF-3 and IRF-7 to regulate type I IFN responses in myeloid DCs after West Nile virus (WNV) infection (18).”
BackgroundSelf-citationRodriguez, M. R., Monte, K. J., Thackray, L. B., & Lenschow, D. J. (2014) · Journal of Virology · doi:10.1128/jvi.01422-14 · Cited by 58
“(C) WT (W), ISG15 / (15), and UbE1L / (U) BMDC were either left untreated or pre- and posttreated with 1,000 U/ml of IFN- 4 prior to infection with MNV-1 at an MOI of 0.”
MethodSelf-citationTemporal control of the integrated stress response by a stochastic molecular switch
Klein, P., Kallenberger, S. M., Roth, H., Roth, K., Ly-Hartig, T. B. N., Magg, V., Aleš, J., Talemi, S. R., Qiang, Y., Wolf, S., et al. (2022) · Science Advances · doi:10.1126/sciadv.abk2022 · Cited by 50
“factor (IRF) 3 and IRF7, downstream of the RNA sensing innate immune pathway (38, 39).”
Hannibal, T. D., Schmidt-Christensen, A., Nilsson, J., Fransén-Pettersson, N., Hansen, L., & Holmberg, D. (2017) · Diabetologia · doi:10.1007/s00125-017-4341-0 · Cited by 60
“and macrophages from IRF-7 knockout mice were still able to produce normal levels of IFN-β [18].”
BackgroundSUMO2 and SUMO3 redundantly prevent a noncanonical type I interferon response
Crowl, J. T., & Stetson, D. B. (2018) · Proceedings of the National Academy of Sciences · doi:10.1073/pnas.1802114115 · Cited by 56
“Alternatively, IRF5 has been shown to be important for IFN response to some RNA viruses (25).”
BackgroundThe brain parenchyma has a type I interferon response that can limit virus spread
Drokhlyansky, E., Aytürk, D. G., Soh, T. K., Chrenek, R., O'Loughlin, E. K., Madore, C., Butovsky, O., & Cepko, C. L. (2016) · Proceedings of the National Academy of Sciences · doi:10.1073/pnas.1618157114 · Cited by 55
“To further investigate the induction of the type I IFN response, the expression of several known ISGs—Rsad2, Cxcl10, and Oas1α—was assayed (43).”
MethodFormulation, inflammation, and RNA sensing impact the immunogenicity of self-amplifying RNA vaccines
Tregoning, J. S., Stirling, D. C., Wang, Z., Flight, K. E., Brown, J. C., Blakney, A. K., McKay, P. F., Cunliffe, R. F., Murugaiah, V., Fox, C. B., et al. (2022) · Molecular Therapy — Nucleic Acids · doi:10.1016/j.omtn.2022.11.024 · Cited by 57
“It was of interest that there was significantly more IFN-b in the blood of Ifnar1 / than control mice; this may reflect increased replication of the saRNA construct or a failure to regulate the IFN response, where a similar increase in sera IFN has been seen in West Nile virus infection.(27) Whether differences seen b…”
ResultKim, T. H., & Zhou, H. (2015) · PLoS ONE · doi:10.1371/journal.pone.0133450 · Cited by 55
Metadata
- Authors
- Lazear, H. M., Lancaster, A., Wilkins, C., Suthar, M. S., Huang, A., Vick, S. C., Clepper, L., Thackray, L., Brassil, M. M., Virgin, H. W., Nikolich-Zugich, J., Moses, A. V., Gale, M., Früh, K., & Diamond, M. S.
- Affiliations
- Washington University in St. Louis (US)
- Oregon Health & Science University (US)
- University of Washington (US)
- Emory University (US)
- Vaccine and Gene Therapy Institute (US)
- Corresponding author
- Diamond, Michael S.
- ORCID
- Venue
- PLoS Pathogens
- Publisher
- Public Library of Science (PLoS)
- Published
- 2013-01-03
- Volume
- 9
- Issue
- 1
- Pages
- e1003118
- ISSN
- 1553-7366 (ISSN-L)
- 1553-7374
- PMC
- PMC3536698
- OpenAlex
- W2036679352
- Cited by
- 296
- References
- 85
- Citations by year
- 2026: 7 · 2025: 11 · 2024: 12 · 2023: 11 · 2022: 21 · 2021: 25 · 2020: 27 · 2019: 22 · 2018: 30 · 2017: 25 · 2016: 28 · 2015: 20 · 2014: 33 · 2013: 23
- FWCI
- 19.19
- Type
- journal article
- Language
- en
- Update notices
- correction (2013-05-03)
- Open access
- gold
- doi.org
- Locations
- PLoS Pathogens (publishedVersion, cc-by)
- PubMed Central (publishedVersion, cc-by)
- PubMed (publishedVersion)
- Digital Commons@Becker (Washington University School of Medicine) (submittedVersion)
- Carolina Digital Repository (University of North Carolina at Chapel Hill) (submittedVersion)
- DOAJ (DOAJ: Directory of Open Access Journals) (submittedVersion, cc-by-sa)
- Figshare (submittedVersion, cc-by)
- UNC Libraries
- Funders
- National Institutes of Health (n01ai50027-8-0-1, AI083019, AI057160)
- National Institute of Allergy and Infectious Diseases (N01 AI50027, U19AI083019, U54AI081680, N01 AI050027, R01AI074973, U54AI057160)
- Topics
- Life Sciences › Immunology and Microbiology › Immunology › interferon and immune responses
- Life Sciences › Immunology and Microbiology › Immunology › Immune Response and Inflammation
- Life Sciences › Immunology and Microbiology › Immunology › Immunotherapy and Immune Responses
- Keywords
- IRF3, IRF5, IRF7, type I interferon, myeloid dendritic cells, MAVS, interferon-stimulated genes, West Nile virus, murine norovirus, positive-strand RNA viruses, interferon-beta, Toll-like receptor signaling, RIG-I-like receptor signaling, transcription factors, macrophages, viral pathogenesis
- MeSH terms
- Animals, Dendritic Cells, Macrophages, Mice, Inbred C57BL, West Nile Fever, West Nile virus, Signal Transduction, Interferon-beta, Mice, Knockout, Viral Load, Myeloid Cells, Adaptor Proteins, Signal Transducing, Interferon Regulatory Factors, Interferon Regulatory Factor-3, Interferon Regulatory Factor-7, Toll-Like Receptors, Mice, Receptor, Interferon alpha-beta
About these checks
Registry, retraction, Cites and statistics results are computed, not judged, with one exception: a printed reference that no index lists is read once by a model before it counts as a citation error. Claims are extracted by a model and kept only when their quote appears verbatim in the text; each cited source is then checked, with a model’s help, for whether it says what the claim relies on. Those verdicts can be wrong — read the claim’s quote and the cited source before relying on one.
Statistics and arithmetic are recomputed, not judged.
Confidence bands are shown only for fields calibrated on our annotated test set. None is calibrated yet, so no band is shown.
What counts as a claim ›How we measure confidence ›How we check this ›
Are you an author, or do you see a problem with this page? Request a review
