

The DOI matches its Crossref record; 5 of the 5 references it cites were found in a registry or an index.
Impaired Neuronal Positioning and Dendritogenesis in the Neocortex after Cell-Autonomous Dab1 Suppression
Abstract
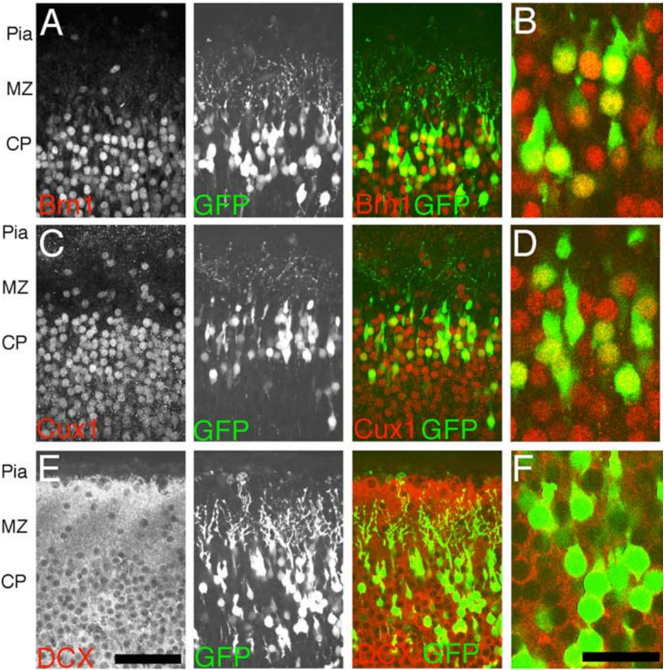
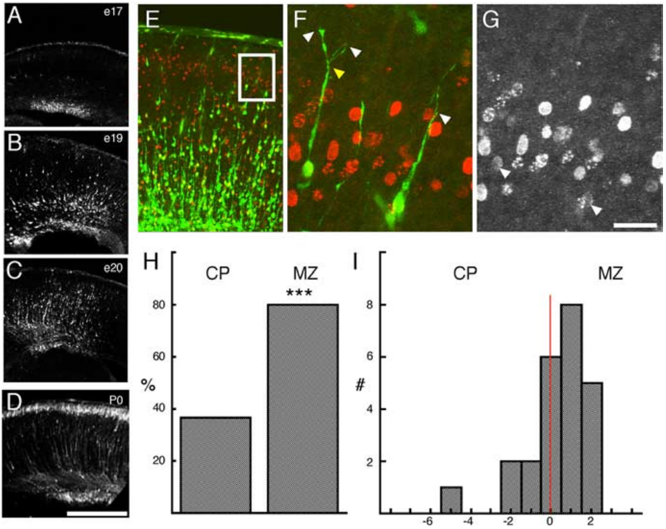
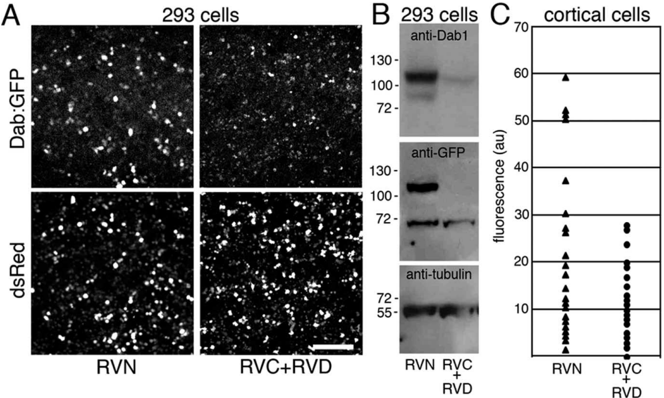
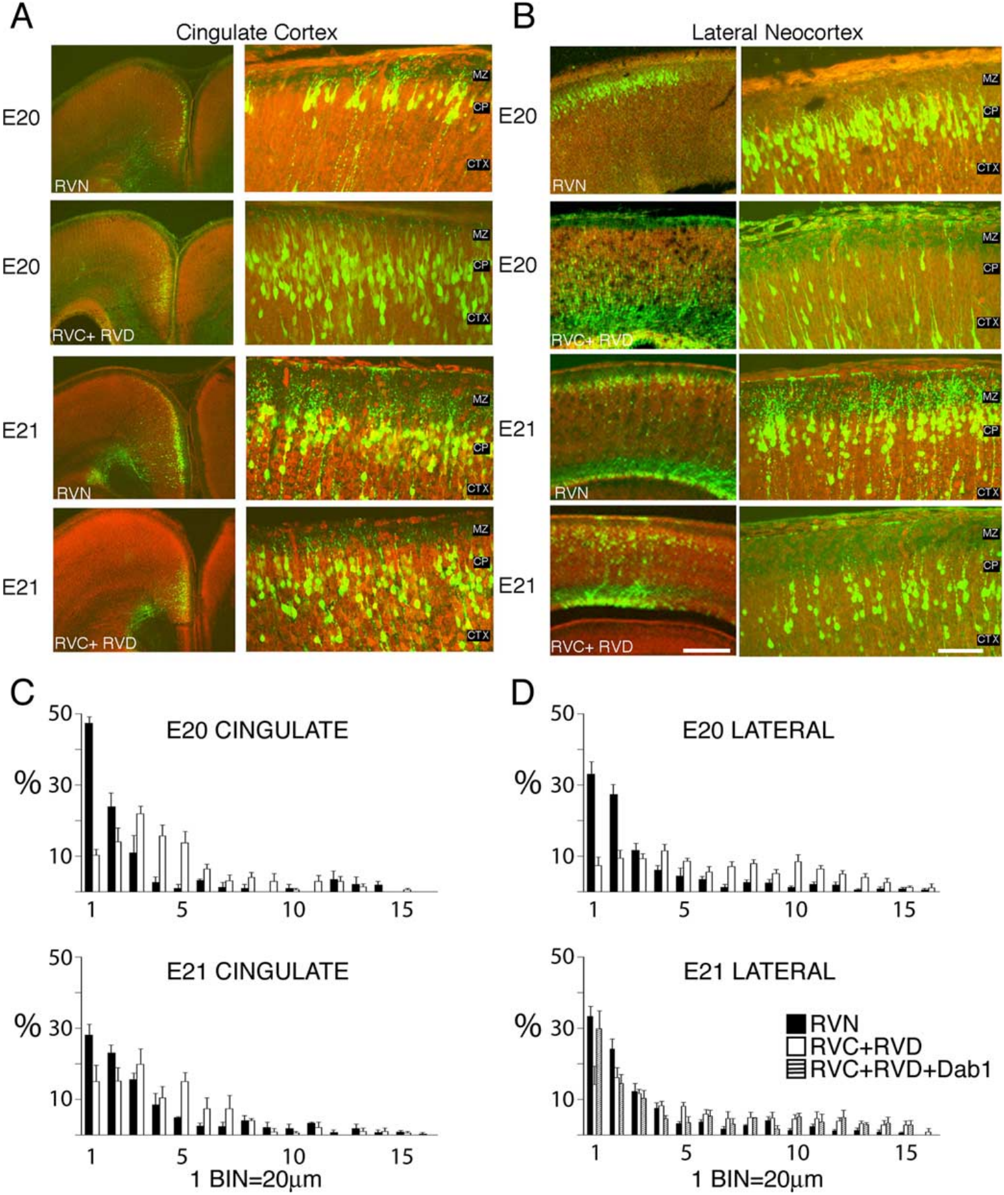
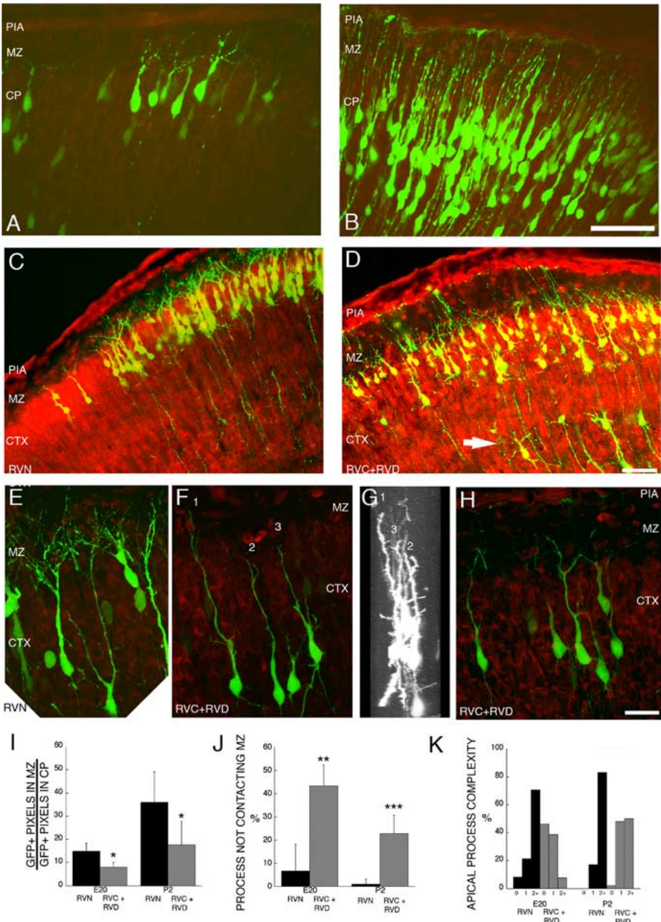
Reelin and Disabled 1 (Dab1) are essential for positioning migrating neurons in the developing neocortex. Cell-autonomous RNA interference-mediated suppression of Dab1 in migrating neurons destined for layer 2/3 shifted the median position of these cells to deeper positions within the cortex. At the time of migration arrest [embryonic day 20 (E20) to E21], Dab1-suppressed cells were underrepresented in the upper ∼40 μm of the cortex compared with controls, suggesting that Dab1 is essential for somal translocation through the cell-dense cortical plate. Closer examination of the morphology of Dab1-suppressed neurons at E20 revealed simplified leading processes that are less likely to contact the marginal zone (MZ), in which high levels of Reelin are expressed. Examination of Dab1-suppressed cells 3 d later (postnatal day 2) revealed simplified dendrites that are also less likely to contact the MZ. These data reveal a cell-autonomous role of Dab1 in dendritogenesis in the neocortex and suggest that remodeling of the leading process of a migrating neuron into a nascent dendrite by Reelin/Dab1 signaling plays an important role in cell positioning.
Overview
The claims and statistics of this paper haven’t been checked yet.
Run the check — free, no account needed. It reads the open-access text and checks the sources it cites.
Integrity signals
Registry
Cites
Statistics
Figures
Verification
Claims the paper makes
The claims and statistics of this paper haven’t been checked yet.
Run the check — free, no account needed. It reads the open-access text and checks the sources it cites.
Claims other papers make about this one
Each is checked against this paper’s own text: does it say what the citing paper says it does?
In the citing paper
“It has already been demonstrated that the Dab1 protein is important in regulating the positioning of migrating neurons during mammalian neurogenesis [29-31].”
From Dynamic expression of Dab2 in the mouse embryonic central nervous system (2008) · cites this paper as [31]
Self-check
Percentages, sums and reported differences re-computed from the paper’s own numbers.
The self-check needs the paper’s full text.
Citations
Cites
A protein related to extracellular matrix proteins deleted in the mouse mutant reeler
D'Arcangelo, G., G. Miao, G., Chen, S.-C., Scares, H. D., Morgan, J. I., & Curran, T. (1995) · Nature · doi:10.1038/374719a0 · Cited by 1,748
Hiesberger, T., Trommsdorff, M., Howell, B. W., Goffinet, A., Mumby, M. C., Cooper, J. A., & Herz, J. (1999) · Neuron · doi:10.1016/s0896-6273(00)80861-2 · Cited by 916
Scrambler and yotari disrupt the disabled gene and produce a reeler -like phenotype in mice
Sheldon, M., Rice, D. S., D'Arcangelo, G., Yoneshima, H., Nakajima, K., Mikoshiba, K., Howell, B. W., Cooper, J. A., Goldowitz, D., & Curran, T. (1997) · Nature · doi:10.1038/39601 · Cited by 638
Falconer, D. S. (1951) · Journal of Genetics · doi:10.1007/bf02996215 · Cited by 539
Caviness, V. S., & Sidman, R. L. (1973) · Journal of Comparative Neurology · doi:10.1002/cne.901480202 · Cited by 413
Research works printed but not linked: 40
- (2001), J Neurophysiol, 86, 1037, 10.1152/jn.2001.86.2.1037 · DOI
- 10.1016/S0896-6273(00)80860-0 · DOI · Paper page
- 10.1002/cne.1375 · DOI
- 10.1016/S0896-6273(00)00007-6 · DOI · Paper page
- 10.1016/S0896-6273(00)80778-3 · DOI
- 10.1007/BF00304978 · DOI
- (1984), Brain Res, 318, 263
- 10.1523/JNEUROSCI.17-23-09204.1997 · DOI
- 10.1523/JNEUROSCI.21-22-08798.2001 · DOI
- 10.1242/dev.00654 · DOI · Paper page
- 10.1523/JNEUROSCI.05-12-03310.1985 · DOI
- 10.1038/79246 · DOI
- 10.1093/emboj/16.1.121 · DOI · Paper page
- 10.1038/39607 · DOI · Paper page
- 10.1101/gad.13.6.643 · DOI · Paper page
- 10.1002/(SICI)1097-4695(199710)33:4<459::AID-NEU9>3.0.CO;2-9 · DOI
- 10.1016/S0165-3806(02)00604-1 · DOI
- 10.1016/S0896-6273(02)00582-2 · DOI
- 10.1007/BF00315920 · DOI
- 10.1002/cne.902990107 · DOI
- 10.1073/pnas.2235688100 · DOI
- 10.1126/science.1067132 · DOI
- 10.1016/0165-3806(88)90121-6 · DOI
- 10.1038/83967 · DOI
- 10.1038/ng0492-50 · DOI
- 10.1002/cne.20322 · DOI
- 10.1016/S0896-6273(03)00819-5 · DOI · Paper page
- 10.1126/science.1411527 · DOI
- 10.1002/cne.901870104 · DOI
- (1982), Brain Res, 256, 379
- Ramón y Cajal S (1995) Histology of the nervous system of man and vertebrates. Vol II: Translated by N. Swanson and L. W. Swanson, Oxford: Oxford UP. · DOI
- 10.1523/JNEUROSCI.15-02-00981.1995 · DOI
- 10.1016/S0896-6273(04)00222-3 · DOI · Paper page
- 10.1093/cercor/10.6.602 · DOI
- 10.1007/s003359900240 · DOI
- 10.1016/S0306-4522(01)00016-1 · DOI
- 10.1002/jnr.10345 · DOI
- 10.1523/JNEUROSCI.19-23-10357.1999 · DOI
- 10.1016/S0092-8674(00)80782-5 · DOI · Paper page
- 10.1016/S0896-6273(00)80936-8 · DOI
Cited by
Sorted by citations
Branching out: mechanisms of dendritic arborization
Jan, Y.-N., & Jan, L. Y. (2010) · Nature Reviews Neuroscience · doi:10.1038/nrn2836 · Cited by 693
“In early cortical development, coordination of radial migration of mammalian pyramidal neurons is dependent on the Rho family of small GTPases, with the leading process becoming the apical dendrit”
BackgroundTrekking across the Brain: The Journey of Neuronal Migration
Ayala, R., Shu, T., & Tsai, L.-H. (2007) · Cell · doi:10.1016/j.cell.2006.12.021 · Cited by 620
Extracellular Matrix: Functions in the Nervous System
Barros, C. S., Franco, S. J., & Muller, U. (2011) · Cold Spring Harbor Perspectives in Biology · doi:10.1101/cshperspect.a005108 · Cited by 506
Young-Pearse, T. L., Bai, J., Chang, R., Zheng, J. B., LoTurco, J. J., & Selkoe, D. J. (2007) · The Journal of Neuroscience · doi:10.1523/jneurosci.4701-07.2007 · Cited by 369
The Reelin signaling pathway promotes dendritic spine development in hippocampal neurons
Niu, S., Yabut, O., & D'Arcangelo, G. (2008) · The Journal of Neuroscience · doi:10.1523/jneurosci.1917-08.2008 · Cited by 266
Jossin, Y., & Goffinet, A. M. (2007) · Molecular and Cellular Biology · doi:10.1128/mcb.00928-07 · Cited by 235
Reelin regulates postnatal neurogenesis and enhances spine hypertrophy and long-term potentiation
Pujadas, L., Gruart, A., Bosch, C., Delgado, L., Teixeira, C. M., Rossi, D., de Lecea, L., Martínez, A., Delgado-García, J. M., & Soriano, E. (2010) · The Journal of Neuroscience · doi:10.1523/jneurosci.5284-09.2010 · Cited by 219
Chai, X., Förster, E., Zhao, S., Bock, H. H., & Frotscher, M. (2009) · The Journal of Neuroscience · doi:10.1523/jneurosci.2934-08.2009 · Cited by 202
Reelin and neuropsychiatric disorders
Ishii, K., Kubo, K.-I., & Nakajima, K. (2016) · Frontiers in Cellular Neuroscience · doi:10.3389/fncel.2016.00229 · Cited by 185
Yang, Y. J., Baltus, A. E., Mathew, R. S., Murphy, E. A., Evrony, G. D., Gonzalez, D. M., Wang, E. P., Marshall-Walker, C. A., Barry, B. J., Murn, J., et al. (2012) · Cell · doi:10.1016/j.cell.2012.10.043 · Cited by 176
Self-citationRole for Reelin in stabilizing cortical architecture
Frotscher, M. (2010) · Trends in Neurosciences · doi:10.1016/j.tins.2010.06.001 · Cited by 157
Layer acquisition by cortical GABAergic interneurons is independent of Reelin signaling
Pla, R., Borrell, V., Flames, N., & Marín, O. (2006) · The Journal of Neuroscience · doi:10.1523/jneurosci.0245-06.2006 · Cited by 151
Cullin 5 regulates Dab1 protein levels and neuron positioning during cortical development
Feng, L., Allen, N. S., Simo, S., & Cooper, J. A. (2007) · Genes & Development · doi:10.1101/gad.1604207 · Cited by 148
Reelin in the years: controlling neuronal migration and maturation in the mammalian brain
D'Arcangelo, G. (2014) · Advances in Neuroscience · doi:10.1155/2014/597395 · Cited by 120
Agent-based modeling of morphogenetic systems: advantages and challenges.
Glen, C. M., Kemp, M. L., & Voit, E. O. (2019) · PLoS Computational Biology · doi:10.1371/journal.pcbi.1006577 · Cited by 116
Cell-autonomous inactivation of the reelin pathway impairs adult neurogenesis in the hippocampus
Teixeira, C. M., Kron, M. M., Masachs, N., Zhang, H., Lagace, D. C., Martinez, A., Reillo, I., Duan, X., Bosch, C., Pujadas, L., et al. (2012) · The Journal of Neuroscience · doi:10.1523/jneurosci.1857-12.2012 · Cited by 97
Callaway, E. M., & Borrell, V. (2011) · The Journal of Neuroscience · doi:10.1523/jneurosci.5222-10.2011 · Cited by 95
Reduction of Crk and CrkL expression blocks reelin-induced dendritogenesis
Matsuki, T., Pramatarova, A., & Howell, B. W. (2008) · Journal of Cell Science · doi:10.1242/jcs.027334 · Cited by 92
Simó, S., Jossin, Y., & Cooper, J. A. (2010) · The Journal of Neuroscience · doi:10.1523/jneurosci.0035-10.2010 · Cited by 72
Duit, S., Mayer, H., Blake, S. M., Schneider, W. J., & Nimpf, J. (2010) · Journal of Biological Chemistry · doi:10.1074/jbc.m109.025973 · Cited by 71
Dynamic expression of Dab2 in the mouse embryonic central nervous system
Cheung, K.-K., Mok, S. C., Rezaie, P., & Chan, W. Y. (2008) · BMC Developmental Biology · doi:10.1186/1471-213x-8-76 · Cited by 23
Effects of Ethanol Exposure In Utero on Cajal–Retzius Cells in the Developing Cortex
Skorput, A. G. J., & Yeh, H. H. (2015) · Alcoholism: Clinical and Experimental Research · doi:10.1111/acer.12696 · Cited by 12
Metadata
- Authors
- Olson, E. C., Kim, S., & Walsh, C. A.
- Venue
- The Journal of Neuroscience
- Publisher
- Society for Neuroscience
- Published
- 2006-02-08
- Volume
- 26
- Issue
- 6
- Pages
- 1767-1775
- ISSN
- 0270-6474
- 1529-2401
- Cited by
- 123
- References
- 5
- Language
- en
About these checks
Registry, retraction, Cites and statistics results are computed, not judged, with one exception: a printed reference that no index lists is read once by a model before it counts as a citation error. Claims are extracted by a model and kept only when their quote appears verbatim in the text; each cited source is then checked, with a model’s help, for whether it says what the claim relies on. Those verdicts can be wrong — read the claim’s quote and the cited source before relying on one.
Statistics and arithmetic are recomputed, not judged.
Confidence bands are shown only for fields calibrated on our annotated test set. None is calibrated yet, so no band is shown.
What counts as a claim ›How we measure confidence ›How we check this ›
Are you an author, or do you see a problem with this page? Request a review
