

The DOI matches its Crossref record; 32 of the 32 references it cites were found in a registry or an index.
Long-term therapeutic silencing of miR-33 increases circulating triglyceride levels and hepatic lipid accumulation in mice
Open accessAbstract
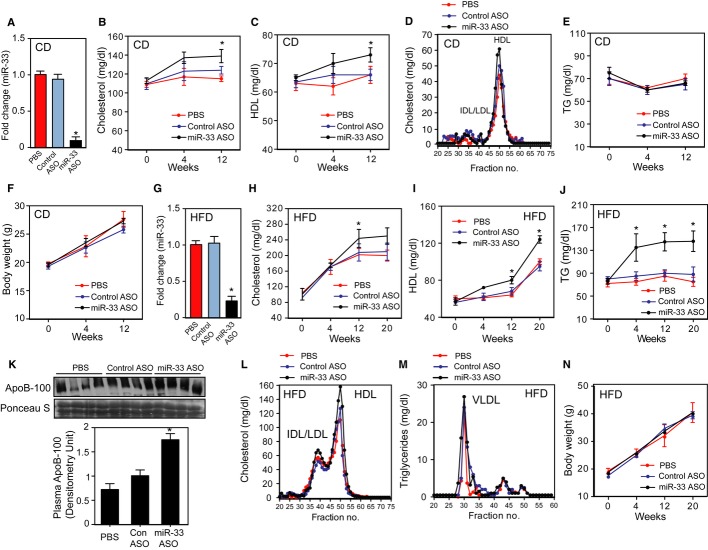
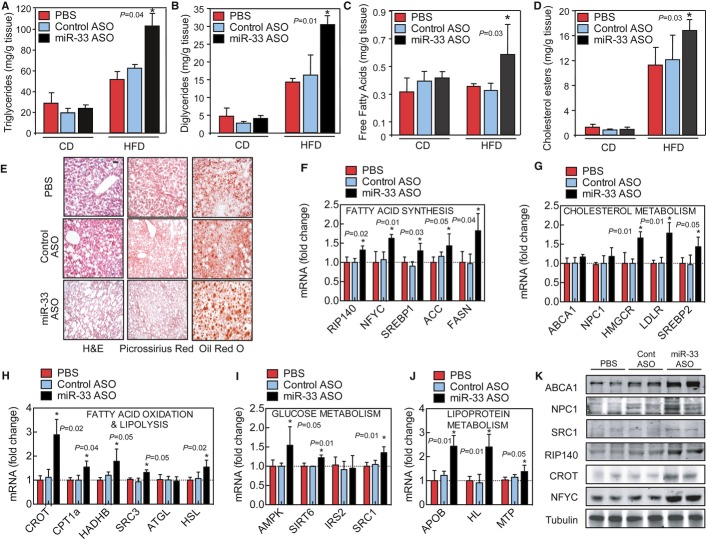
Plasma high‐density lipoprotein (HDL) levels show a strong inverse correlation with atherosclerotic vascular disease. Previous studies have demonstrated that antagonism of miR‐33 in vivo increases circulating HDL and reverse cholesterol transport (RCT), thereby reducing the progression and enhancing the regression of atherosclerosis. While the efficacy of short‐term anti‐miR‐33 treatment has been previously studied, the long‐term effect of miR‐33 antagonism in vivo remains to be elucidated. Here, we show that long‐term therapeutic silencing of miR‐33 increases circulating triglyceride (TG) levels and lipid accumulation in the liver. These adverse effects were only found when mice were fed a high‐fat diet (HFD). Mechanistically, we demonstrate that chronic inhibition of miR‐33 increases the expression of genes involved in fatty acid synthesis such as acetyl‐CoA carboxylase (ACC) and fatty acid synthase (FAS) in the livers of mice treated with miR‐33 antisense oligonucleotides. We also report that anti‐miR‐33 therapy enhances the expression of nuclear transcription Y subunit gamma (NFYC), a transcriptional regulator required for DNA binding and full transcriptional activation of SREBP‐responsive genes, including ACC and FAS. Taken together, these results suggest that persistent inhibition of miR‐33 when mice are fed a high‐fat diet (HFD) might cause deleterious effects such as moderate hepatic steatosis and hypertriglyceridemia. These unexpected findings highlight the importance of assessing the effect of chronic inhibition of miR‐33 in non‐human primates before we can translate this therapy to humans.
Overview
The claims and statistics of this paper haven’t been checked yet.
Run the check — free, no account needed. It reads the open-access text and checks the sources it cites.
Integrity signals
Registry
Cites
Statistics
Figures
Verification
Claims the paper makes
The claims and statistics of this paper haven’t been checked yet.
Run the check — free, no account needed. It reads the open-access text and checks the sources it cites.
Claims other papers make about this one
Each is checked against this paper’s own text: does it say what the citing paper says it does?
The cited source says what the claim attributes to it.
In the citing paper
“Additionally, some studies of long-term anti-miR-33 treatment have reported deleterious effects including increased circulating levels of triglycerides (TAGs) and the development of hepatic steatosis (Allen et al., 2014; Goedeke et al., 2014).”
From Genetic dissection of the impact of miR-33a and miR-33b during the progression of atherosclerosis (2017) · cites this paper as Goedeke et al., 2014
The cited source says what the claim attributes to it.
In the citing paper
“the hypertriglyceridemia and hepatic steatosis observed in some long term anti-miR-33 studies (Allen et al., 2014; Goedeke et al., 2014)”
From Genetic dissection of the impact of miR-33a and miR-33b during the progression of atherosclerosis (2017) · cites this paper as Goedeke et al., 2014
Self-check
Percentages, sums and reported differences re-computed from the paper’s own numbers.
The self-check needs the paper’s full text.
Citations
Cites
Bartel (2004) · doi:10.1016/s0092-8674(04)00045-5 · Cited by 34,714
Huang, D. W., Sherman, B. T., & Lempicki, R. A. (2009) · Nucleic Acids Research · doi:10.1093/nar/gkn923 · Cited by 14,108
The functions of animal microRNAs
Ambros, V. (2004) · Nature · doi:10.1038/nature02871 · Cited by 10,728
(2008) · doi:10.1038/nrg2290 · Cited by 5,199
SREBPs: activators of the complete program of cholesterol and fatty acid synthesis in the liver
Horton, J. D., Goldstein, J. L., & Brown, M. S. (2002) · Journal of Clinical Investigation · doi:10.1172/jci15593 · Cited by 4,794
SREBPs: activators of the complete program of cholesterol and fatty acid synthesis in the liver
Horton, J. D., Goldstein, J. L., & Brown, M. S. (2002) · Journal of Clinical Investigation · doi:10.1172/jci0215593 · Cited by 4,092
Brown, M. S., & Goldstein, J. L. (1997) · Cell · doi:10.1016/s0092-8674(00)80213-5 · Cited by 3,834
Non-coding RNAs and cancer: microRNAs and beyond
Raia, R. M., & Călin, G. A. (2011) · Journal of Nucleic Acids Investigation · doi:10.4081/jnai.2011.e5 · Cited by 3,394
Mechanisms for Insulin Resistance: Common Threads and Missing Links
Samuel, V. T., & Shulman, G. I. (2012) · Cell · doi:10.1016/j.cell.2012.02.017 · Cited by 2,294
MiR-33 Contributes to the Regulation of Cholesterol Homeostasis
Rayner, K. J., Suárez, Y., Dávalos, A., Parathath, S., Fitzgerald, M. L., Tamehiro, N., Fisher, E. A., Moore, K. J., & Fernández-Hernando, C. (2010) · Science · doi:10.1126/science.1189862 · Cited by 1,260
Self-citation
Cited by
Sorted by citations
MicroRNA therapeutics: towards a new era for the management of cancer and other diseases
Rupaimoole, R., & Slack, F. J. (2017) · Nature Reviews Drug Discovery · doi:10.1038/nrd.2016.246 · Cited by 4,741
HDL and Reverse Cholesterol Transport
Ouimet, M. I., Barrett, T. J., & Fisher, E. A. A. (2019) · Circulation Research · doi:10.1161/circresaha.119.312617 · Cited by 816
Self-citationMicroRNA Regulation of Atherosclerosis
Feinberg, M. W., & Moore, K. J. (2016) · Circulation Research · doi:10.1161/circresaha.115.306300 · Cited by 638
Deiuliis, J. A. (2015) · International Journal of Obesity · doi:10.1038/ijo.2015.170 · Cited by 365
MicroRNA-148a regulates LDL receptor and ABCA1 expression to control circulating lipoprotein levels
Goedeke, L., Rotllan, N., Canfrán-Duque, A., Aranda, J. F., Ramírez, C. M., Araldi, E., Lin, C.-S., Anderson, N. N., Wagschal, A., de Cabo, R., et al. (2015) · Nature Medicine · doi:10.1038/nm.3949 · Cited by 238
Self-citationMicroRNAs and lipid metabolism
Aryal, B., Singh, A. K., Rotllan, N., Price, N., & Fernández-Hernando, C. (2017) · Current Opinion in Lipidology · doi:10.1097/mol.0000000000000420 · Cited by 191
Canfrán‐Duque, A., Rotllán, N., Zhang, X., Fernández‐Fuertes, M., Ramírez, C. M., Araldi, E., Daimiel, L., Busto, R., Fernandez-Hernando, C. F., & Suárez, Y. (2017) · EMBO Molecular Medicine · doi:10.15252/emmm.201607492 · Cited by 207
Self-citationKarunakaran, D., Thrush, A. B., Nguyen, M.-A., Richards, L., Geoffrion, M., Singaravelu, R., Ramphos, E., Shangari, P., Ouimet, M., Pezacki, J. P., et al. (2015) · Circulation Research · doi:10.1161/circresaha.117.305624 · Cited by 188
Ogg1 -Dependent DNA Repair Regulates NLRP3 Inflammasome and Prevents Atherosclerosis
Tumurkhuu, G., Shimada, K., Dagvadorj, J., Crother, T. R., Zhang, W., Luthringer, D., Gottlieb, R. A., Chen, S., & Arditi, M. (2016) · Circulation Research · doi:10.1161/circresaha.116.308362 · Cited by 182
Emerging role of microRNAs in lipid metabolism
Yang, Z., Cappello, T., & Wang, L. (2015) · Acta Pharmaceutica Sinica B · doi:10.1016/j.apsb.2015.01.002 · Cited by 176
Lu, H. S., & Daugherty, A. (2015) · Arteriosclerosis Thrombosis and Vascular Biology · doi:10.1161/atvbaha.115.305380 · Cited by 171
miRNAs in atherosclerotic plaque initiation, progression, and rupture
Andreou, I., Sun, X., Stone, P. H., Edelman, E. R., & Feinberg, M. W. (2015) · Trends in Molecular Medicine · doi:10.1016/j.molmed.2015.02.003 · Cited by 155
MicroRNAs in the Pathobiology and Therapy of Atherosclerosis
Laffont, B., & Rayner, K. J. (2017) · Canadian Journal of Cardiology · doi:10.1016/j.cjca.2017.01.001 · Cited by 153
MicroRNAs as therapeutic targets in cardiovascular disease
Laggerbauer, B., & Engelhardt, S. H. (2022) · Journal of Clinical Investigation · doi:10.1172/jci159179 · Cited by 157
Genetic dissection of the impact of miR-33a and miR-33b during the progression of atherosclerosis
Price, N. L., Rotllan, N., Canfrán-Duque, A., Zhang, X., Pati, P., Arias, N., Moen, J., Mayr, M., Ford, D. A., Baldán, Á., et al. (2017) · Cell reports · doi:10.1016/j.celrep.2017.10.023 · Cited by 129
Self-citationLiver microRNAs: potential mediators and biomarkers for metabolic and cardiovascular disease?
Willeit, P., Skroblin, P., Kiechl, S. J., Fernandez-Hernando, C. F., & Mayr, M. (2016) · European Heart Journal · doi:10.1093/eurheartj/ehw146 · Cited by 128
Self-citationmicroRNAs in lipoprotein metabolism and cardiometabolic disorders
Rotllan, N., Price, N., Pati, P., Goedeke, L., & Fernández-Hernando, C. (2016) · Atherosclerosis · doi:10.1016/j.atherosclerosis.2016.01.025 · Cited by 100
Self-citationPrice, N. L., Singh, A. K., Rotllan, N., Goedeke, L., Wing, A., Canfrán-Duque, A., Diaz-Ruiz, A., Araldi, E., Baldán, Á., Camporez, J.-P., et al. (2018) · Cell Reports · doi:10.1016/j.celrep.2018.01.074 · Cited by 110
Self-citationDisordered haematopoiesis and athero-thrombosis
Murphy, A. J., & Tall, A. R. (2016) · European Heart Journal · doi:10.1093/eurheartj/ehv718 · Cited by 111
Cadmium induces BNIP3-dependent autophagy in chicken spleen by modulating miR-33-AMPK axis.
Chen, M., Li, X., Fan, R.-F., Yang, J., Jin, X., Hamid, S., & Xu, S.-W. (2018) · Chemosphere · doi:10.1016/j.chemosphere.2017.12.026 · Cited by 104
Rahmani, A., Saleki, K., Javanmehr, N., Javad, K., Saadat, P., & Nouri, H. R. (2020) · Ageing Research Reviews · doi:10.1016/j.arr.2020.101106 · Cited by 98
Small Things Matter: Relevance of MicroRNAs in Cardiovascular Disease
Peters, L. J. F., Biessen, E. A. L., Hohl, M., Weber, C., van der Vorst, E. P. C., & Santovito, D. (2020) · Frontiers in Physiology · doi:10.3389/fphys.2020.00793 · Cited by 101
miR-33-5p, a novel mechano-sensitive microRNA promotes osteoblast differentiation by targeting Hmga2
Wang, H., Sun, Z., Wang, Y., Hu, Z., Zhou, H., Zhang, L., Hong, B., Zhang, S., & Cao, X. (2016) · Scientific Reports · doi:10.1038/srep23170 · Cited by 96
Non-canonical features of microRNAs: paradigms emerging from cardiovascular disease
Santovito, D., & Weber, C. (2022) · Nature Reviews Cardiology · doi:10.1038/s41569-022-00680-2 · Cited by 95
Ghareghani, P., Shanaki, M., Ahmadi, S., Khoshdel, A., Rezvan, N., Meshkani, R., Delfan, M., & Gorgani‐Firuzjaee, S. (2017) · Obesity Research & Clinical Practice · doi:10.1016/j.orcp.2017.01.004 · Cited by 78
Non-coding RNA regulation of endothelial and macrophage functions during atherosclerosis
Aryal, B. K., & Suárez, Y. (2018) · Vascular Pharmacology · doi:10.1016/j.vph.2018.03.001 · Cited by 78
Self-citationTargeted Suppression of miRNA-33 Using pHLIP Improves Atherosclerosis Regression
Zhang, X., Rotllan, N., Canfrán-Duque, A., Sun, J., Toczek, J., Moshnikova, A., Malik, S., Price, N. L., Araldi, E., Zhong, W., et al. (2022) · Circulation Research · doi:10.1161/circresaha.121.320296 · Cited by 75
Self-citationNishiga, M., Horie, T., Kuwabara, Y., Nagao, K., Baba, O., Nakao, T., Nishino, T., Hakuno, D., Nakashima, Y., Nishi, H., et al. (2016) · Circulation Research · doi:10.1161/circresaha.116.309528 · Cited by 71
Karunakaran, D., Richards, L. M., Geoffrion, M., Barrette, D., Gotfrit, R., Harper, M., & Rayner, K. J. (2015) · Arteriosclerosis Thrombosis and Vascular Biology · doi:10.1161/atvbaha.115.306404 · Cited by 67
Genetic deficiency or pharmacological inhibition of miR-33 protects from kidney fibrosis
Price, N. L., Miguel, V., Ding, W. J., Singh, A. K., Malik, S., Rotllán, N., Moshnikova, A., Toczek, J., Zeiss, C. J., Sadeghi, M. M., et al. (2019) · JCI Insight · doi:10.1172/jci.insight.131102 · Cited by 66
Self-citationEpigenetic regulation of cholesterol homeostasis
Meaney, S. (2014) · Frontiers in Genetics · doi:10.3389/fgene.2014.00311 · Cited by 68
Micro-RNAs and High-Density Lipoprotein Metabolism
Canfrán‐Duque, A., Lin, C., Goedeke, L., Suárez, Y., & Fernandez-Hernando, C. F. (2016) · Arteriosclerosis Thrombosis and Vascular Biology · doi:10.1161/atvbaha.116.307028 · Cited by 64
Self-citationMicroRNAs in obesity-associated disorders
Abente, E. J., Subramanian, M., Ramachandran, V., & Najafi-Shoushtari, S. H. (2015) · Archives of Biochemistry and Biophysics · doi:10.1016/j.abb.2015.09.018 · Cited by 63
The role of miRNAs in cardiovascular disease risk factors
Buie, J. N. J., Goodwin, A. J., IV, Cook, J. A., Halushka, P. V., & Fan, H. (2016) · Atherosclerosis · doi:10.1016/j.atherosclerosis.2016.09.067 · Cited by 63
SREBP-1c/MicroRNA 33b Genomic Loci Control Adipocyte Differentiation
Price, N. L., Holtrup, B., Kwei, S. L., Wabitsch, M., Rodeheffer, M. S., Bianchini, L., Suárez, Y., & Fernandez-Hernando, C. F. (2016) · Molecular and Cellular Biology · doi:10.1128/mcb.00745-15 · Cited by 61
Self-citationTakahashi, H., Kotani, K., Tanaka, K., Egucih, Y., & Anzai, K. (2018) · Frontiers in Endocrinology · doi:10.3389/fendo.2018.00588 · Cited by 55
Li, X., Lian, F., Liu, C., Hu, K., & Wang, X. (2015) · Scientific Reports · doi:10.1038/srep16774 · Cited by 55
MicroRNAs in lipid metabolism and atherosclerosis
Giral, H., Kratzer, A., & Landmesser, U. (2016) · Best Practice & Research Clinical Endocrinology & Metabolism · doi:10.1016/j.beem.2016.11.010 · Cited by 56
Posttranscriptional regulation of lipid metabolism by non-coding RNAs and RNA binding proteins
Singh, A. K., Aryal, B. K., Zhang, X., Fan, Y., Price, N. L., Suárez, Y., & Fernandez-Hernando, C. F. (2017) · Seminars in Cell and Developmental Biology · doi:10.1016/j.semcdb.2017.11.026 · Cited by 55
Self-citationNon-coding RNAs in lipid metabolism
Zhang, X., Price, N. L., & Fernandez-Hernando, C. F. (2018) · Vascular Pharmacology · doi:10.1016/j.vph.2018.06.011 · Cited by 54
Polymer nanocarriers for MicroRNA delivery
Kapadia, C. H., Luo, B., Dang, M. N., Irvin-Choy, N. S., Valcourt, D. M., & Day, E. S. (2019) · Journal of Applied Polymer Science · doi:10.1002/app.48651 · Cited by 60
Stamatikos, A., Knight, E., Vojtech, L. N., Bi, L., Wacker, B. K., Tang, C., & Dichek, D. A. (2019) · Human Gene Therapy · doi:10.1089/hum.2019.245 · Cited by 54
Age‐associated vascular inflammation promotes monocytosis during atherogenesis
Du, W., Wong, C. K., Song, Y., Shen, H., Mori, D. N., Rotllán, N., Price, N. L., Dobrian, A. D., Meng, H., Kleinstein, S. H., et al. (2016) · Aging Cell · doi:10.1111/acel.12488 · Cited by 54
Huang, K., Bao, H., Yan, Z., Wang, L., Zhang, P., Yao, Q., Shi, Q., Chen, X., Wang, K., Shen, B., et al. (2017) · Cardiovascular Research · doi:10.1093/cvr/cvw257 · Cited by 52
Targeting and delivery of microRNA-targeting antisense oligonucleotides in cardiovascular diseases
Saenz-Pipaon, G., & Dichek, D. (2022) · Atherosclerosis · doi:10.1016/j.atherosclerosis.2022.12.003 · Cited by 45
Exosomes in Cardiovascular Disease: From Mechanism to Therapeutic Target
Reiss, A. B., Ahmed, S., Johnson, M., Saeedullah, U., & Leon, J. D. (2023) · Metabolites · doi:10.3390/metabo13040479 · Cited by 54
Functions of microRNA-33a/b and microRNA therapeutics
Ono, K. (2015) · Journal of Cardiology · doi:10.1016/j.jjcc.2015.10.017 · Cited by 52
Autophagy in cardiovascular diseases: role of noncoding RNAs
Gao, J., Chen, X., Shan, C., Wang, Y., Li, P., & Shao, K. (2020) · Molecular Therapy — Nucleic Acids · doi:10.1016/j.omtn.2020.10.039 · Cited by 52
Price, N. L., Zhang, X., Fernández-Tussy, P., Singh, A. K., Burnap, S. A., Rotllan, N., Goedeke, L., Sun, J., Canfrán-Duque, A., Aryal, B., et al. (2021) · Proceedings of the National Academy of Sciences · doi:10.1073/pnas.2006478118 · Cited by 50
Self-citationmicroRNA-33 maintains adaptive thermogenesis via enhanced sympathetic nerve activity
Horie, T., Nakao, T., Miyasaka, Y., Nishino, T., Matsumura, S., Nakazeki, F., Ide, Y., Kimura, M., Tsuji, S., Rodriguez, R. R., et al. (2021) · Nature Communications · doi:10.1038/s41467-021-21107-5 · Cited by 49
Liu, M.-X., Gao, M., Li, C.-Z., Yu, C., Yan, H., Peng, C., Li, Y., Li, C., Ma, Z.-L., Zhao, Y., et al. (2017) · Acta Pharmacologica Sinica · doi:10.1038/aps.2016.158 · Cited by 47
miRNA regulation of LDL-cholesterol metabolism
Goedeke, L., Wagschal, A., Fernández-Hernando, C., & Näär, A. M. (2016) · Biochimica et Biophysica Acta (BBA) - Molecular and Cell Biology of Lipids · doi:10.1016/j.bbalip.2016.03.007 · Cited by 39
Self-citationHDL and microRNA therapeutics in cardiovascular disease
Michell, D. L., & Vickers, K. C. (2016) · Pharmacology & Therapeutics · doi:10.1016/j.pharmthera.2016.09.001 · Cited by 45
MicroRNAs and Circular RNAs in Lipoprotein Metabolism
Fernández‐Tussy, P., Ruz‐Maldonado, I., & Fernandez-Hernando, C. F. (2021) · Current Atherosclerosis Reports · doi:10.1007/s11883-021-00934-3 · Cited by 44
MicroRNAs in Liver Regeneration
Chen, X., Zhao, Y., Wang, F., Bei, Y., Xiao, J., & Yang, C. (2015) · Cellular Physiology and Biochemistry · doi:10.1159/000430381 · Cited by 44
Small but smart: MicroRNAs orchestrate atherosclerosis development and progression
Santovito, D., Egea, V., & Weber, C. (2015) · Biochimica et Biophysica Acta (BBA) - Molecular and Cell Biology of Lipids · doi:10.1016/j.bbalip.2015.12.013 · Cited by 45
The Promise and Challenge of Therapeutic MicroRNA Silencing in Diabetes and Metabolic Diseases
Sethupathy, P. (2016) · Current Diabetes Reports · doi:10.1007/s11892-016-0745-3 · Cited by 44
Gadde, S., & Rayner, K. J. (2016) · Arteriosclerosis Thrombosis and Vascular Biology · doi:10.1161/atvbaha.116.307481 · Cited by 44
MicroRNA regulation of cholesterol metabolism
Citrin, K. M., Fernandez-Hernando, C. F., & Suárez, Y. (2021) · Annals of the New York Academy of Sciences · doi:10.1111/nyas.14566 · Cited by 45
Self-citationOrtega, R., Liu, B., & Persaud, S. J. (2023) · International Journal of Molecular Sciences · doi:10.3390/ijms241310777 · Cited by 45
Circulating miRNA-33: a potential biomarker in patients with coronary artery disease
Reddy, L. L., Shah, S. A. V., Ponde, C. K., Rajani, R. M., & Ashavaid, T. F. (2018) · Biomarkers · doi:10.1080/1354750x.2018.1501760 · Cited by 37
Zhu, M., Wang, Q., Zhou, W.-J., Liu, T., Yang, L.-L., Zheng, P.-Y., Zhang, L., & Ji, G. (2018) · Scientific Reports · doi:10.1038/s41598-018-25743-8 · Cited by 32
Suksangrat, T., Phannasil, P., & Jitrapakdee, S. (2019) · Advances in experimental medicine and biology · doi:10.1007/978-3-030-12668-1_7 · Cited by 34
Promises of Nanotherapeutics in Obesity
Ash, G. I., Kim, D., & Choudhury, M. (2019) · Trends in Endocrinology and Metabolism · doi:10.1016/j.tem.2019.04.004 · Cited by 33
Lim, J. Y., Liu, C., Hu, K., Smith, D. E., & Wang, X. (2018) · Archives of Biochemistry and Biophysics · doi:10.1016/j.abb.2018.07.007 · Cited by 34
miRNAs in non-alcoholic fatty liver disease
He, Z., Hu, C., & Jia, W. (2016) · Frontiers of Medicine · doi:10.1007/s11684-016-0468-5 · Cited by 33
‘Micro‐managers’ of hepatic lipid metabolism and NAFLD
Liu, W., Cao, H., Yan, J., Huang, R., & Ying, H. (2015) · Wiley Interdisciplinary Reviews - RNA · doi:10.1002/wrna.1295 · Cited by 33
Hepatic lipase deficiency produces glucose intolerance, inflammation and hepatic steatosis
Andrés‐Blasco, I., Herrero-Cervera, A., Vinué, Á., Martínez‐Hervás, S., Piqueras, L., Sanz, M., Burks, D. J., & Navarro, H. G. (2015) · Journal of Endocrinology · doi:10.1530/joe-15-0219 · Cited by 33
Yang, P.-L., Rong, X.-L., Gao, Z., Wang, J.-J., & Liu, Z. (2025) · Pharmacological Research · doi:10.1016/j.phrs.2025.107588 · Cited by 29
Zhang, C., Chen, K., Wei, R., Fan, G., Cai, X., Xu, L., Cen, B., Wang, J., Xie, H., Zheng, S., et al. (2020) · Signal Transduction and Targeted Therapy · doi:10.1038/s41392-020-0105-2 · Cited by 29
Wang, H., Hu, Z.-B., Shi, F., Dong, J., Dang, L., Wang, Y., Sun, Z., Zhou, H., Zhang, S., Cao, X.-S., et al. (2018) · Cell Death and Disease · doi:10.1038/s41419-017-0210-5 · Cited by 28
MiR-33 promotes myocardial fibrosis by inhibiting MMP16 and stimulating p38 MAPK signaling
Chen, Z., Ding, H., Guo, X., Shen, J., Fan, D., Huang, Y., & Huang, C. (2018) · Oncotarget · doi:10.18632/oncotarget.25173 · Cited by 27
MicroRNAs regulating apolipoprotein B-containing lipoprotein production
Zhou, L., Irani, S., Sirwi, A., & Hussain, M. M. (2016) · Biochimica et Biophysica Acta (BBA) - Molecular and Cell Biology of Lipids · doi:10.1016/j.bbalip.2016.02.020 · Cited by 26
Näär, A. M. (2018) · Trends in Endocrinology and Metabolism · doi:10.1016/j.tem.2018.04.004 · Cited by 26
Sud, N., Taher, J., & Su, Q. (2015) · Drug Development Research · doi:10.1002/ddr.21269 · Cited by 25
Role of Noncoding RNA in Development of Nonalcoholic Fatty Liver Disease
Huang, R. X., Duan, X., Fan, J., Li, G., & Wang, B. (2019) · BioMed Research International · doi:10.1155/2019/8690592 · Cited by 24
Vahdat‐Lasemi, F., Mahjoubin‐Tehran, M., Aghaee‐Bakhtiari, S. H., Jalili, A., Jaafari, M. R., & Sahebkar, A. (2019) · Drug Discovery Today · doi:10.1016/j.drudis.2019.04.007 · Cited by 24
Szydełko, J., & Matyjaszek-Matuszek, B. (2022) · International Journal of Molecular Sciences · doi:10.3390/ijms24010616 · Cited by 19
Therapeutic Applications of Poly-miRNAs and miRNA Sponges
Avendaño-Portugal, C., Montaño-Samaniego, M., Guttman-Bazbaz, R., Bravo-Estupiñan, D. M., & Ibáñez-Hernández, M. (2025) · International Journal of Molecular Sciences · doi:10.3390/ijms26104535 · Cited by 21
The Role of miRNA in the Pathophysiology of Neuroendocrine Tumors
Geisler, L. J., Mohr, R. U., Lambrecht, J., Knorr, J., Jann, H., Loosen, S. H., Özdirik, B., Luedde, T., Hammerich, L., Tacke, F., et al. (2021) · International Journal of Molecular Sciences · doi:10.3390/ijms22168569 · Cited by 23
Ganjali, S., Momtazi‐Borojeni, A. A., Banach, M., Kovanen, P. T., Gotto, A. M., & Sahebkar, A. (2017) · Drug Discovery Today · doi:10.1016/j.drudis.2017.09.014 · Cited by 21
MOVAS Cells: A Versatile Cell Line for Studying Vascular Smooth Muscle Cell Cholesterol Metabolism
Esobi, I. C., Barksdale, C., Heard‐Tate, C., Powell, R. R., Bruce, T. F., & Stamatikos, A. (2021) · Lipids · doi:10.1002/lipd.12303 · Cited by 23
Mallat, Z. (2017) · Arteriosclerosis Thrombosis and Vascular Biology · doi:10.1161/atvbaha.117.309730 · Cited by 19
The power of microRNA regulation—insights into immunity and metabolism
Oliveto, S., Manfrini, N., & Biffo, S. (2025) · FEBS Letters · doi:10.1002/1873-3468.70039 · Cited by 21
Axsom, J., Schmidt, H. D., Matura, L. A., & Libonati, J. R. (2021) · Frontiers in Physiology · doi:10.3389/fphys.2021.686270 · Cited by 20
Signal Transduction and Molecular Regulation in Fatty Liver Disease
Dong, X. C., Chowdhury, K., Huang, M., & Kim, H.-G. (2021) · Antioxidants and Redox Signaling · doi:10.1089/ars.2021.0076 · Cited by 18
Salama, R. M., Eissa, N., Doghish, A. S., Abulsoud, A. I., Abdelmaksoud, N. M., Mohammed, O. A., Mageed, S. S. A., & Darwish, S. F. (2024) · Frontiers in Aging · doi:10.3389/fragi.2024.1373741 · Cited by 18
Polysome shift assay for direct measurement of miRNA inhibition by anti-miRNA drugs
Androsavich, J. R., Sobczynski, D. J., Liu, X., Pandya, S., Kaimal, V., Owen, T., Liu, K., MacKenna, D. A., & Chau, B. N. (2015) · Nucleic Acids Research · doi:10.1093/nar/gkv893 · Cited by 17
miRNAs and High-Density Lipoprotein metabolism
Baldán, Á., & Vallim, T. Q. D. A. (2016) · Biochimica et Biophysica Acta (BBA) - Molecular and Cell Biology of Lipids · doi:10.1016/j.bbalip.2016.01.021 · Cited by 18
Mirtazapine Reduces Adipocyte Hypertrophy and Increases Glucose Transporter Expression in Obese Mice
Wu, C., Hou, P., Mao, F. C., Su, Y.-C., Wu, C.-Y., Yang, W., Lin, C., Tsai, H.-P., Liao, H.-J., & Chang, G. (2020) · Animals · doi:10.3390/ani10081423 · Cited by 16
Exploring the Regulatory Role of ncRNA in NAFLD: A Particular Focus on PPARs
Mukherjee, A. G., Wanjari, U. R., Gopalakrishnan, A. V., Katturajan, R., Kannampuzha, S., Murali, R., Namachivayam, A., Ganesan, R., Renu, K., Dey, A., et al. (2022) · Cells · doi:10.3390/cells11243959 · Cited by 16
Esobi, I. C., Oladosu, O., Echesabal-Chen, J., Powell, R. R., Bruce, T. F., & Stamatikos, A. (2023) · Journal of Lipids · doi:10.1155/2023/8241899 · Cited by 19
miRNAs may change rapidly with thoughts: The Relaxation Response after myocardial infarction
Lin, C. D., Gola, E., Brocca, A., Rubino, G., Marinova, M., Brugnolo, L., Plebani, M., Iliceto, S., & Tona, F. (2018) · European Journal of Integrative Medicine · doi:10.1016/j.eujim.2018.03.009 · Cited by 17
MicroRNA in cardio-metabolic disorders
Su, X., Nie, M., Zhang, G., & Wang, B. (2021) · Clinica Chimica Acta · doi:10.1016/j.cca.2021.03.024 · Cited by 18
Is microRNA-33 an Appropriate Target in the Treatment of Atherosclerosis?
Sidorkiewicz, M. (2023) · Nutrients · doi:10.3390/nu15040902 · Cited by 16
MicroRNAs and Long Noncoding RNAs in Coronary Artery Disease
Zaręba, Ł., Fitas, A., Wolska, M., Junger, E., Eyileten, C., Wicik, Z., Rosa, S. D., Siller-Matula, J. M., & Postula, M. A. (2020) · Cardiology Clinics · doi:10.1016/j.ccl.2020.07.005 · Cited by 14
Liver-specific microRNA-185 knockout promotes cholesterol dysregulation in mice
Chen, C., Matye, D. J., Wang, Y., & Li, T. (2020) · Liver Research · doi:10.1016/j.livres.2020.09.001 · Cited by 14
Zhang, L., Wang, M., Chen, M., Niu, W., Liu, W., Leng, T., Ji, W., & Lei, B. (2020) · Chemical Engineering Journal · doi:10.1016/j.cej.2020.127304 · Cited by 14
MicroRNA-Mediated Regulation of Vascular Endothelium: From Pro-Inflammation to Atherosclerosis
Silva, V. R., Azar, A., Gonçalves, E. R., Nascimento, T. C. D. M., Buchaim, R. L., Buchaim, D. V., Oliveira, F. A., Nassar, C. C., Camargo, T. M., Caboclo, R. F., et al. (2025) · International Journal of Molecular Sciences · doi:10.3390/ijms26135919 · Cited by 13
Vladimirov, S. S., Tomasevic, M., Popov, N., Munjas, J., de Gonzalo‐Calvo, D., & Sopić, M. (2025) · Seminars in Cancer Biology · doi:10.1016/j.semcancer.2025.06.005 · Cited by 14
Metadata
- Authors
- Goedeke, L., Salerno, A., Ramírez, C. M., Guo, L., Allen, R. M., Yin, X., Langley, S. R., Esau, C., Wanschel, A., Fisher, E. A., Suárez, Y., Baldán, A., Mayr, M., & Fernández‐Hernando, C.
- Affiliations
- Yale University (US)
- New York University (US)
- Saint Louis University (US)
- King's College London (GB)
- Regulus Therapeutics (United States) (US)
- ORCID
- Venue
- EMBO Molecular Medicine
- Published
- 2014-07-18
- Volume
- 6
- Issue
- 9
- Pages
- 1133-1141
- ISSN
- 1757-4676 (ISSN-L)
- 1757-4684
- PMC
- PMC4197861
- OpenAlex
- W2142082511
- Cited by
- 145
- References
- 32
- Citations by year
- 2026: 2 · 2025: 12 · 2024: 6 · 2023: 8 · 2022: 10 · 2021: 10 · 2020: 11 · 2019: 12 · 2018: 11 · 2017: 17 · 2016: 23 · 2015: 21 · 2014: 2
- FWCI
- 20.84
- Type
- journal article
- Language
- en
- Open access
- gold
- doi.org
- Locations
- EMBO Molecular Medicine (publishedVersion, other-oa)
- Europe PMC (PubMed Central) (publishedVersion, cc-by)
- PubMed Central (publishedVersion, cc-by)
- PubMed (publishedVersion)
- National University of Singapore (submittedVersion, cc-by)
- DOAJ (DOAJ: Directory of Open Access Journals) (submittedVersion)
- ORCA Online Research @Cardiff (Cardiff University) (submittedVersion)
- Research Portal (King's College London) (submittedVersion, other-oa)
- Funders
- National Institutes of Health (R01HL107953, R01HL107953‐04S1, R01HL106063, 1F31AG043318, R01HL107794)
- Foundation Leducq Transatlantic Network of Excellence in Cardiovascular Research
- Heart Research UK
- Department of Health via the National Institute for Health Research
- Biomedical Research Centre
- NHS Foundation Trust
- King's College London
- King's College Hospital NHS Foundation Trust
- British Heart Foundation
- AHA Predoctoral Fellowship (11PRE7240026)
- Topics
- Life Sciences › Biochemistry, Genetics and Molecular Biology › Biochemistry › Cholesterol and Lipid Metabolism
- Life Sciences › Biochemistry, Genetics and Molecular Biology › Cancer Research › MicroRNA in disease regulation
- Health Sciences › Medicine › Cardiology and Cardiovascular Medicine › Lipid metabolism and disorders
- Keywords
- miR-33, antisense oligonucleotides, hypertriglyceridemia, hepatic steatosis, fatty acid synthesis, acetyl-CoA carboxylase, fatty acid synthase, SREBP, high-fat diet, HDL cholesterol, reverse cholesterol transport, atherosclerosis
- MeSH terms
- Animals, Fatty Liver, Liver, Male, Mice, Inbred C57BL, Triglycerides, Oligonucleotides, Antisense, Gene Silencing, MicroRNAs, Lipid Metabolism, Diet, High-Fat
About these checks
Registry, retraction, Cites and statistics results are computed, not judged, with one exception: a printed reference that no index lists is read once by a model before it counts as a citation error. Claims are extracted by a model and kept only when their quote appears verbatim in the text; each cited source is then checked, with a model’s help, for whether it says what the claim relies on. Those verdicts can be wrong — read the claim’s quote and the cited source before relying on one.
Statistics and arithmetic are recomputed, not judged.
Confidence bands are shown only for fields calibrated on our annotated test set. None is calibrated yet, so no band is shown.
What counts as a claim ›How we measure confidence ›How we check this ›
Are you an author, or do you see a problem with this page? Request a review
