Cited by 207Neurogenesis and neuroplasticity mechanismsMicroRNA in disease regulationFOXO transcription factor regulation

The DOI matches its Crossref record; 108 of the 108 references it cites were found in a registry or an index.

The microRNA cluster miR-106b 25 regulates adult neural stem/progenitor cell proliferation and neuronal differentiation

Open access

Abstract

In adult mammals, neural stem cells (NSCs) generate new neurons that are important for specific types of learning and memory. Controlling adult NSC number and function is fundamental for preserving the stem cell pool and ensuring proper levels of neurogenesis throughout life. Here we study the importance of the microRNA gene cluster miR-106b~25 (miR-106b, miR-93, and miR-25) in primary cultures of neural stem/progenitor cells (NSPCs) isolated from adult mice. We find that knocking down miR-25 decreases NSPC proliferation, whereas ectopically expressing miR-25 promotes NSPC proliferation. Expressing the entire miR-106b~25 cluster in NSPCs also increases their ability to generate new neurons. Interestingly, miR-25 has a number of potential target mRNAs involved in insulin/insulin-like growth factor-1 (IGF) signaling, a pathway implicated in aging. Furthermore, the regulatory region of miR-106b~25 is bound by FoxO3, a member of the FoxO family of transcription factors that maintains adult stem cells and extends lifespan downstream of insulin/IGF signaling. These results suggest that miR-106b~25 regulates NSPC function and is part of a network involving the insulin/IGF-FoxO pathway, which may have important implications for the homeostasis of the NSC pool during aging.

Overview

The claims and statistics of this paper haven’t been checked yet.

Run the check — free, no account needed. It reads the open-access text and checks the sources it cites.

A few free checks a day · papers already verified open instantly · results are public

Integrity signals

Registry

Crossref · 10.18632/aging.100285

Cites

108 of 108 references verified0 citation errors · 0 not checkable

Statistics

Figures

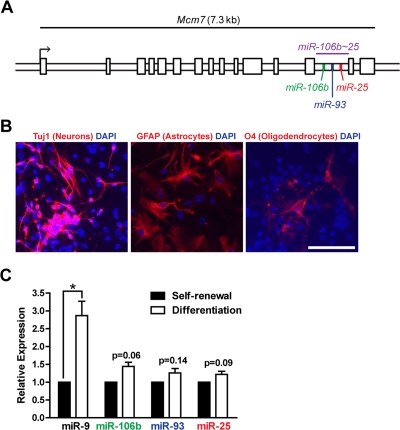
Figure 1. The miR-106b~25 cluster is expressed in adult NSPCs in culture. (A) Genomic locus of the mouse miR-106b~25 cluster and its host gene, Mcm7. (B) NSPCs (age 12 weeks, passage 2) were grown in multi-lineage differentiation conditions (no EGF or bFGF, with 1% FBS) for 7 days and then stained for Tuj1 (a marker of neurons), GFAP (a marker of astrocytes), or O4 (a marker of oligodendrocytes). Scale bar: 100 μm. (C) miRNA expression was determined by RT-qPCR in NSPCs in self-renewal conditions (with EGF and bFGF, no FBS) or differentiation conditions (no EGF or bFGF, with 1% FBS) for 4 days. Mean and SEM of gene expression relative to self-renewal conditions for 3 independent NSPC cultures (age 12 weeks, passage 2) are shown. One-sample two-tailed t-test, *: p<0.05.
Figure 1. The miR-106b~25 cluster is expressed in adult NSPCs in culture. (A) Genomic locus of the mouse miR-106b~25 cluster and its host gene, Mcm7. (B) NSPCs (age 12 weeks, passage 2) were grown in multi-lineage differentiation conditions (no EGF or bFGF, with 1% FBS) for 7 days and then stained for Tuj1 (a marker of neurons), GFAP (a marker of astrocytes), or O4 (a marker of oligodendrocytes). Scale bar: 100 μm. (C) miRNA expression was determined by RT-qPCR in NSPCs in self-renewal conditions (with EGF and bFGF, no FBS) or differentiation conditions (no EGF or bFGF, with 1% FBS) for 4 days. Mean and SEM of gene expression relative to self-renewal conditions for 3 independent NSPC cultures (age 12 weeks, passage 2) are shown. One-sample two-tailed t-test, *: p<0.05.CC BY · PubMed Central
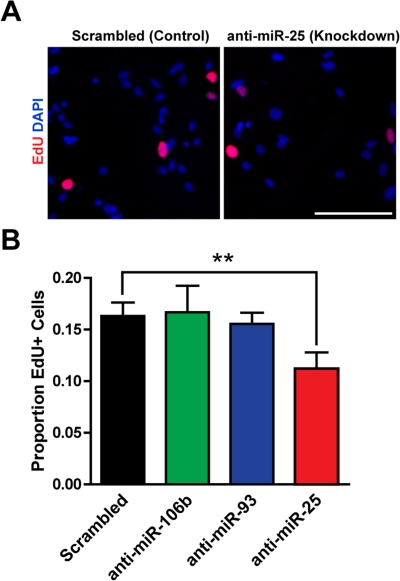
Figure 2. miR-25 is necessary for adult NSPC prolifer-ation. NSPCs were transfected to knock down miR-106b, miR-93, or miR-25 or were transfected with a scrambled control oligonucleotide. Two days after transfection, NSPCs were incubated with EdU for 1 hour and then immediately fixed for analysis. (A) Representative photos for control knockdown and miR-25 knockdown. Scale bar: 100 μm. (B) Mean and SEM of the proportion of EdU+ cells for each condition, for experiments on 5 independent NSPC cultures (age 8-14 weeks, passage 3-7). Paired two-tailed t-test, **: p<0.01.
Figure 2. miR-25 is necessary for adult NSPC prolifer-ation. NSPCs were transfected to knock down miR-106b, miR-93, or miR-25 or were transfected with a scrambled control oligonucleotide. Two days after transfection, NSPCs were incubated with EdU for 1 hour and then immediately fixed for analysis. (A) Representative photos for control knockdown and miR-25 knockdown. Scale bar: 100 μm. (B) Mean and SEM of the proportion of EdU+ cells for each condition, for experiments on 5 independent NSPC cultures (age 8-14 weeks, passage 3-7). Paired two-tailed t-test, **: p<0.01.CC BY · PubMed Central
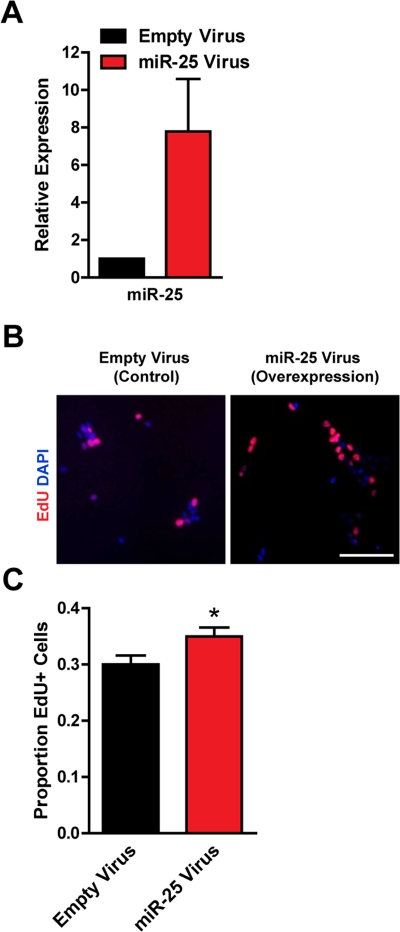
Figure 3. Expression of miR-25 enhances adult NSPC proliferation. NSPCs were infected with an empty control retrovirus (expressing a GFP marker only) or a retrovirus expressing miR-25. NSPCs were grown to full neurospheres for about 1 week after infection before miRNA expression and proliferation were analyzed. (A) miR-25 expression was assessed with RT-qPCR in control versus miR-25-overexpressing NSPCs. Mean and SEM of 2 independent NSPC cultures (age 12 weeks, passage 2-5) are shown. (B) Representative photos for each condition. Scale bar: 100 μm. (C) Control and miR-25-overexpressing NSPCs were dissociated and incubated with EdU for 1 hour. Mean and SEM of the proportion of EdU+ cells for each condition, for experiments on 4 independent NSPC cultures (age 12 weeks, passage 3-6), are shown. Paired two-tailed t-test, *: p<0.05.
Figure 3. Expression of miR-25 enhances adult NSPC proliferation. NSPCs were infected with an empty control retrovirus (expressing a GFP marker only) or a retrovirus expressing miR-25. NSPCs were grown to full neurospheres for about 1 week after infection before miRNA expression and proliferation were analyzed. (A) miR-25 expression was assessed with RT-qPCR in control versus miR-25-overexpressing NSPCs. Mean and SEM of 2 independent NSPC cultures (age 12 weeks, passage 2-5) are shown. (B) Representative photos for each condition. Scale bar: 100 μm. (C) Control and miR-25-overexpressing NSPCs were dissociated and incubated with EdU for 1 hour. Mean and SEM of the proportion of EdU+ cells for each condition, for experiments on 4 independent NSPC cultures (age 12 weeks, passage 3-6), are shown. Paired two-tailed t-test, *: p<0.05.CC BY · PubMed Central
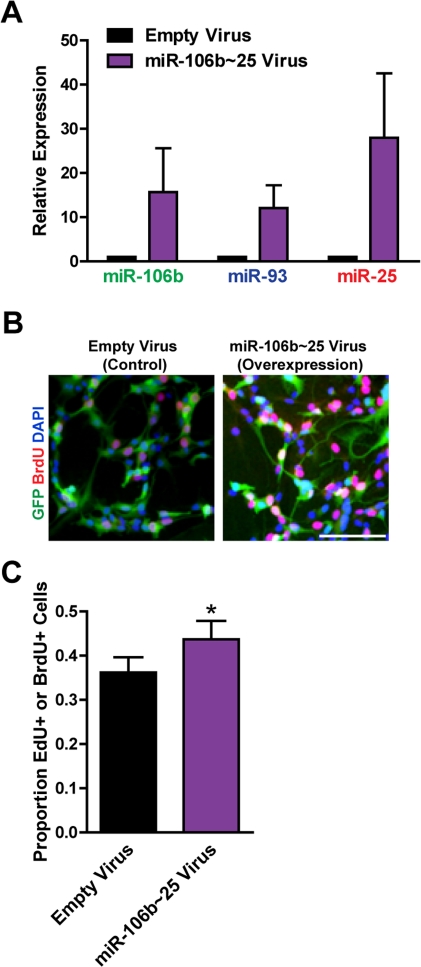
Figure 4. Expression of the entire miR-106b~25 cluster also enhances adult NSPC proliferation. NSPCs were infected with an empty control retrovirus (expressing a GFP marker only) or a retrovirus expressing miR-106b, miR-93, and miR-25 simultaneously (miR-106b~25). NSPCs were grown to full neurospheres for about 1 week after infection before miRNA expression and proliferation were analyzed. (A) miR-106b, miR-93, and miR-25 expression was assessed with RT-qPCR in control versus miR-106b~25-overexpressing NSPCs. Mean and SEM of 4 independent NSPC cultures (age 12-14 weeks, passage 5-14) are shown. (B) Representative photos for each condition. Scale bar: 100 μm. (C) Control and miR-106b~25-overexpressing NSPCs were dissociated and incubated with EdU or BrdU for 1 hour. Mean and SEM of the proportion of EdU+ or BrdU+ cells for each condition, for 6 experiments on independent NSPC cultures (age 12-14 weeks, passage 3-14), are shown. Paired two-tailed t-test, *: p<0.05.
Figure 4. Expression of the entire miR-106b~25 cluster also enhances adult NSPC proliferation. NSPCs were infected with an empty control retrovirus (expressing a GFP marker only) or a retrovirus expressing miR-106b, miR-93, and miR-25 simultaneously (miR-106b~25). NSPCs were grown to full neurospheres for about 1 week after infection before miRNA expression and proliferation were analyzed. (A) miR-106b, miR-93, and miR-25 expression was assessed with RT-qPCR in control versus miR-106b~25-overexpressing NSPCs. Mean and SEM of 4 independent NSPC cultures (age 12-14 weeks, passage 5-14) are shown. (B) Representative photos for each condition. Scale bar: 100 μm. (C) Control and miR-106b~25-overexpressing NSPCs were dissociated and incubated with EdU or BrdU for 1 hour. Mean and SEM of the proportion of EdU+ or BrdU+ cells for each condition, for 6 experiments on independent NSPC cultures (age 12-14 weeks, passage 3-14), are shown. Paired two-tailed t-test, *: p<0.05.CC BY · PubMed Central
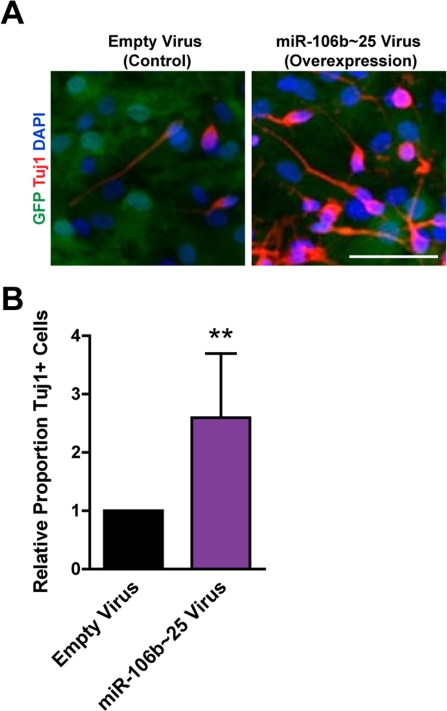
Figure 5. miR-106b~25 enhances neurogenesis in culture. NSPCs were infected with an empty control virus or virus to overexpress miR-106b~25. Three days after infection, NSPCs were placed in differentiation conditions for 7 days, and then stained for Tuj1, a marker of neurons. (A) Representative photos for each condition. Scale bar: 50 μm. (B) Mean and SEM of the proportion of Tuj1+ cells (total Tuj1+ cells/total DAPI-stained nuclei) normalized to control infection, for experiments on 4 independent NSPC cultures (age 12 weeks, passage 2), are shown. Paired two-tailed t-test, **: p<0.01.
Figure 5. miR-106b~25 enhances neurogenesis in culture. NSPCs were infected with an empty control virus or virus to overexpress miR-106b~25. Three days after infection, NSPCs were placed in differentiation conditions for 7 days, and then stained for Tuj1, a marker of neurons. (A) Representative photos for each condition. Scale bar: 50 μm. (B) Mean and SEM of the proportion of Tuj1+ cells (total Tuj1+ cells/total DAPI-stained nuclei) normalized to control infection, for experiments on 4 independent NSPC cultures (age 12 weeks, passage 2), are shown. Paired two-tailed t-test, **: p<0.01.CC BY · PubMed Central
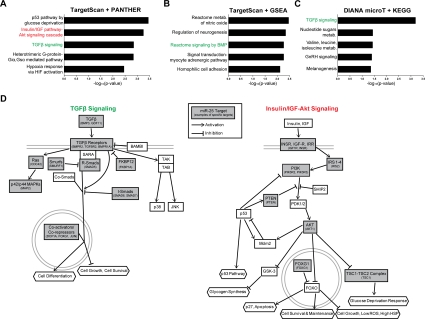
Figure 6. miR-25 targets genes involved in TGFβ and insulin/IGF signaling. (A) The PANTHER gene classification program was used to analyze TargetScan-predicted conserved targets for mouse miR-25 (~600 targets total). Shown are the top 5 biological pathways (ordered by Bonferroni-corrected binomial test p-values). (B) The GSEA program was used to analyze the same TargetScan-predicted target list as in (A), using the Canonical Pathways and GO Gene Sets categories. Shown are the top 5 categories (ordered by hypergeometric distribution-generated p-values). (C) The DIANA-microT program was used to generate a stringent list of mouse miR-25 targets. Shown are the top KEGG categories (ordered by Pearson's chi-square test p-values). (D) Pathway diagrams based on those in PANTHER Pathways for TGFβ and insulin/IGF-Akt signaling pathways, modified for simplicity and with select miR-25 predicted targets listed.
Figure 6. miR-25 targets genes involved in TGFβ and insulin/IGF signaling. (A) The PANTHER gene classification program was used to analyze TargetScan-predicted conserved targets for mouse miR-25 (~600 targets total). Shown are the top 5 biological pathways (ordered by Bonferroni-corrected binomial test p-values). (B) The GSEA program was used to analyze the same TargetScan-predicted target list as in (A), using the Canonical Pathways and GO Gene Sets categories. Shown are the top 5 categories (ordered by hypergeometric distribution-generated p-values). (C) The DIANA-microT program was used to generate a stringent list of mouse miR-25 targets. Shown are the top KEGG categories (ordered by Pearson's chi-square test p-values). (D) Pathway diagrams based on those in PANTHER Pathways for TGFβ and insulin/IGF-Akt signaling pathways, modified for simplicity and with select miR-25 predicted targets listed.CC BY · PubMed Central
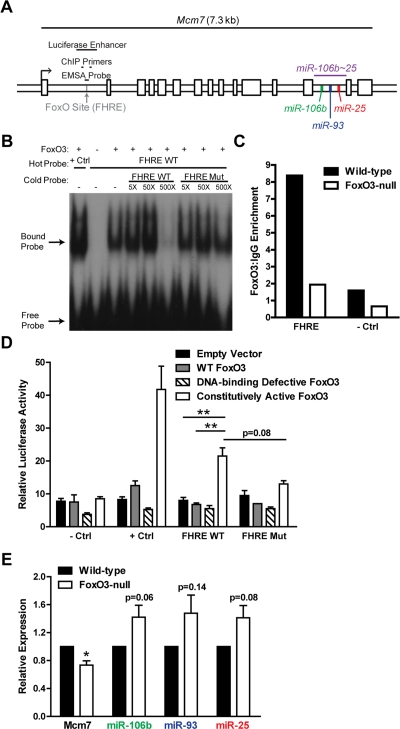
Figure 7. FoxO3 binds to a site in the first intron of miR-106b~25/Mcm7. (A) Location of the FoxO binding site (FHRE) within the first intron of the miR-106b~25/Mcm7 gene, and the sequence locations used for EMSA, ChIP, and luciferase experiments. (B) EMSA with recombinant FoxO3-GST and a radioactively-labeled (hot) probe corresponding to the FoxO binding site in miR-106b~25/Mcm7 (FHRE WT). + Ctrl: FoxO3-GST incubated with a probe for a known FoxO binding site. The specificity of the interaction was tested by increasing amounts of unlabeled (cold) probe or cold probe with mutations in the FoxO consensus binding sequence (FHRE Mut). (C) Wild-type and FoxO3-null NSPCs were dissociated and the next day treated with 4 hours growth factor removal followed by addition of LY294002 for 1 hour. Antibodies to FoxO3 or control IgG antibodies were used for ChIP. qPCR was used to assess the enrichment of FHRE and of a negative control site (- Ctrl). Shown is the relative enrichment for 1 experiment (age 12 weeks, passage 10). These results were confirmed in ChIP-Seq studies (Webb et al. submitted). (D) HEK 293T cells were co-transfected with a plasmid to express FoxO3 (empty control, wild-type FoxO3, FoxO3 lacking the DNA binding domain, or constitutively nuclear FoxO3), a firefly luciferase reporter containing FHRE with or without the FoxO consensus sequence mutated, and a Renilla luciferase reporter to normalize for transfection efficiency. As a positive control, a luciferase reporter containing a known FoxO3-activated site was used (+ Ctrl); as a negative control, a luciferase reporter without an enhancer site was used (- Ctrl). Luciferase activity was assessed two days after transfection. Mean and SEM for 4 independent experiments (- Ctrl, + Ctrl, and FHRE WT) or 2 independent experiments (FHRE Mut) are shown. Unpaired two-tailed t-test, **: p<0.01. (E) NSPCs from wild-type and FoxO3-null mice were isolated and cultured. Total RNA was collected, and the levels of mature miR-106b~25 members (relative to 5S RNA) and Mcm7 mRNA (relative to β-actin mRNA) were assessed by RT-qPCR. Mean and SEM of the FoxO3-null/wild-type fold change for 5-6 independent cultures (age 10-13 weeks, passage 2-5) are shown. One-sample two-tailed t-test, *: p<0.05.
Figure 7. FoxO3 binds to a site in the first intron of miR-106b~25/Mcm7. (A) Location of the FoxO binding site (FHRE) within the first intron of the miR-106b~25/Mcm7 gene, and the sequence locations used for EMSA, ChIP, and luciferase experiments. (B) EMSA with recombinant FoxO3-GST and a radioactively-labeled (hot) probe corresponding to the FoxO binding site in miR-106b~25/Mcm7 (FHRE WT). + Ctrl: FoxO3-GST incubated with a probe for a known FoxO binding site. The specificity of the interaction was tested by increasing amounts of unlabeled (cold) probe or cold probe with mutations in the FoxO consensus binding sequence (FHRE Mut). (C) Wild-type and FoxO3-null NSPCs were dissociated and the next day treated with 4 hours growth factor removal followed by addition of LY294002 for 1 hour. Antibodies to FoxO3 or control IgG antibodies were used for ChIP. qPCR was used to assess the enrichment of FHRE and of a negative control site (- Ctrl). Shown is the relative enrichment for 1 experiment (age 12 weeks, passage 10). These results were confirmed in ChIP-Seq studies (Webb et al. submitted). (D) HEK 293T cells were co-transfected with a plasmid to express FoxO3 (empty control, wild-type FoxO3, FoxO3 lacking the DNA binding domain, or constitutively nuclear FoxO3), a firefly luciferase reporter containing FHRE with or without the FoxO consensus sequence mutated, and a Renilla luciferase reporter to normalize for transfection efficiency. As a positive control, a luciferase reporter containing a known FoxO3-activated site was used (+ Ctrl); as a negative control, a luciferase reporter without an enhancer site was used (- Ctrl). Luciferase activity was assessed two days after transfection. Mean and SEM for 4 independent experiments (- Ctrl, + Ctrl, and FHRE WT) or 2 independent experiments (FHRE Mut) are shown. Unpaired two-tailed t-test, **: p<0.01. (E) NSPCs from wild-type and FoxO3-null mice were isolated and cultured. Total RNA was collected, and the levels of mature miR-106b~25 members (relative to 5S RNA) and Mcm7 mRNA (relative to β-actin mRNA) were assessed by RT-qPCR. Mean and SEM of the FoxO3-null/wild-type fold change for 5-6 independent cultures (age 10-13 weeks, passage 2-5) are shown. One-sample two-tailed t-test, *: p<0.05.CC BY · PubMed Central

Verification

Claims the paper makes

The claims and statistics of this paper haven’t been checked yet.

Run the check — free, no account needed. It reads the open-access text and checks the sources it cites.

A few free checks a day · papers already verified open instantly · results are public

Claims other papers make about this one

Each is checked against this paper’s own text: does it say what the citing paper says it does?

Self-check

Percentages, sums and reported differences re-computed from the paper’s own numbers.

The self-check needs the paper’s full text.

Citations

Cites

1 retracted

Show all 108 references

Cited by

Sorted by citations

See all 207

Metadata

Authors
Brett, J. O., Renault, V. M., Rafalski, V. A., Webb, A. E., & Brunet, A.
Affiliations
Stanford Medicine (US)
Corresponding author
Brunet, Anne
Venue
Aging
Published
2011-02-20
Volume
3
Issue
2
Pages
108-124
ISSN
1945-4589 (ISSN-L)
OpenAlex
W2131928928
Cited by
207
References
108
Citations by year
2026: 2 · 2025: 6 · 2024: 7 · 2023: 5 · 2022: 6 · 2021: 6 · 2020: 14 · 2019: 21 · 2018: 20 · 2017: 14 · 2016: 15 · 2015: 19 · 2014: 18 · 2013: 29 · 2012: 17
FWCI
7.56
Type
journal article
Language
en
Open access
Licence
cc-by
Locations
  • Aging (publishedVersion, cc-by)
  • Europe PMC (PubMed Central) (publishedVersion, cc-by)
  • PubMed Central (publishedVersion, cc-by)
  • PubMed (publishedVersion)
Funders
  • National Science Foundation (CA09302)
  • National Institutes of Health (CA09302)
  • National Institute on Aging (R01AG026648, P01AG036695)
  • National Cancer Institute (5 T32 CA09302, T32CA009302)
Topics
  • Life Sciences › Neuroscience › Developmental Neuroscience › Neurogenesis and neuroplasticity mechanisms
  • Life Sciences › Biochemistry, Genetics and Molecular Biology › Cancer Research › MicroRNA in disease regulation
  • Life Sciences › Biochemistry, Genetics and Molecular Biology › Molecular Biology › FOXO transcription factor regulation
Keywords
miR-25, miR-93, neural stem/progenitor cells, cell proliferation, neuronal differentiation, adult neurogenesis, insulin/IGF-1 signaling, FOXO3, stem cell homeostasis, microRNA regulation
MeSH terms
Forkhead Box Protein O3, Animals, Cell Differentiation, Cells, Cultured, Multigene Family, Insulin, Signal Transduction, Transforming Growth Factor beta, MicroRNAs, Cell Proliferation, Mice, Forkhead Transcription Factors, Neurogenesis, Neural Stem Cells

About these checks

Registry, retraction, Cites and statistics results are computed, not judged, with one exception: a printed reference that no index lists is read once by a model before it counts as a citation error. Claims are extracted by a model and kept only when their quote appears verbatim in the text; each cited source is then checked, with a model’s help, for whether it says what the claim relies on. Those verdicts can be wrong — read the claim’s quote and the cited source before relying on one.

Statistics and arithmetic are recomputed, not judged.

Confidence bands are shown only for fields calibrated on our annotated test set. None is calibrated yet, so no band is shown.

What counts as a claim ›How we measure confidence ›How we check this ›

Are you an author, or do you see a problem with this page? Request a review