

The DOI matches its Crossref record; 50 of the 50 references it cites were found in a registry or an index.
Two doses of SARS-CoV-2 vaccination induce more robust immune responses to emerging SARS-CoV-2 variants of concern than does natural infection.
Open accessPreprint — published as 10.1038/s41467-021-25167-5
Abstract
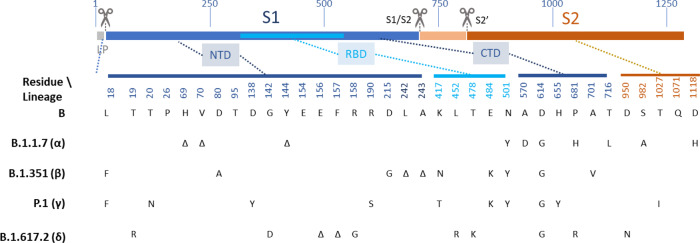
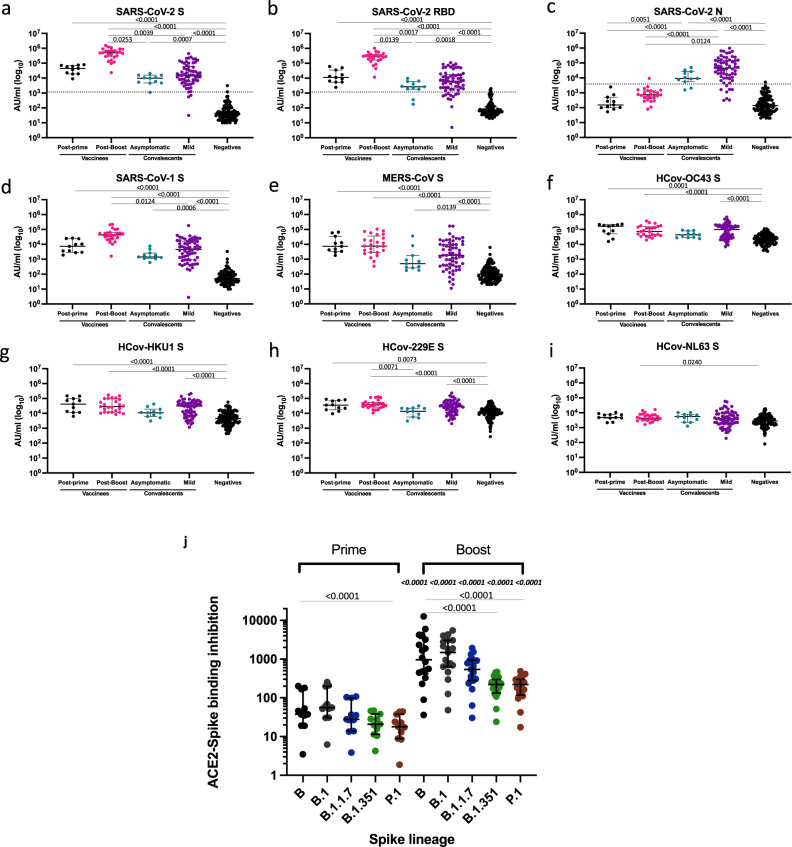
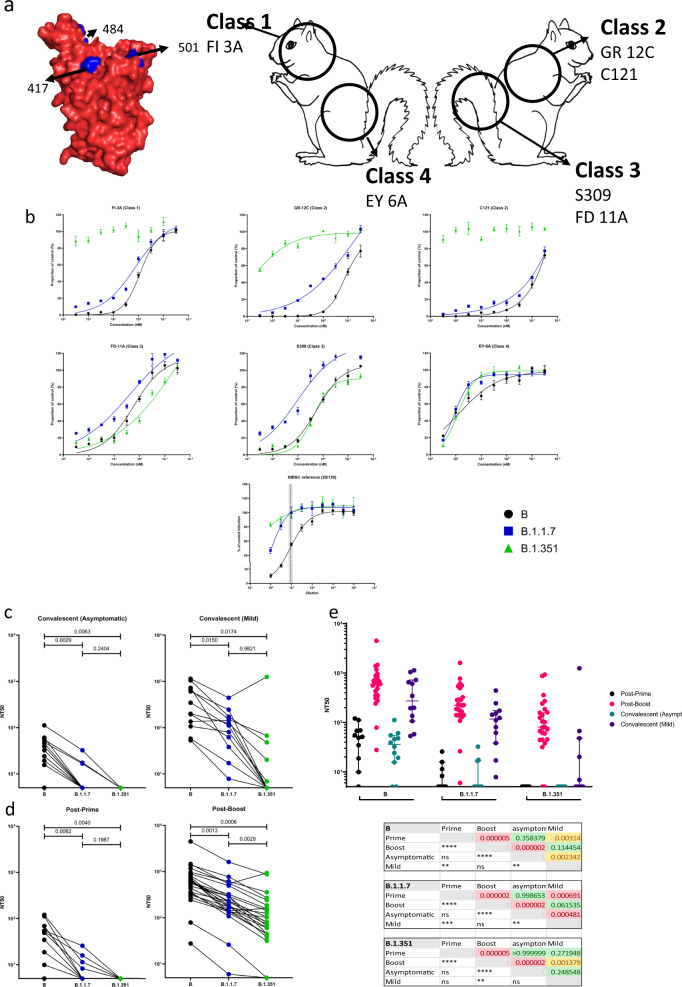
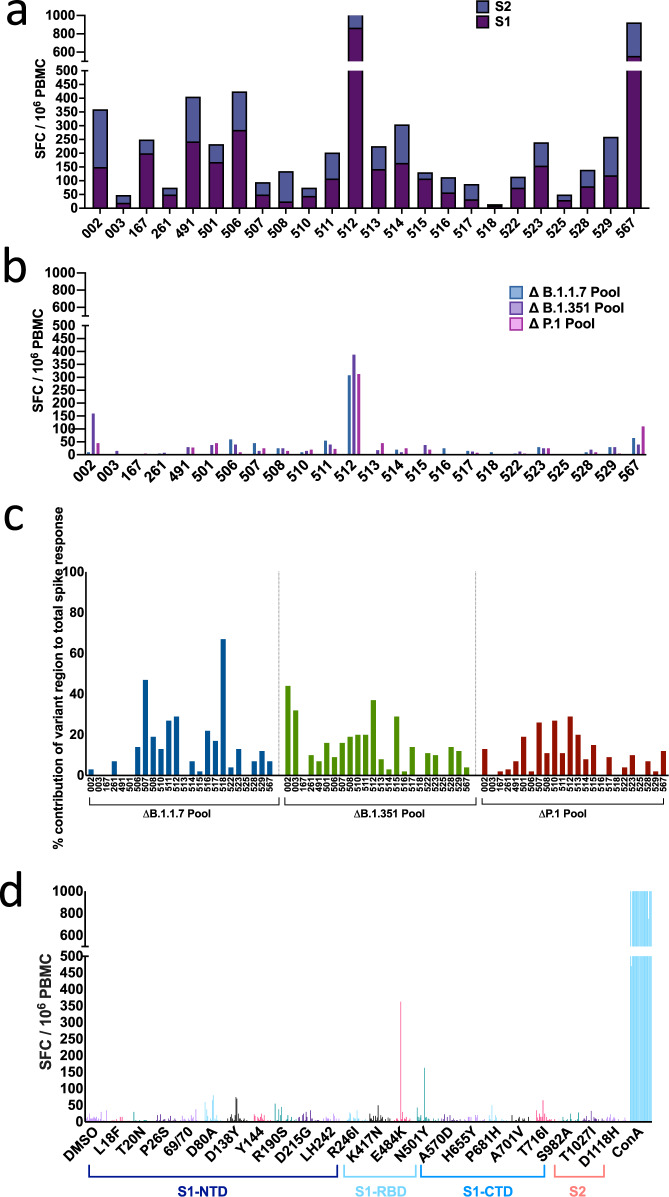
Both natural infection with SARS-CoV-2 and immunization with vaccines induce protective immunity. However, the extent to which such immune responses protect against emerging variants is of increasing importance. Such variants of concern (VOC) include isolates of lineage B.1.1.7, first identified in the UK, and B.1.351, first identified in South Africa. Our data confirm that VOC, particularly those with substitutions at residues 484 and 417, escape neutralization by antibodies directed to the ACE2-binding Class 1 and the adjacent Class 2 epitopes but are susceptible to neutralization by the generally less potent antibodies directed to Class 3 and 4 epitopes on the flanks of the receptor-binding domain. To address the potential threat posed by VOC, we sampled a SARS-CoV-2 uninfected UK cohort recently vaccinated with BNT162b2 (Pfizer-BioNTech, two doses delivered 18-28 days apart), alongside a cohort sampled in the early convalescent stages after natural infection in the first wave of the pandemic in Spring 2020. We tested antibody and T cell responses against a reference isolate of the original circulating lineage, B, and the impact of sequence variation in the B.1.1.7 and B.1.351 VOC. Neutralization of the VOC compared to B isolate was reduced, and this was most evident for the B.1.351 isolate. This reduction in antibody neutralization was less marked in post-boost vaccine-induced responses compared to naturally induced immune responses and could be largely explained by the potency of the homotypic antibody response. After a single vaccination, which induced only modestly neutralizing homotypic antibody titres, neutralization against the VOC was completely abrogated in the majority of vaccinees. Importantly, high magnitude T cell responses were generated after two vaccine doses, with the majority of the T cell response directed against epitopes that are conserved between the prototype isolate B and the VOC. These data indicate that VOC may evade protective neutralizing responses induced by prior infection, and to a lesser extent by immunization, particularly after a single vaccine dose, but the impact of the VOC on T cell responses appears less marked. The results emphasize the need to generate high potency immune responses through vaccination in order to provide protection against these and other emergent variants.
Overview
The claims and statistics of this paper haven’t been checked yet.
Run the check — free, no account needed. It reads the open-access text and checks the sources it cites.
Integrity signals
Registry
Cites
Statistics
Figures
Verification
Claims the paper makes
The claims and statistics of this paper haven’t been checked yet.
Run the check — free, no account needed. It reads the open-access text and checks the sources it cites.
Claims other papers make about this one
Each is checked against this paper’s own text: does it say what the citing paper says it does?
In the citing paper
“Concerning vaccination responses, the AstraZeneca ChAdOx1 vaccine has been associated with a partial loss of neutralizing antibody activity against B.1.1.715 and a large loss of neutralizing activity against B.1.351.26”
From Impact of SARS-CoV-2 variants on the total CD4+ and CD8+ T cell reactivity in infected or vaccinated individuals (2021) · cites this paper as [15]
In the citing paper
“In general, the impact of B.1.1.7 mutations on neutralizing antibody titers is moderate.15, 16, 17, 18,20,24”
From Impact of SARS-CoV-2 variants on the total CD4+ and CD8+ T cell reactivity in infected or vaccinated individuals (2021) · cites this paper as [15]
In the citing paper
“In contrast, mutations in B.1.351 and P.1 variants are associated with the more pronounced loss of neutralizing capacity.15,16,22,23,25”
From Impact of SARS-CoV-2 variants on the total CD4+ and CD8+ T cell reactivity in infected or vaccinated individuals (2021) · cites this paper as [15]
Self-check
Percentages, sums and reported differences re-computed from the paper’s own numbers.
The self-check needs the paper’s full text.
Citations
Cites
Safety and Efficacy of the BNT162b2 mRNA Covid-19 Vaccine
Polack, F. P., Thomas, S. J., Kitchin, N., Absalon, J., Gurtman, A., Lockhart, S., Perez, J. L., Pérez Marc, G., Moreira, E. D., Zerbini, C., et al. (2020) · New England Journal of Medicine · doi:10.1056/nejmoa2034577 · Cited by 14,592
Efficacy and Safety of the mRNA-1273 SARS-CoV-2 Vaccine
Baden, L. R., El Sahly, H. M., Essink, B., Kotloff, K., Frey, S., Novak, R., Diemert, D., Spector, S. A., Rouphael, N., Creech, C. B., et al. (2021) · New England Journal of Medicine · doi:10.1056/nejmoa2035389 · Cited by 10,119
Grifoni, A., Weiskopf, D., Ramirez, S. I., Mateus, J., Dan, J. M., Moderbacher, C. R., Rawlings, S. A., Sutherland, A., Premkumar, L., Jadi, R. S., et al. (2020) · Cell · doi:10.1016/j.cell.2020.05.015 · Cited by 3,595
Immunological memory to SARS-CoV-2 assessed for up to 8 months after infection.
Dan, J. M., Mateus, J., Kato, Y., Hastie, K. M., Yu, E. D., Faliti, C. E., Grifoni, A., Ramirez, S. I., Haupt, S., Frazier, A., et al. (2021) · Science · doi:10.1126/science.abf4063 · Cited by 2,656
Tegally, H., Wilkinson, E., Giovanetti, M., Iranzadeh, A., Fonseca, V., Giandhari, J., Doolabh, D., Pillay, S., San, E. J., Msomi, N., et al. (2020) · doi:10.1101/2020.12.21.20248640 · Cited by 2,535
Self-citationDetection of a SARS-CoV-2 variant of concern in South Africa
Tegally, H., Wilkinson, E., Giovanetti, M., Iranzadeh, A., Fonseca, V., Giandhari, J., Doolabh, D., Pillay, S., San, E. J., Msomi, N., et al. (2021) · Nature · doi:10.1038/s41586-021-03402-9 · Cited by 2,510
Self-citationFolegatti, P. M., Ewer, K. J., Aley, P. K., Angus, B., Becker, S., Belij-Rammerstorfer, S., Bellamy, D., Bibi, S., Bittaye, M., Clutterbuck, E. A., et al. (2020) · The Lancet · doi:10.1016/s0140-6736(20)31604-4 · Cited by 2,419
Self-citationStarr, T. N., Greaney, A. J., Hilton, S. K., Ellis, D., Crawford, K. H. D., Dingens, A. S., Navarro, M. J., Bowen, J. E., Tortorici, M. A., Walls, A. C., et al. (2020) · Cell · doi:10.1016/j.cell.2020.08.012 · Cited by 1,956
Cross-neutralization of SARS-CoV-2 by a human monoclonal SARS-CoV antibody
Pinto, D., Park, Y.-J., Beltramello, M., Walls, A. C., Tortorici, M. A., Bianchi, S., Jaconi, S., Culap, K., Zatta, F., De Marco, A., et al. (2020) · Nature · doi:10.1038/s41586-020-2349-y · Cited by 1,885
Convergent Antibody Responses to SARS-CoV-2 in Convalescent Individuals
Robbiani, D. F., Gaebler, C., Muecksch, F., Lorenzi, J. C. C., Wang, Z., Cho, A., Agudelo, M., Barnes, C. O., Gazumyan, A., Finkin, S., et al. (2020) · Nature · doi:10.1038/s41586-020-2456-9 · Cited by 1,853
Logunov, D. Y., Dolzhikova, I. V., Shcheblyakov, D. V., Tukhvatulin, A. I., Zubkova, O. V., Dzharullaeva, A. S., Kovyrshina, A. V., Lubenets, N. L., Grousova, D. M., Erokhova, A. S., et al. (2021) · The Lancet · doi:10.1016/s0140-6736(21)00234-8 · Cited by 1,747
Zhang, Y., Zeng, G., Pan, H., Li, C., Hu, Y., Chu, K., Han, W., Chen, Z., Tang, R., Yin, W., et al. (2021) · The Lancet Infectious Diseases · doi:10.1016/s1473-3099(20)30843-4 · Cited by 1,504
mRNA vaccine-elicited antibodies to SARS-CoV-2 and circulating variants
Wang, Z., Schmidt, F., Weisblum, Y., Muecksch, F., Barnes, C. O., Finkin, S., Schaefer-Babajew, D., Cipolla, M., Gaebler, C., Lieberman, J. A., et al. (2021) · Nature · doi:10.1038/s41586-021-03324-6 · Cited by 1,343
Efficacy of the ChAdOx1 nCoV-19 Covid-19 Vaccine against the B.1.351 Variant
Madhi, S. A., Baillie, V., Cutland, C. L., Voysey, M., Koen, A. L., Fairlie, L., Padayachee, S. D., Dheda, K., Barnabas, S. L., Bhorat, Q. E., et al. (2021) · New England Journal of Medicine · doi:10.1056/nejmoa2102214 · Cited by 1,257
Self-citationPeng, Y., Mentzer, A. J., Liu, G., Yao, X., Yin, Z., Dong, D., Dejnirattisai, W., Rostron, T., Supasa, P., Liu, C., et al. (2020) · Nature Immunology · doi:10.1038/s41590-020-0782-6 · Cited by 1,179
Self-citationSARS-CoV-2 501Y.V2 escapes neutralization by South African COVID-19 donor plasma
Wibmer, C. K., Ayres, F., Hermanus, T., Madzivhandila, M., Kgagudi, P., Oosthuysen, B., Lambson, B. E., de Oliveira, T., Vermeulen, M., van der Berg, K., et al. (2021) · Nature Medicine · doi:10.1038/s41591-021-01285-x · Cited by 1,147
Correlates of Protection Against SARS-CoV-2 in Rhesus Macaques
McMahan, K., Yu, J., Mercado, N. B., Loos, C., Tostanoski, L. H., Chandrashekar, A., Liu, J., Peter, L., Atyeo, C., Zhu, A., et al. (2021) · Nature · doi:10.1038/s41586-020-03041-6 · Cited by 1,068
Viral targets for vaccines against COVID-19
Dai, L., & Gao, G. F. (2020) · Nature reviews. Immunology · doi:10.1038/s41577-020-00480-0 · Cited by 1,056
DNA vaccine protection against SARS-CoV-2 in rhesus macaques
Yu, J., Tostanoski, L. H., Peter, L., Mercado, N. B., McMahan, K., Mahrokhian, S. H., Nkolola, J. P., Liu, J., Li, Z., Chandrashekar, A., et al. (2020) · Science · doi:10.1126/science.abc6284 · Cited by 997
Wilkinson, T. M., Li, C. K. F., Chui, C. S. C., Huang, A. K. Y., Perkins, M., Liebner, J. C., Lambkin-Williams, R., Gilbert, A., Oxford, J., Nicholas, B., et al. (2012) · Nature Medicine · doi:10.1038/nm.2612 · Cited by 974
Antibody Status and Incidence of SARS-CoV-2 Infection in Health Care Workers
Lumley, S. F., O’Donnell, D., Stoesser, N. E., Matthews, P. C., Howarth, A., Hatch, S. B., Marsden, B. D., Cox, S., James, T., Warren, F., et al. (2021) · New England Journal of Medicine · doi:10.1056/nejmoa2034545 · Cited by 940
Self-citationCellular immune correlates of protection against symptomatic pandemic influenza
Sridhar, S., Begom, S., Bermingham, A., Hoschler, K., Adamson, W., Carman, W., Bean, T., Barclay, W., Deeks, J. J., & Lalvani, A. (2013) · Nature Medicine · doi:10.1038/nm.3350 · Cited by 862
Barnes, C. O., West, A. P., Huey-Tubman, K. E., Hoffmann, M. A. G., Sharaf, N. G., Hoffman, P. R., Koranda, N., Gristick, H. B., Gaebler, C., Muecksch, F., et al. (2020) · Cell · doi:10.1016/j.cell.2020.06.025 · Cited by 795
Single-Shot Ad26 Vaccine Protects Against SARS-CoV-2 in Rhesus Macaques
Mercado, N. B., Zahn, R., Wegmann, F., Loos, C., Chandrashekar, A., Yu, J., Liu, J., Peter, L., McMahan, K., Tostanoski, L. H., et al. (2020) · Nature · doi:10.1038/s41586-020-2607-z · Cited by 789
Sensitivity of SARS-CoV-2 B.1.1.7 to mRNA vaccine-elicited antibodies
Collier, D. A., De Marco, A., Ferreira, I. A. T. M., Meng, B., Datir, R. P., Walls, A. C., Kemp, S. A., Bassi, J., Pinto, D., Silacci-Fregni, C., et al. (2021) · Nature · doi:10.1038/s41586-021-03412-7 · Cited by 728
Tarke, A., Sidney, J., Methot, N., Yu, E. D., Zhang, Y., Dan, J. M., Goodwin, B., Rubiro, P., Sutherland, A., Wang, E., et al. (2021) · Cell Reports Medicine · doi:10.1016/j.xcrm.2021.100355 · Cited by 706
Reduced neutralization of SARS-CoV-2 B.1.617 by vaccine and convalescent serum
Liu, C., Ginn, H. M., Dejnirattisai, W., Supasa, P., Wang, B., Tuekprakhon, A., Nutalai, R., Zhou, D., Mentzer, A. J., Zhao, Y., et al. (2021) · Cell · doi:10.1016/j.cell.2021.06.020 · Cited by 669
Self-citationEscape of SARS-CoV-2 501Y.V2 from neutralization by convalescent plasma
Cele, S., Gazy, I., Jackson, L., Hwa, S.-H., Tegally, H., Lustig, G., Giandhari, J., Pillay, S., Wilkinson, E., Naidoo, Y., et al. (2021) · doi:10.1101/2021.01.26.21250224 · Cited by 651
Self-citationEscape of SARS-CoV-2 501Y.V2 from neutralization by convalescent plasma
Network for Genomic Surveillance in South Africa, Cele, S., COMMIT-KZN Team, Gazy, I., Jackson, L., Hwa, S.-H., Tegally, H., Lustig, G., Giandhari, J., Pillay, S., et al. (2021) · Nature · doi:10.1038/s41586-021-03471-w · Cited by 651
Self-citationter Meulen, J., van den Brink, E. N., Poon, L. L. M., Marissen, W. E., Leung, C. S.-W., Cox, F., Cheung, C. Y., Bakker, A. Q., Bogaards, J. A., van Deventer, E., et al. (2006) · PLoS Medicine · doi:10.1371/journal.pmed.0030237 · Cited by 599
Neutralizing Activity of BNT162b2-Elicited Serum
Liu, Y., Liu, J., Xia, H., Zhang, X., Fontes-Garfias, C. R., Swanson, K. A., Cai, H., Sarkar, R., Chen, W., Cutler, M., et al. (2021) · New England Journal of Medicine · doi:10.1056/nejmc2102017 · Cited by 537
Neutralization of SARS-CoV-2 lineage B.1.1.7 pseudovirus by BNT162b2 vaccine–elicited human sera
Muik, A., Wallisch, A.-K., Sänger, B., Swanson, K. A., Mühl, J., Chen, W., Cai, H., Maurus, D., Sarkar, R., Türeci, Ö., et al. (2021) · Science · doi:10.1126/science.abg6105 · Cited by 515
Barrett, J. R., Belij-Rammerstorfer, S., Dold, C., Ewer, K. J., Folegatti, P. M., Gilbride, C., Halkerston, R., Hill, J., Jenkin, D., Stockdale, L., et al. (2021) · Nature Medicine · doi:10.1038/s41591-020-01179-4 · Cited by 315
Self-citationCaly, L., Druce, J. D., Roberts, J., Bond, K. A., Tran, T., Kostecki, R., Yoga, Y., Naughton, W., Taiaroa, G., Seemann, T., et al. (2020) · The Medical Journal of Australia · doi:10.5694/mja2.50569 · Cited by 305
Covid-19: Novavax vaccine efficacy is 86% against UK variant and 60% against South African variant
Mahase, E. (2021) · BMJ · doi:10.1136/bmj.n296 · Cited by 235
SARS-CoV-2 evolution and vaccines: cause for concern?
Williams, T., & Burgers, W. A. (2021) · The Lancet Respiratory Medicine · doi:10.1016/s2213-2600(21)00075-8 · Cited by 163
MAIT cell activation augments adenovirus vector vaccine immunogenicity
Provine, N. M., Amini, A., Garner, L. C., Spencer, A. J., Dold, C., Hutchings, C. L., Silva-Reyes, L., FitzPatrick, M. E. B., Chinnakannan, S. K., Oguti, B., et al. (2021) · Science · doi:10.1126/science.aax8819 · Cited by 132
Self-citationOgbe, A., Kronsteiner, B., Skelly, D., Pace, M. J., Brown, A., Adland, E., Adair, K., Akhter, H. D., Ali, M., Ali, S.-E., et al. (2021) · Nature Communications · doi:10.1038/s41467-021-21856-3 · Cited by 124
Self-citationModelling changes in glutathione homeostasis as a function of quinone redox metabolism
Kelly, R. A., Leedale, J., Calleja, D., Enoch, S. J., Harrell, A., Chadwick, A. E., & Webb, S. D. (2019) · Scientific Reports · doi:10.1038/s41598-019-42799-2 · Cited by 99
Modulating Antibody Functionality in Infectious Disease and Vaccination
Gunn, B. M., & Alter, G. (2016) · Trends in Molecular Medicine · doi:10.1016/j.molmed.2016.09.002 · Cited by 82
Discrete SARS-CoV-2 antibody titers track with functional humoral stability
Bartsch, Y. C., Fischinger, S., Siddiqui, S. M., Chen, Z., Yu, J., Gebre, M., Atyeo, C., Gorman, M. J., Zhu, A. L., Kang, J., et al. (2021) · Nature Communications · doi:10.1038/s41467-021-21336-8 · Cited by 82
Breadth and function of antibody response to acute SARS-CoV-2 infection in humans
Huang, K.-Y. A., Tan, T. K., Chen, T.-H., Huang, C., Harvey, R., Hussain, S., Chen, C., Harding, A. C., Gilbert‐Jaramillo, J., Liu, X., et al. (2021) · PLoS Pathogens · doi:10.1371/journal.ppat.1009352 · Cited by 67
Self-citationCorrelates of Vaccine-Induced Protection against SARS-CoV-2
Koch, T., Mellinghoff, S. C., Shamsrizi, P., Addo, M. M., & Dahlke, C. (2021) · Vaccines · doi:10.3390/vaccines9030238 · Cited by 57
Huang, K.-Y. A., Rijal, P., Jiang, H., Wang, B., Schimanski, L. M., Dong, T., Liu, Y.-M., Chang, P., Iqbal, M., Wang, M.-C., et al. (2018) · Nature Microbiology · doi:10.1038/s41564-018-0303-7 · Cited by 50
Self-citationMOCCASIN: a method for correcting for known and unknown confounders in RNA splicing analysis
Slaff, B., Radens, C. M., Jewell, P. D., Jha, A., Lahens, N. F., Grant, G. R., Thomas‐Tikhonenko, A., Lynch, K. W., & Barash, Y. (2021) · Nature Communications · doi:10.1038/s41467-021-23608-9 · Cited by 24
Gooch, K. E., Marriott, A. C., Ryan, K. A., Yeates, P., Slack, G. S., Brown, P. J., Fothergill, R., Whittaker, C. J., & Carroll, M. W. (2019) · Scientific Reports · doi:10.1038/s41598-019-38885-0 · Cited by 23
Self-citationMahase, E. (2021) · BMJ · doi:10.1136/bmj.n124 · Cited by 23
Gooch, K. E., Smith, T. R. F., Salguero, F. J., Fotheringham, S. A., Watson, R. J., Dennis, M. J., Handley, A., Humphries, H. E., Longet, S., Tipton, T., et al. (2021) · Vaccine · doi:10.1016/j.vaccine.2021.06.057 · Cited by 18
Self-citationArunachalam, P. S., Walls, A. C., Golden, N., Atyeo, C. G., Fischinger, S., Li, C., Aye, P. P., Navarro, M. J., Lai, L., Edara, V. V., et al. (2021) · bioRxiv (Cold Spring Harbor Laboratory) · doi:10.1101/2021.02.10.430696 · Cited by 15
Verkhivker, G. M., Agajanian, S., Öztaş, D. Y., & Gupta, G. (2021) · Journal of Biomolecular Structure and Dynamics · doi:10.1080/07391102.2021.1933594 · Cited by 12
Cited by
Sorted by citations
Multiple SARS-CoV-2 variants escape neutralization by vaccine-induced humoral immunity
Garcia-Beltran, W. F., Lam, E. C., St. Denis, K., Nitido, A. D., Garcia, Z. H., Hauser, B. M., Feldman, J., Pavlovic, M. N., Gregory, D. J., Poznansky, M. C., et al. (2021) · Cell · doi:10.1016/j.cell.2021.03.013 · Cited by 1,353
Self-citationThe T cell immune response against SARS-CoV-2
Moss, P. A. H. (2022) · Nature Immunology · doi:10.1038/s41590-021-01122-w · Cited by 1,243
Fiolet, T., Kherabi, Y., MacDonald, C.-J., Ghosn, J., & Peiffer-Smadja, N. (2022) · Clinical Microbiology and Infection · doi:10.1016/j.cmi.2021.10.005 · Cited by 911
Tarke, A., Sidney, J., Methot, N., Yu, E. D., Zhang, Y., Dan, J. M., Goodwin, B., Rubiro, P., Sutherland, A., Wang, E., et al. (2021) · Cell Reports Medicine · doi:10.1016/j.xcrm.2021.100355 · Cited by 706
Reduced neutralization of SARS-CoV-2 B.1.617 by vaccine and convalescent serum
Liu, C., Ginn, H. M., Dejnirattisai, W., Supasa, P., Wang, B., Tuekprakhon, A., Nutalai, R., Zhou, D., Mentzer, A. J., Zhao, Y., et al. (2021) · Cell · doi:10.1016/j.cell.2021.06.020 · Cited by 669
Self-citation
Metadata
- Authors
- Skelly, D. T., Harding, A. C., Gilbert-Jaramillo, J., Knight, M. L., Longet, S., Brown, A., Adele, S., Adland, E., Brown, H., Team, M. L., Tipton, T., Stafford, L., Johnson, S. A., Amini, A., Group, O. C., Kit Tan, T., Schimanski, L., Huang, K.-Y. A., Rijal, P., Group, P. S., Group, C.-C., Frater, J., Goulder, P., Conlon, C. P., Jeffery, K., Dold, C., Pollard, A. J., Sigal, A., de Oliveira, T., Townsend, A. R., Klenerman, P., Dunachie, S. J., Barnes, E., Carroll, M. W., & James, W. S.
- Affiliations
- University of Oxford (GB)
- Sir William Dunn School of Pathology, University of Oxford, Oxford, UK
- Public Health England, Porton Down, UK
- Centre for Human Genetics (GB)
- MRC Human Immunology Unit, MRC Weatherall Institute of Molecular Medicine, University of Oxford, UK
- Chinese Academy of Medical Sciences & Peking Union Medical College (CN)
- Tao Yuan General Hospital (TW)
- KwaZulu-Natal Research Innovation and Sequencing Platform, Durban, South Africa, 4001
- Corresponding author
- James, William S.
- ORCID
- Skelly, Donal T.
- Harding, Adam C.
- Gilbert-Jaramillo, Javier
- Knight, Michael L.
- Longet, Stephanie
- Anthony Brown
- Adele, Sandra
- Brown, Helen
- Tom Tipton
- Stafford, Lizzie
- Johnson, Síle A.
- Amini, Ali
- Kit Tan, Tiong
- Huang, Kuan-Ying A.
- Rijal, Pramila
- Frater, John
- Goulder, Philip
- Conlon, Christopher P.
- Jeffery, Katie
- Dold, Christina
- Pollard, Andrew J.
- Sigal, Alex
- de Oliveira, Tulio
- Townsend, Alain R.
- Klenerman, Paul
- Dunachie, Susanna J .
- Barnes, Eleanor
- Carroll, Miles W.
- James, William S.
- Venue
- Nature Communications
- Published
- 2021-03-29
- Volume
- 12
- Issue
- 1
- Pages
- 5061-5061
- ISSN
- 2041-1723 (ISSN-L)
- PMC
- PMC8371089
- OpenAlex
- W3193567675
- Cited by
- 216
- References
- 50
- Citations by year
- 2026: 4 · 2025: 12 · 2024: 21 · 2023: 49 · 2022: 75 · 2021: 55
- FWCI
- 15.84
- Type
- journal article
- Language
- en
- Open access
- gold
- doi.org
- Locations
- Nature Communications (publishedVersion, cc-by)
- Research Square (acceptedVersion, cc-by)
- PubMed Central (publishedVersion, cc-by)
- PubMed (publishedVersion)
- White Rose Research Online (University of Leeds, The University of Sheffield, University of York) (acceptedVersion)
- RePEc: Research Papers in Economics (submittedVersion)
- DOAJ (DOAJ: Directory of Open Access Journals) (submittedVersion, cc-by-sa)
- Greater South Information System
- Funders
- Meso Scale Diagnostics
- Wellcome Trust (216417/Z/19/Z, 204721/Z/16/Z, WT 109965MA, 110,110z/15/Z, 211153/Z/18/Z, 109965/Z/15/Z)
- UK Research and Innovation (NIHR200907, MR/V027859/1)
- National Institute for Health Research Health Protection Research Unit (NIHR200907)
- National Institute for Health and Care Research (NIHR-INF-0067, CL-2018-13-007, NIHR-INF-1867, 10980107, U19 I082360, ACF-2019-13-003, DHCS/04/G121/68, COVID-19, ACF-2018-13-005, NIHR300791, MR/V027859/1, WT109965MA, COV19-RECPLA, NF-SI-0515-10005, CL-2020-13-002, NIHR200907, CL-2013-13-003, NF-SI-0617-10139)
- British Heart Foundation (RE/18/3/34214)
- Department of Health and Social Care (COVID-19)
- University of Oxford (RE/18/3/34214, NIHR200907)
- University of New South Wales
- Public Health England
- Huo Family Foundation
- Hamilton Health Sciences Foundation
- UK Coronavirus Immunology Consortium
- National Institutes of Health (WT109965MA, U19 I082360, COVID-19)
- Medical Research Council (MR/V027859/1, 75F40120C00085, MR/L006588/1, COVID-19)
- Biotechnology and Biological Sciences Research Council
- NIHR Oxford Biomedical Research Centre
- Topics
- Health Sciences › Medicine › Infectious Diseases › SARS-CoV-2 and COVID-19 Research
- Life Sciences › Biochemistry, Genetics and Molecular Biology › Molecular Biology › vaccines and immunoinformatics approaches
- Life Sciences › Immunology and Microbiology › Immunology › Immune responses and vaccinations
- Keywords
- SARS-CoV-2, COVID-19 vaccines, variants of concern, Beta variant, Alpha variant, neutralizing antibodies, T cell response, booster vaccination, natural infection, conserved epitopes, vaccine efficacy
- MeSH terms
- Angiotensin-Converting Enzyme 2, COVID-19, SARS-CoV-2, COVID-19 Vaccines, Animals, Antibodies, Monoclonal, Antibodies, Viral, Epitopes, Carrier Proteins, Humans, Immunity, T-Lymphocytes, Antibodies, Neutralizing
About these checks
Registry, retraction, Cites and statistics results are computed, not judged, with one exception: a printed reference that no index lists is read once by a model before it counts as a citation error. Claims are extracted by a model and kept only when their quote appears verbatim in the text; each cited source is then checked, with a model’s help, for whether it says what the claim relies on. Those verdicts can be wrong — read the claim’s quote and the cited source before relying on one.
Statistics and arithmetic are recomputed, not judged.
Confidence bands are shown only for fields calibrated on our annotated test set. None is calibrated yet, so no band is shown.
What counts as a claim ›How we measure confidence ›How we check this ›
Are you an author, or do you see a problem with this page? Request a review
