

The DOI matches its Crossref record; 11 of the 11 references it cites were found in a registry or an index.
Cortical Thickness Differences Are Associated With Chemical Synaptic Transmission Upregulated Genes in Degeneration of Mild Cognitive Impairment
Abstract
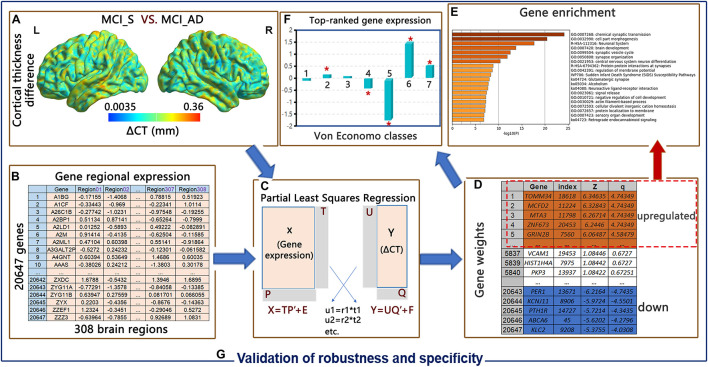
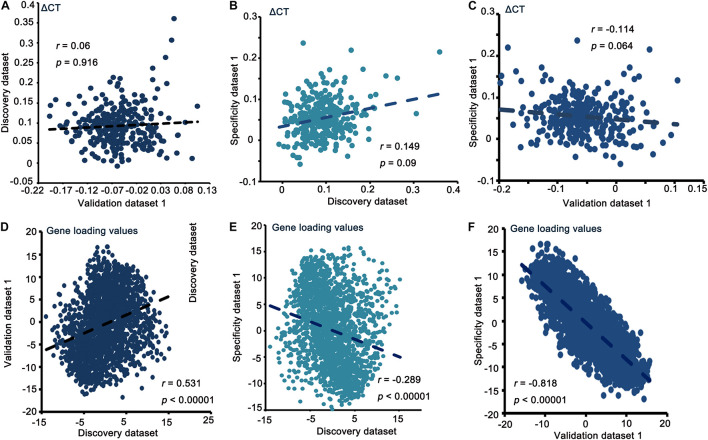
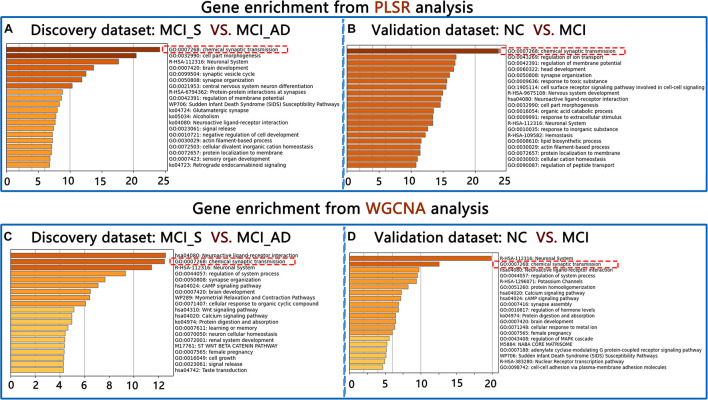
Mild cognitive impairment (MCI) is a transition between normal cognition (NC) and Alzheimer’s disease (AD). Differences in cortical thickness (ΔCT) have been reported in cases that degenerate from MCI to AD. The aspects of genetic and transcriptional variation related to ΔCT are vague. In this study, using an 8-year longitudinal follow-up outcome, we investigated the genetic correlates of ΔCT in MCI subjects with degeneration from MCI to AD (MCI_AD). We employed partial least squares regression (PLSR) on brain T1-weighted magnetic resonance imaging (MRI) images of 180 participants [143 stable MCI (MCI_S) participants and 37 MCI_AD participants] and brain gene expression data from the Allen Institute for Brain Science (AIBS) database to investigate genes associated with ΔCT. We found that upregulated PLS component 1 ΔCT-related genes were enriched in chemical synaptic transmission. To verify the robustness and specificity of the results, we conducted PLSR analysis invalidation and specificity datasets and performed weighted gene co-expression network analysis instead of PLSR for the above three datasets. We also used gene expression data in the brain prefrontal cortex from the Gene Expression Omnibus (GEO) database to indirectly validate the robustness and specificity of our results. We conclude that transcriptionally upregulated genes involved in chemical synaptic transmission are strongly related to global ΔCT in MCI patients who experience degeneration from MCI to AD.
Overview
The claims and statistics of this paper haven’t been checked yet.
Run the check — free, no account needed. It reads the open-access text and checks the sources it cites.
Integrity signals
Registry
Cites
Statistics
Figures
Verification
Claims the paper makes
The claims and statistics of this paper haven’t been checked yet.
Run the check — free, no account needed. It reads the open-access text and checks the sources it cites.
Claims other papers make about this one
Each is checked against this paper’s own text: does it say what the citing paper says it does?
The source backs part of the claim, not all of it — or backs it for a different population, condition or comparison.
In the citing paper
“Our findings, consistent with previous studies [72, 74–76], reinforce the connection between synaptic dysfunction and AD pathogenesis, suggesting that disruptions in synaptic integrity contribute to cortical thinning and cognitive decline.”
From Association of APOC1 with cortical atrophy during conversion to Alzheimer’s disease (2025) · cites this paper as [72]
Experimental — accuracy not yet measuredThe cited source says what the claim attributes to it.
In the citing paper
“A previous study revealed that neurodegeneration-related alterations in CTh were associated with genes upregulating these pathways, underscoring the critical role of synaptic regulation in AD progression [72].”
From Association of APOC1 with cortical atrophy during conversion to Alzheimer’s disease (2025) · cites this paper as [72]
In the citing paper
“The 100 genes that exhibited the highest correlation with CTh changes exhibited pathways involving synaptic signaling under chemical synaptic transmission, emerging as the predominant processes (pFDR < 0.05; Fig. 3A), consistent with the findings of a previous study [72].”
From Association of APOC1 with cortical atrophy during conversion to Alzheimer’s disease (2025) · cites this paper as [72]
Self-check
Percentages, sums and reported differences re-computed from the paper’s own numbers.
The self-check needs the paper’s full text.
Citations
Cites
ARUK Consortium, Sims, R., GERAD/PERADES, C., van der Lee, S. J., Naj, A. C., Bellenguez, C., Badarinarayan, N., Jakobsdottir, J., Kunkle, B. W., Boland, A., et al. (2017) · Nature Genetics · doi:10.1038/ng.3916 · Cited by 1,012
Self-citationCanonical genetic signatures of the adult human brain
Hawrylycz, M., Miller, J. A., Menon, V., Feng, D., Dolbeare, T., Guillozet-Bongaarts, A. L., Jegga, A. G., Aronow, B. J., Lee, C.-K., Bernard, A., et al. (2015) · Nature Neuroscience · doi:10.1038/nn.4171 · Cited by 663
Nobili, A., Latagliata, E. C., Viscomi, M. T., Cavallucci, V., Cutuli, D., Giacovazzo, G., Krashia, P., Rizzo, F. R., Marino, R., Federici, M., et al. (2017) · Nature Communications · doi:10.1038/ncomms14727 · Cited by 514
Morris, J. C., & Price, J. L. (2001) · Journal of Molecular Neuroscience · doi:10.1385/jmn:17:2:101 · Cited by 513
Quantitative assessment of cortical synaptic density in Alzheimer's disease
Scheff, S. W., DeKosky, S. T., & Price, D. A. (1990) · Neurobiology of Aging · doi:10.1016/0197-4580(90)90059-9 · Cited by 446
Synapses and Alzheimer's Disease
Sheng, M., Sabatini, B. L., & Sudhof, T. C. (2012) · Cold Spring Harbor Perspectives in Biology · doi:10.1101/cshperspect.a005777 · Cited by 436
Yan, Z., & Rein, B. (2022) · Molecular Psychiatry · doi:10.1038/s41380-021-01092-3 · Cited by 300 · cited 2×
“These evidences from transcriptionally upregulated genes in AD or MCI has underlined a crucial function for synaptic transmission for the pathology of this disease (Meng and Mei, 2019; Yan and Rein, 2021).”
BackgroundHof, P. R., & Morrison, J. H. (1990) · Journal of Comparative Neurology · doi:10.1002/cne.903010106 · Cited by 294
The role of G protein-coupled receptors in the pathology of Alzheimer's disease
Thathiah, A., & De Strooper, B. (2011) · Nature Reviews Neuroscience · doi:10.1038/nrn2977 · Cited by 288
Lacour, A., Espinosa, A., Louwersheimer, E., Heilmann, S., Hernández, I., Wolfsgruber, S., Fernández, V, Wagner, H., Rosende-Roca, M., Mauleón, A., et al. (2017) · Molecular Psychiatry · doi:10.1038/mp.2016.18 · Cited by 101
Lambert, J. (2013) · Alzheimer's & Dementia · doi:10.1016/j.jalz.2013.04.040 · Cited by 32
Research works printed but not linked: 53
- Anderson, 2018, Gene expression links functional networks across cortex and striatum., Nat. commun., 9, 1, 10.1038/s41467-018-03811-x · DOI · Paper page
- Berchtold, 2013, Synaptic genes are extensively downregulated across multiple brain regions in normal human aging and Alzheimer’s disease., Neurobiol. Aging, 34, 1653, 10.1016/j.neurobiolaging.2012.11.024 · DOI · Paper page
- Bose, 2021, Neurodegeneration upon dysfunction of endosomal/lysosomal CLC chloride transporters., Front. Cell Dev. Biol., 9, 10.3389/fcell.2021.639231 · DOI
- Bottero, 2019, Meta-analysis of gene expression changes in the blood of patients with mild cognitive impairment and alzheimer’s disease dementia., Int. J. Mol. Sci., 20, 10.3390/ijms20215403 · DOI
- Canas, 2014, Predominant loss of glutamatergic terminal markers in a β-amyloid peptide model of Alzheimer’s disease., Neuropharmacology, 76, 51, 10.1016/j.neuropharm.2013.08.026 · DOI
- Chen, 2013, Enrichr: interactive and collaborative HTML5 gene list enrichment analysis tool., BMC Bioinform., 14, 10.1186/1471-2105-14-128 · DOI · Paper page
- Chen, 2019, Synaptic dysfunction in Alzheimer’s disease: mechanisms and therapeutic strategies., Pharmacol. Therap., 195, 186, 10.1016/j.pharmthera.2018.11.006 · DOI · Paper page
- Cirrito, 2005, Synaptic activity regulates interstitial fluid amyloid-β levels in vivo., Neuron, 48, 913, 10.1016/j.neuron.2005.10.028 · DOI · Paper page
- Dal Prà, 2019, Family C G-protein-coupled receptors in Alzheimer’s disease and therapeutic implications., Front. Pharmacol., 10, 10.3389/fphar.2019.01282 · DOI
- Deyts, 2019, APP-mediated signaling prevents memory decline in Alzheimer’s disease mouse model., Cell Rep., 27, 1345, 10.1016/j.celrep.2019.03.087 · DOI
- Economo, 2008, Atlas of Cytoarchitectonics of the Adult Human Cerebral Cortex.
- Eggert, 2018, Trafficking in Alzheimer’s disease: modulation of APP transport and processing by the transmembrane proteins LRP1, SorLA, SorCS1c, Sortilin, and Calsyntenin., Mol. Neurobiol., 55, 5809, 10.1007/s12035-017-0806-x · DOI
- Filippi, 2020, Changes in functional and structural brain connectome along the Alzheimer’s disease continuum., Mol. Psychiatry, 25, 230, 10.1038/s41380-018-0067-8 · DOI
- Fischl, 2012, FreeSurfer., Neuroimage, 62, 774, 10.1016/j.neuroimage.2012.01.021 · DOI · Paper page
- Forner, 2017, Synaptic impairment in Alzheimer’s disease: a dysregulated symphony., Trends Neurosci., 40, 347, 10.1016/j.tins.2017.04.002 · DOI · Paper page
- Georgakopoulos, 2001, Presenilin−1 is a regulatory component of the cadherin cell adhesion complex: implications for alzheimer’s disease., Alzheimer’s Dis., 2001, 521, 10.1002/0470846453.ch48 · DOI
- Gómez-Isla, 1997, Neuronal loss correlates with but exceeds neurofibrillary tangles in Alzheimer’s disease., Ann. Neurol., 41, 17, 10.1002/ana.410410106 · DOI · Paper page
- Hawrylycz, 2012, An anatomically comprehensive atlas of the adult human brain transcriptome., Nature, 489, 391, 10.1038/nature11405 · DOI · Paper page
- Hosseinian, 2020, A meta-analysis of gene expression data highlights synaptic dysfunction in the hippocampus of brains with Alzheimer’s disease., Sci. Rep., 10, 1, 10.1038/s41598-020-64452-z · DOI
- Jansen, 2019, Genome-wide meta-analysis identifies new loci and functional pathways influencing Alzheimer’s disease risk., Nat. Genet., 51, 404, 10.1038/s41588-018-0311-9 · DOI · Paper page
- Jespersen, 2011, Determination of axonal and dendritic orientation distributions within the developing cerebral cortex by diffusion tensor imaging., IEEE Trans. Med. Imag., 31, 16, 10.1109/TMI.2011.2162099 · DOI
- Julkunen, 2010, Differences in cortical thickness in healthy controls, subjects with mild cognitive impairment, and Alzheimer’s disease patients: a longitudinal study., J. Alzheimer’s Dis., 21, 1141, 10.3233/JAD-2010-100114 · DOI
- Julkunen, 2009, Cortical thickness analysis to detect progressive mild cognitive impairment: a reference to Alzheimer’s disease., Dement. Geriat. Cogn. Disord., 28, 389, 10.1159/000256274 · DOI
- Kuleshov, 2016, Enrichr: a comprehensive gene set enrichment analysis web server 2016 update., Nucleic Acids Res., 2016, W90, 10.1093/nar/gkw377 · DOI · Paper page
- Kunkle, 2019, Genetic meta-analysis of diagnosed Alzheimer’s disease identifies new risk loci and implicates Aβ, tau, immunity and lipid processing., Nat. Genet., 51, 414, 10.1038/s41588-019-0358-2 · DOI · Paper page
- Langfelder, 2008, WGCNA: an R package for weighted correlation network analysis., BMC Bioinform., 9, 1, 10.1186/1471-2105-9-559 · DOI · Paper page
- Lauterborn, 2021, Increased excitatory to inhibitory synaptic ratio in parietal cortex samples from individuals with Alzheimer’s disease., Nat. Commun., 12, 1, 10.1038/s41467-021-22742-8 · DOI
- Lerch, 2005, Focal decline of cortical thickness in Alzheimer’s disease identified by computational neuroanatomy., Cereb. Cortex, 15, 995, 10.1093/cercor/bhh200 · DOI
- Li, 2011, Alterations of whole-brain cortical area and thickness in mild cognitive impairment and alzheimer’s disease., J. Alzheimers Dis., 27, 281, 10.3233/JAD-2011-110497 · DOI
- Li, 2021, Cortical structural differences in major depressive disorder correlate with cell type-specific transcriptional signatures., Nat. Commun., 12, 1, 10.1038/s41467-021-21943-5 · DOI
- Limon, 2012, Loss of functional GABAA receptors in the Alzheimer diseased brain., Proc. Nat. Acad. Sci., 109, 10071, 10.1073/pnas.1204606109 · DOI
- Mendez, 1990, Complex visual disturbances in Alzheimer’s disease., Neurology, 40, 439, 10.1212/WNL.40.3_Part_1.439 · DOI
- Meng, 2019, Transcriptional dysregulation study reveals a core network involving the progression of Alzheimer’s disease., Front. Aging Neurosci., 11, 10.3389/fnagi.2019.00101 · DOI
- Moon, 2014, Regional atrophy of the insular cortex is associated with neuropsychiatric symptoms in Alzheimer’s disease patients., Eur. Neurol., 71, 223, 10.1159/000356343 · DOI · Paper page
- Nisticò, 2012, Targeting synaptic dysfunction in Alzheimer’s disease therapy., Mol. Neurobiol., 46, 572, 10.1007/s12035-012-8324-3 · DOI
- Palop, 2007, Aberrant excitatory neuronal activity and compensatory remodeling of inhibitory hippocampal circuits in mouse models of Alzheimer’s disease., Neuron, 55, 697, 10.1016/j.neuron.2007.07.025 · DOI · Paper page
- Querbes, 2009, Early diagnosis of Alzheimer’s disease using cortical thickness: impact of cognitive reserve., Brain, 132, 2036, 10.1093/brain/awp105 · DOI
- Querfurth, 2010, Alzheimer’s disease., N. Engl. J. Med., 362, 1844, 10.1056/NEJMra0909142 · DOI · Paper page
- Reddy, 2005, Differential loss of synaptic proteins in Alzheimer’s disease: implications for synaptic dysfunction., J. Alzheimer’s Dis., 7, 103, 10.3233/JAD-2005-7203 · DOI
- Romero-Garcia, 2020, Schizotypy-related magnetization of cortex in healthy adolescence is colocated with expression of schizophrenia-related genes., Biol. Psychiatry, 88, 248, 10.1016/j.biopsych.2019.12.005 · DOI
- Romero-Garcia, 2019, Synaptic and transcriptionally downregulated genes are associated with cortical thickness differences in autism., Mol. Psychiatry, 24, 1053, 10.1038/s41380-018-0023-7 · DOI
- Romero-Garcia, 2018, Structural covariance networks are coupled to expression of genes enriched in supragranular layers of the human cortex., Neuroimage, 2018, 10.1016/j.neuroimage.2017.12.060 · DOI
- Seidlitz, 2020, Transcriptomic and cellular decoding of regional brain vulnerability to neurogenetic disorders., Nat. Commun., 11, 1, 10.1038/s41467-020-17051-5 · DOI
- Shirotani, 2017, Paradigm shift from diagnosing patients based on common symptoms to categorizing patients into subtypes with different pathogenic mechanisms to guide treatment for Alzheimer’s disease., J. Biochem., 161, 463, 10.1093/jb/mvx015 · DOI
- Singh, 2001, The role of Alzheimer’s disease-related presenilin 1 in intercellular adhesion., Experim. Cell Res., 263, 1, 10.1006/excr.2000.5098 · DOI
- Stephan, 2012, The neuropathological profile of mild cognitive impairment (MCI): a systematic review., Mol. Psychiatry, 17, 1056, 10.1038/mp.2011.147 · DOI
- Tasaki, 2018, The molecular and neuropathological consequences of genetic risk for Alzheimer’s dementia., Front. Neurosci., 12, 10.3389/fnins.2018.00699 · DOI
- Tobias, 1995, An introduction to partial least squares regression, Proceedings of the twentieth annual SAS users group international conference: Citeseer
- Wang, 2021, Association between structural brain features and gene expression by weighted gene co-expression network analysis in conversion from MCI to AD., Behav. Brain Res., 2021
- Xia, 2013, BrainNet Viewer: a network visualization tool for human brain connectomics., PloS One, 8, 10.1371/journal.pone.0068910 · DOI · Paper page
- Zhang, 2005, A general framework for weighted gene co-expression network analysis., Stat. Appl. Genet. Mol. Biol., 4, 10.2202/1544-6115.1128 · DOI · Paper page
- Zhou, 2019, Metascape provides a biologist-oriented resource for the analysis of systems-level datasets., Nat. Commun., 10, 1
- Zilles, 2012, Segregation and wiring in the brain., Science, 335, 10.1126/science.1221366 · DOI
Cited by
Sorted by citations
Association of APOC1 with cortical atrophy during conversion to Alzheimer’s disease
Oh, S., Kim, S., Kim, J. P., Seo, S. W., Park, B.-Y., & Park, H. (2025) · GeroScience · doi:10.1007/s11357-025-01695-6 · Cited by 4
Metadata
- Authors
- Cai, S., Huang, K., Yang, F., Wang, X., Wu, S., Wang, Y., & Huang, L.
- Venue
- Frontiers in Aging Neuroscience
- Publisher
- Frontiers Media SA
- Published
- 2021-10-29
- Volume
- 13
- ISSN
- 1663-4365
- PMC
- PMC8585991
- Cited by
- 11
- References
- 11
About these checks
Registry, retraction, Cites and statistics results are computed, not judged, with one exception: a printed reference that no index lists is read once by a model before it counts as a citation error. Claims are extracted by a model and kept only when their quote appears verbatim in the text; each cited source is then checked, with a model’s help, for whether it says what the claim relies on. Those verdicts can be wrong — read the claim’s quote and the cited source before relying on one.
Statistics and arithmetic are recomputed, not judged.
Confidence bands are shown only for fields calibrated on our annotated test set. None is calibrated yet, so no band is shown.
What counts as a claim ›How we measure confidence ›How we check this ›
Are you an author, or do you see a problem with this page? Request a review
