

The DOI matches its Crossref record; 41 of the 41 references it cites were found in a registry or an index; 16 of the 71 sources its claims cite were checked for support.
Cortical Terminations of the Inferior Fronto-Occipital and Uncinate Fasciculi: Anatomical Stem-Based Virtual Dissection
Open accessAbstract
We combined the neuroanatomists' approach of defining a fascicle as all fibers passing through its compact stem with diffusion-weighted tractography to investigate the cortical terminations of two association tracts, the inferior fronto-occipital fasciculus (IFOF) and the uncinate fasciculus (UF), which have recently been implicated in the ventral language circuitry. The aim was to provide a detailed and quantitative description of their terminations in 60 healthy subjects and to do so to apply an anatomical stem-based virtual dissection, mimicking classical post-mortem dissection, to extract with minimal a priori the IFOF and UF from tractography datasets. In both tracts, we consistently observed more extensive termination territories than their conventional definitions, within the middle and superior frontal, superior parietal and angular gyri for the IFOF and the middle frontal gyrus and superior, middle and inferior temporal gyri beyond the temporal pole for the UF. We revealed new insights regarding the internal organization of these tracts by investigating for the first time the frequency, distribution and hemispheric asymmetry of their terminations. Interestingly, we observed a dissociation between the lateral right-lateralized and medial left-lateralized fronto-occipital branches of the IFOF. In the UF, we observed a rightward lateralization of the orbito-frontal and temporal branches. We revealed a more detailed map of the terminations of these fiber pathways that will enable greater specificity for correlating with diseased populations and other behavioral measures. The limitations of the diffusion tensor model in this study are also discussed. We conclude that anatomical stem-based virtual dissection with diffusion tractography is a fruitful method for studying the structural anatomy of the human white matter pathways.
Overview
AI snapshot
Written from the paper’s full text.
TL;DR
Using anatomical stem-based virtual dissection of diffusion tractography in 60 healthy adults, this study maps cortical terminations of the inferior fronto-occipital fasciculus (IFOF) and uncinate fasciculus (UF) and finds more extensive territories than conventional definitions. It reports branch-specific termination frequency, density, and hemispheric asymmetries, including right-lateralized lateral IFOF/UF branches and left-lateralized medial IFOF branches.
Key findings
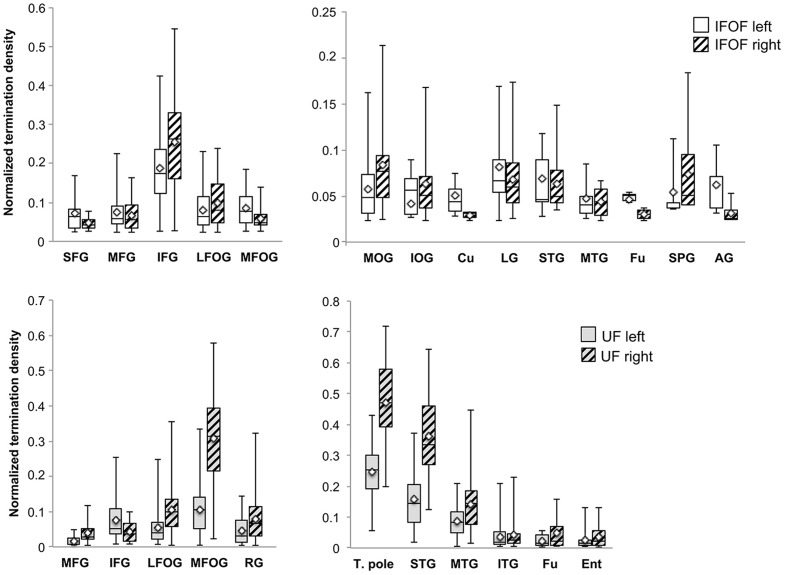
- IFOF terminations extended beyond conventional definitions: inferior frontal gyrus in 100% bilaterally, lateral fronto-orbital gyrus in 87%/90% (left/right), middle frontal gyrus in 60%/55%, superior frontal gyrus in 35%/20%, and posterior regions including middle occipital gyrus 65%/95%, lingual gyrus 80%/78%, superior parietal gyrus 35%/57%, and angular gyrus 10%/33%.
- UF terminations also extended beyond the temporal pole: medial fronto-orbital gyrus, temporal pole, and superior temporal gyrus were present in 100% bilaterally; middle temporal gyrus in 98%/97%, inferior temporal gyrus in 88%/92%, and entorhinal gyrus in 77%/78%.
- Stem volumes were larger on the right: IFOF left 82.5 ± 35.5 mm³ vs right 100.3 ± 47.0 mm³; UF left 74.0 ± 33.0 mm³ vs right 93.9 ± 33.1 mm³ (hemisphere effect F = 40.9, p < 0.0001).
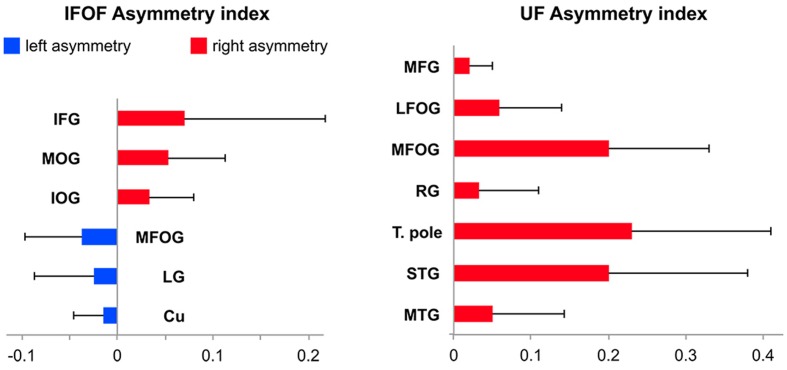
- Asymmetry analyses showed rightward lateralization of IFOF inferior frontal and middle/inferior occipital projections, leftward lateralization of medial fronto-orbital, cuneus, and lingual IFOF projections, and rightward lateralization of UF orbito-frontal and temporal branches.
Methods
- Diffusion-weighted MRI in 60 healthy right-handed adults (30 female; mean age 30.1, range 20–53) from the BIL&GIN database, acquired on a 3T scanner with 21 non-collinear directions (b = 1000 s/mm²), 2 mm isotropic voxels.
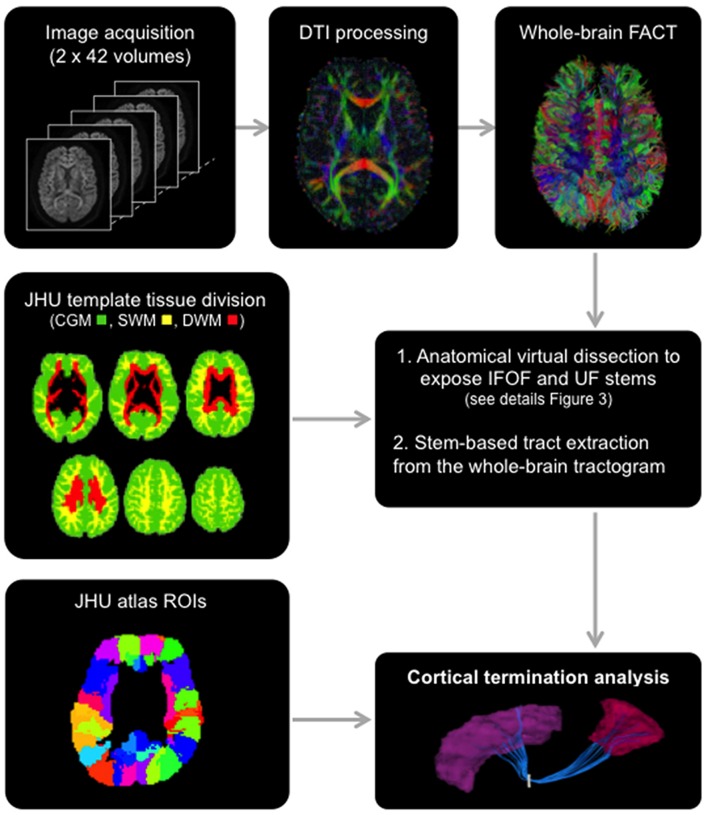
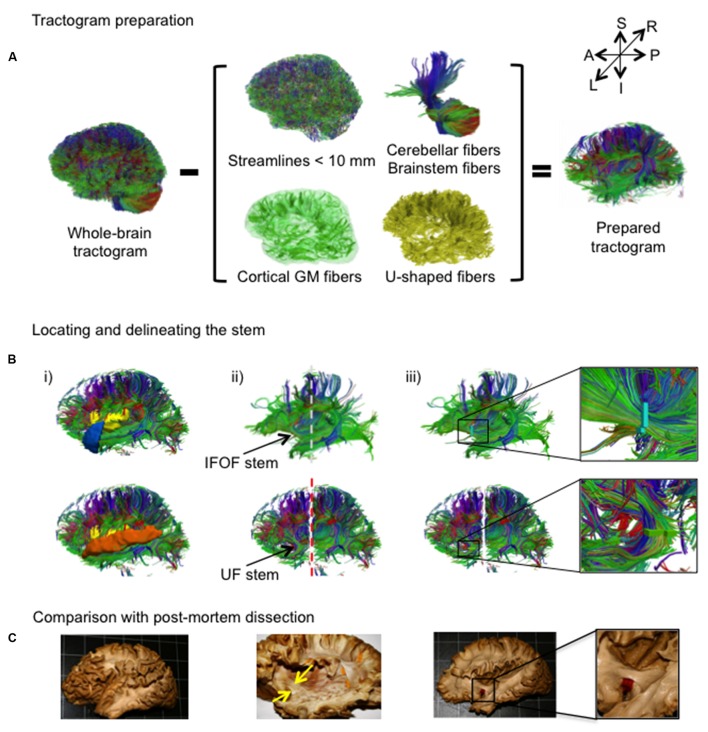
- Deterministic whole-brain tractography using FACT with 0.2 fractional anisotropy and 45° angle thresholds; IFOF and UF were extracted by manual stem-based virtual dissection using modified JHU template regions of interest.
- Termination analysis used normalized termination density scores per cortical region, a false-positive-region threshold, Wilcoxon signed-rank tests with Bonferroni correction (p < 0.0018), and asymmetry indexes tested with Bonferroni-corrected ANOVAs.
Limitations
- The paper states that the diffusion tensor model has limited ability to resolve crossing fibers, producing broken streamlines and likely underestimating terminations, especially for the longer IFOF; it also notes that template differences may contribute to discrepancies with prior studies.
- Evident from the text: deterministic FACT tracking, manual stem delineation, and a healthy right-handed sample restrict generalizability; the study reports no clinical or behavioral outcomes.
Model-written summary. Check it against the paper before relying on it.
Integrity signals
Registry
Cites
Statistics
Figures
Verification
Claims the paper makes
79 Own result · 16 No full text of the sources · 14 Own interpretation · 7 Supported so far · 6 Not checked yet · 5 Supported · 4 No basis given · 3 Own method · 2 Partly supported · 2 Not supported · 1 Sources not found · accuracy not yet measured
The cited sources support only part of this claim — read each source’s verdict below.
In the paper
“Both inferior fronto-occipital (IFOF) and uncinate (UF) fasciculi are crucial for the ventral intra-hemispheric transfer of information between the frontal cortex and the occipital, temporal and parietal cortices”
§ Cortical Terminations of the Inferior Fronto-Occipital and Uncinate Fasciculi: Anatomical Stem-Based Virtual Dissection > Introduction
What the sources say
- Partly supportedcites Turken and Dronkers, 2011 sourceExperimental — accuracy not yet measured
The Introduction describes the inferior occipito-frontal fasciculus as a pathway from frontal cortex to temporal, parietal, and occipital cortices. It describes the uncinate fasciculus more narrowly, as connecting the temporal pole with inferior frontal regions; the Results also associate it with the anterior superior temporal gyrus. These passages do not establish that both tracts are crucial for information transfer to all three posterior cortical regions. Page numbers are unavailable in our copy. (LLM, conf=0.88)
- Not checked — no full text of the sourcecites Duffau, 2015 source
plaindirect- Asserted: passes — The authors put it forward as true.
- Checkable: passes — It can be checked against evidence.
- Load-bearing: passes — The paper’s conclusions depend on it.
- Based: passes — The paper gives a reason why it holds.
- Partly supported
Every source the paper cites for this claim was checked and supports it.
In the paper
“These are consistent with the proportions reported in (Croxson et al., 2005) that used probabilistic tractography.”
§ Cortical Terminations of the Inferior Fronto-Occipital and Uncinate Fasciculi: Anatomical Stem-Based Virtual Dissection > Discussion > Cortical Terminations of the Stem-Based IFOF
What the sources say
- Supportedcites Croxson et al., 2005 source
The Diffusion-weighted image analysis section states that Croxson et al. used probabilistic tractography and calculated the mean proportion of projections to each prefrontal target area. That supports the attribution that the paper reported proportions using this method. The citing authors’ assessment that their own results are consistent with those proportions is their comparison, not a finding attributed to Croxson et al. (LLM, conf=0.87)
plain- Asserted: passes — The authors put it forward as true.
- Checkable: passes — It can be checked against evidence.
- Load-bearing: unclear — It is unclear whether the paper’s conclusions depend on it.
- Based: passes — The paper gives a reason why it holds.
- Supported
The sources with a verdict support this claim; the rest weren’t checked yet, have no full text we could read, or their verdicts aren’t rated yet.
In the paper
“our stem-based virtual dissection results in more extensive IFOFs and UFs.”
§ Cortical Terminations of the Inferior Fronto-Occipital and Uncinate Fasciculi: Anatomical Stem-Based Virtual Dissection > Discussion
What the sources say
- Not checked — no full text of the sourcecites Catani and Thiebaut de Schotten, 2008 source
- Supportedcites Zhang et al., 2010 source
The Results section (Comparison between the automated and manual methods; page unavailable) identifies the fronto-occipital and uncinate fasciculi among tracts reconstructed using ROI-placement strategies. The source supports its use as an example of an ROI-based method; the greater extent of the citing authors’ own stem-based dissections is their result, not a finding attributed to this source. (LLM, conf=0.86)
plaindirectSingle case- Asserted: passes — The authors put it forward as true.
- Checkable: passes — It can be checked against evidence.
- Load-bearing: passes — The paper’s conclusions depend on it.
- Based: passes — The paper gives a reason why it holds.
The sources with a verdict support this claim; the rest weren’t checked yet, have no full text we could read, or their verdicts aren’t rated yet.
In the paper
“While current tract segmentation approaches rely heavily on a priori knowledge, using set-of-ROIs strategies that place the ROIs around their known terminal areas or areas of passage (Catani and Thiebaut de Schotten, 2008; Zhang et al., 2010)”
§ Cortical Terminations of the Inferior Fronto-Occipital and Uncinate Fasciculi: Anatomical Stem-Based Virtual Dissection > Discussion
What the sources say
- Not checked — no full text of the sourcecites Catani and Thiebaut de Schotten, 2008 source
- Supportedcites Zhang et al., 2010 source
The Introduction says that manually defining multiple ROIs using existing anatomical knowledge is common practice for selecting a tract. The Discussion (Advantages of the proposed TRS-based approach and limitations) adds that reliable manual reconstruction requires a well-known tract so the locations of multiple ROIs can be designed. The paper’s examples place ROIs near a cortical projection area and along a tract’s route, consistent with the citing sentence’s description of terminal areas and areas of passage. Page numbers are unavailable in our copy. (LLM, conf=0.88)
plain- Asserted: passes — The authors put it forward as true.
- Checkable: passes — It can be checked against evidence.
- Load-bearing: passes — The paper’s conclusions depend on it.
- Based: passes — The paper gives a reason why it holds.
Every source the paper cites for this claim was checked and supports it.
In the paper
“Neither the superior temporal nor the middle temporal gyri were reported previously (Caverzasi et al., 2014).”
§ Cortical Terminations of the Inferior Fronto-Occipital and Uncinate Fasciculi: Anatomical Stem-Based Virtual Dissection > Discussion > Cortical Terminations of the Stem-Based IFOF
What the sources say
- Supportedcites Caverzasi et al., 2014 source
In the Discussion (page unavailable), Caverzasi et al. state that the IFOFq’s temporal terminations were only in the posterior fusiform gyrus. Their Results section on posterior terminations likewise lists the fusiform gyrus, not the superior or middle temporal gyri. (LLM, conf=0.90)
plain- Asserted: passes — The authors put it forward as true.
- Checkable: passes — It can be checked against evidence.
- Load-bearing: passes — The paper’s conclusions depend on it.
- Based: passes — The paper gives a reason why it holds.
- Supported
A result the paper reports from its own data — it cites no other source for it, so there is none to check. The quote shows it is in the paper.
In the paper
“The mean stem volumes (in mm3) of the left and right IFOFs were 82.5 ± 35.5 and 100.3 ± 47.0, respectively (Table 1).”
§ Cortical Terminations of the Inferior Fronto-Occipital and Uncinate Fasciculi: Anatomical Stem-Based Virtual Dissection > Results > Description of the IFOF and UF Stems
plainn = 60- Asserted: passes — The authors put it forward as true.
- Checkable: passes — It can be checked against evidence.
- Load-bearing: unclear — It is unclear whether the paper’s conclusions depend on it.
- Based: passes — The paper gives a reason why it holds.
- Rests on an assumption: The stem of a tract is the point of passage where all fibers pass through, and extracting streamlines passing through the stem yields the complete tract.
A result the paper reports from its own data — it cites no other source for it, so there is none to check. The quote shows it is in the paper.
In the paper
“The mean stem volumes (in mm3) of the left and right IFOFs were 82.5 ± 35.5 and 100.3 ± 47.0, respectively (Table 1).”
§ Cortical Terminations of the Inferior Fronto-Occipital and Uncinate Fasciculi: Anatomical Stem-Based Virtual Dissection > Results > Description of the IFOF and UF Stems
plainn = 60- Asserted: passes — The authors put it forward as true.
- Checkable: passes — It can be checked against evidence.
- Load-bearing: unclear — It is unclear whether the paper’s conclusions depend on it.
- Based: passes — The paper gives a reason why it holds.
- Rests on an assumption: The stem of a tract is the point of passage where all fibers pass through, and extracting streamlines passing through the stem yields the complete tract.
A result the paper reports from its own data — it cites no other source for it, so there is none to check. The quote shows it is in the paper.
In the paper
“Significant leftward lateralization was observed in the medial occipital areas in the cuneus and lingual gyrus”
§ Cortical Terminations of the Inferior Fronto-Occipital and Uncinate Fasciculi: Anatomical Stem-Based Virtual Dissection > Results > Description of the Tracts
plaincorrelational- Asserted: passes — The authors put it forward as true.
- Checkable: passes — It can be checked against evidence.
- Load-bearing: passes — The paper’s conclusions depend on it.
- Based: passes — The paper gives a reason why it holds.
A result the paper reports from its own data — it cites no other source for it, so there is none to check. The quote shows it is in the paper.
In the paper
“The mean stem volumes of the left and right UFs were 74.0 ± 33.0 and 93.9 ± 33.1, respectively.”
§ Cortical Terminations of the Inferior Fronto-Occipital and Uncinate Fasciculi: Anatomical Stem-Based Virtual Dissection > Results > Description of the IFOF and UF Stems
plainn = 60- Asserted: passes — The authors put it forward as true.
- Checkable: passes — It can be checked against evidence.
- Load-bearing: unclear — It is unclear whether the paper’s conclusions depend on it.
- Based: passes — The paper gives a reason why it holds.
- Rests on an assumption: The stem of a tract is the point of passage where all fibers pass through, and extracting streamlines passing through the stem yields the complete tract.
A result the paper reports from its own data — it cites no other source for it, so there is none to check. The quote shows it is in the paper.
In the paper
“The ANOVA with Tract (IFOF, UF), Hemisphere (Left, Right) and their interaction (Tract × Hemisphere) as within-subject factors and Sex as a between-subjects factor only revealed an Hemisphere effect with both IFOF and UF stems significantly larger in the right hemisphere (F = 40.9, p < 0.0001).”
§ Cortical Terminations of the Inferior Fronto-Occipital and Uncinate Fasciculi: Anatomical Stem-Based Virtual Dissection > Results > Description of the IFOF and UF Stems
plaincorrelationaln = 60- Asserted: passes — The authors put it forward as true.
- Checkable: passes — It can be checked against evidence.
- Load-bearing: unclear — It is unclear whether the paper’s conclusions depend on it.
- Based: passes — The paper gives a reason why it holds.
- Rests on an assumption: The stem of a tract is the point of passage where all fibers pass through, and extracting streamlines passing through the stem yields the complete tract.
- It may state two separate claims as one. 53
- Probably not a substantial claim. 12
- The quote only partly states this claim. 4
At least one cited source doesn’t support this claim or points to a different paper, and none confirmed it — see the verdicts below.
In the paper
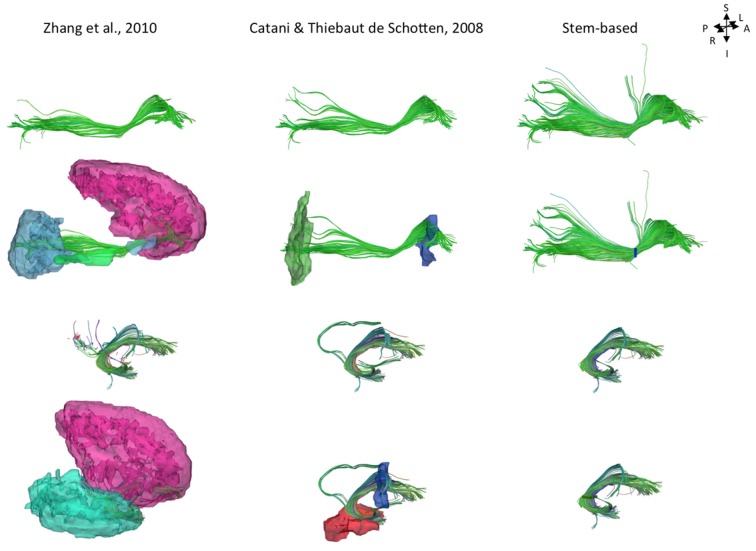
“As shown Figure 8, projections to the parietal lobe are systematically excluded using the method of Zhang et al. (2010) and are likely to be missed using the method of Catani and Thiebaut de Schotten (2008) that use ROIs delineated around the frontal and occipital lobes, as was the case in Sarubbo et al. (2013).”
§ Cortical Terminations of the Inferior Fronto-Occipital and Uncinate Fasciculi: Anatomical Stem-Based Virtual Dissection > Discussion > Cortical Terminations of the Stem-Based IFOF
What the sources say
- Disputedcites Zhang et al. (2010) sourceExperimental — accuracy not yet measured
The Results section (Comparison between the automated and manual methods; page not provided) says Zhang et al.’s automated method reconstructed superior longitudinal fasciculus projections to the parietal lobe. It was the manual comparison method, not Zhang et al.’s automated method, that lacked a posterior parietal–temporal segment. The paper does not establish the claim about the other named methods. (LLM, conf=0.90)
Checked by a reasoning model — may be wrong.
- Not checked — no full text of the sourcecites Catani and Thiebaut de Schotten (2008) source
- Not checked — no full text of the sourcecites Sarubbo et al. (2013) source
hedgeddirect- Asserted: passes — The authors put it forward as true.
- Checkable: passes — It can be checked against evidence.
- Load-bearing: passes — The paper’s conclusions depend on it.
- Based: passes — The paper gives a reason why it holds.
It may state two separate claims as one.
- Disputed
At least one cited source doesn’t support this claim or points to a different paper, and none confirmed it — see the verdicts below.
In the paper
“Importantly, projections to the nuclei of the amygdala reported in Ebeling and von Cramon (1992) refers to the entorhinal cortex and should not be mistaken for the amygdala proper as is often done (Schmahmann and Pandya, 2006; Kim and Whalen, 2009).”
§ Cortical Terminations of the Inferior Fronto-Occipital and Uncinate Fasciculi: Anatomical Stem-Based Virtual Dissection > Discussion > Cortical Terminations of the Stem-Based UF
What the sources say
- Not checked — no full text of the sourcecites Ebeling and von Cramon (1992) source
- Not checked — no full text of the sourcecites Schmahmann and Pandya, 2006 source
- Disputedcites Kim and Whalen, 2009 sourceExperimental — accuracy not yet measured
The Discussion (page unavailable) says the uncinate fasciculus interconnects the amygdala and orbitofrontal lobe, explicitly citing Ebeling and von Cramon (1992). It does not make the claimed distinction that those projections concern the entorhinal cortex rather than the amygdala proper; its statement points the other way. (LLM, conf=0.88)
Checked by a reasoning model — may be wrong.
plain- Asserted: passes — The authors put it forward as true.
- Checkable: passes — It can be checked against evidence.
- Load-bearing: passes — The paper’s conclusions depend on it.
- Based: passes — The paper gives a reason why it holds.
It may state two separate claims as one.
The sources with a verdict support this claim; the rest weren’t checked yet, have no full text we could read, or their verdicts aren’t rated yet.
In the paper
“knowing their cortical terminations is fundamental for understanding their role in mediating language semantics”
§ Cortical Terminations of the Inferior Fronto-Occipital and Uncinate Fasciculi: Anatomical Stem-Based Virtual Dissection > Introduction
What the sources say
- Supportedcites Turken and Dronkers, 2011 source
The Introduction identifies the UF’s cortical connections and discusses its proposed role in semantic processing. The Discussion section on the IOFF links its frontal and temporal connections to semantic processing and says its relationship with the MTG needs better characterization. Together, these passages support the point that mapping the tracts’ cortical connections matters for understanding their possible semantic roles. (LLM, conf=0.84)
- Not checked — no full text of the sourcecites Duffau, 2015 source
plaincorrelational- Asserted: passes — The authors put it forward as true.
- Checkable: fails — It may be too vague to check against evidence.
- Load-bearing: passes — The paper’s conclusions depend on it.
- Based: passes — The paper gives a reason why it holds.
Probably not a substantial claim. It may be too vague to check against evidence.
- Supported
Every source the paper cites for this claim was checked and supports it.
In the paper
“only one tractography study has examined the cortical terminations of the IFOF in a group (20 subjects) confirming some of the more extensive projections described inconsistently thus far in the literature, in particular within the parietal lobe (Caverzasi et al., 2014).”
§ Cortical Terminations of the Inferior Fronto-Occipital and Uncinate Fasciculi: Anatomical Stem-Based Virtual Dissection > Introduction
What the sources say
- Supportedcites Caverzasi et al., 2014 source
The Discussion describes this as an in vivo q-ball tractography study of 20 healthy subjects that confirmed previously reported anatomical findings. The Conclusion reports parietal connections consistently found in all subjects and describes the study as providing the first convincing in vivo demonstration of both frontal and posterior IFOF terminations. Page numbers were not supplied in our copy. (LLM, conf=0.91)
plainn = 20- Asserted: passes — The authors put it forward as true.
- Checkable: passes — It can be checked against evidence.
- Load-bearing: passes — The paper’s conclusions depend on it.
- Based: passes — The paper gives a reason why it holds.
It may state two separate claims as one.
- Supported
The sources with a verdict support this claim; the rest weren’t checked yet, have no full text we could read, or their verdicts aren’t rated yet.
In the paper
“We observed superior parietal IFOF terminations in the majority of the subjects consistent with dissection [Martino et al. (2010) reported parietal connections in 9 out of 14 hemispheres], and less frequently in the angular gyrus in contrast to Caverzasi et al. (2014) who reported it in 100% of subjects.”
§ Cortical Terminations of the Inferior Fronto-Occipital and Uncinate Fasciculi: Anatomical Stem-Based Virtual Dissection > Discussion > Cortical Terminations of the Stem-Based IFOF
What the sources say
- Not checked — no full text of the sourcecites Martino et al. (2010) source
- Supportedcites Caverzasi et al. (2014) source
The Discussion reports bilateral angular-gyrus IFOFq terminations in all subjects, supporting the citing sentence’s attribution that Caverzasi et al. reported them in 100% of subjects. The Results give lower hemisphere-specific figures—90% on the left and 95% on the right—so the paper is internally inconsistent on that frequency. (LLM, conf=0.88)
plain- Asserted: passes — The authors put it forward as true.
- Checkable: passes — It can be checked against evidence.
- Load-bearing: passes — The paper’s conclusions depend on it.
- Based: passes — The paper gives a reason why it holds.
It may state two separate claims as one.
Every source the paper cites for this claim was checked and supports it.
In the paper
“The present results are also consistent with the proportions reported in Croxson et al. (2005).”
§ Cortical Terminations of the Inferior Fronto-Occipital and Uncinate Fasciculi: Anatomical Stem-Based Virtual Dissection > Discussion > Cortical Terminations of the Stem-Based UF
What the sources say
- Supportedcites Croxson et al. (2005) source
The Diffusion-weighted image analysis section says Croxson et al. calculated mean proportions of projections to prefrontal target areas, supporting the attribution of reported proportions. Whether the citing paper’s results are consistent with them is the citing authors’ own comparison, not a finding attributed to Croxson et al. (LLM, conf=0.86)
plain- Asserted: passes — The authors put it forward as true.
- Checkable: passes — It can be checked against evidence.
- Load-bearing: fails — The paper’s conclusions may not depend on it.
- Based: passes — The paper gives a reason why it holds.
Probably not a substantial claim. The paper’s conclusions may not depend on it.
- Supported
The sources with a verdict support this claim; the rest weren’t checked yet, have no full text we could read, or their verdicts aren’t rated yet.
In the paper
“Projections to the lingual gyrus were observed in almost all subjects consistent with Caverzasi et al. (2014), however, Martino et al. (2010) reported no projections to the lingual gyrus and instead considered them as part of the optic radiations.”
§ Cortical Terminations of the Inferior Fronto-Occipital and Uncinate Fasciculi: Anatomical Stem-Based Virtual Dissection > Discussion > Cortical Terminations of the Stem-Based IFOF
What the sources say
- Supportedcites Caverzasi et al. (2014) source
The Results (Posterior Termination of the IFOFq; page not provided) report bilateral projections to the lingual cortex in all 20 subjects. The Discussion says this contrasts with Martino et al., who attributed lingual-gyrus terminations only to the optic radiations. Caverzasi et al. caution that their tractography might not distinguish the two bundles. (LLM, conf=0.93)
- Not checked — no full text of the sourcecites Martino et al. (2010) source
plain- Asserted: passes — The authors put it forward as true.
- Checkable: passes — It can be checked against evidence.
- Load-bearing: unclear — It is unclear whether the paper’s conclusions depend on it.
- Based: passes — The paper gives a reason why it holds.
It may state two separate claims as one.
- Supported
The sources with a verdict support this claim; the rest weren’t checked yet, have no full text we could read, or their verdicts aren’t rated yet.
In the paper
“Our study first confirmed frontal IFOF terminations within the inferior frontal and lateral and medial fronto-orbital gyri corresponding to the conventional IFOF definition, but also in the superior and middle frontal gyri”
§ Cortical Terminations of the Inferior Fronto-Occipital and Uncinate Fasciculi: Anatomical Stem-Based Virtual Dissection > Discussion > Cortical Terminations of the Stem-Based IFOF
What the sources say
- Not checked — no full text of the sourcecites Sarubbo et al., 2013 source
- Supportedcites Caverzasi et al., 2014 source
The Results section (“Frontal Termination of the IFOFq”) identifies terminations in the lateral and medial orbitofrontal regions, inferior frontal gyrus, rostral middle frontal gyrus, and superior frontal gyrus. The Discussion likewise describes superior and middle frontal terminations beyond the conventional inferior frontal and orbitofrontal regions. (LLM, conf=0.94)
boosted- Asserted: passes — The authors put it forward as true.
- Checkable: passes — It can be checked against evidence.
- Load-bearing: passes — The paper’s conclusions depend on it.
- Based: passes — The paper gives a reason why it holds.
It may state two separate claims as one.
Every source the paper cites for this claim was checked and supports it.
In the paper
“Projections to the cuneus were infrequent in the right hemisphere (present in 15 vs. 38% in the left hemisphere) showing the opposite pattern of Caverzasi et al. (2014)”
§ Cortical Terminations of the Inferior Fronto-Occipital and Uncinate Fasciculi: Anatomical Stem-Based Virtual Dissection > Discussion > Cortical Terminations of the Stem-Based IFOF
What the sources say
- Supportedcites Caverzasi et al. (2014) source
The Results section (“Posterior Termination of the IFOFq”) reports cuneus projections in 60% of right hemispheres versus 35% of left hemispheres—the opposite direction from the citing authors’ 15% versus 38%. The citing authors’ percentages describe their own finding, not Caverzasi et al.’s. (LLM, conf=0.94)
plaincorrelational- Asserted: passes — The authors put it forward as true.
- Checkable: passes — It can be checked against evidence.
- Load-bearing: unclear — It is unclear whether the paper’s conclusions depend on it.
- Based: passes — The paper gives a reason why it holds.
It may state two separate claims as one.
- Supported
The sources with a verdict support this claim; the rest weren’t checked yet, have no full text we could read, or their verdicts aren’t rated yet.
In the paper
“These discrepancies may be due to the existence of adjacent tracts, such as the amygdalo-temporo or amygdala-prefrontal pathways (Klinger and Gloor, 1960; Kim and Whalen, 2009) which may have been sometimes misattributed to the UF.”
§ Cortical Terminations of the Inferior Fronto-Occipital and Uncinate Fasciculi: Anatomical Stem-Based Virtual Dissection > Discussion > Cortical Terminations of the Stem-Based UF
What the sources say
- Not checked — no full text of the sourcecites Klinger and Gloor, 1960 source
- Supportedcites Kim and Whalen, 2009 source
The citation identifies the amygdala–prefrontal pathway as an example of a tract relevant to the authors’ proposed explanation. The Discussion describes a putative amygdala–vmPFC pathway and distinguishes more medial white matter from lateral voxels consistent with the uncinate fasciculus. The suggestion that tracts were sometimes misattributed to the UF is the citing authors’ hypothesis, not a finding this paper establishes. (LLM, conf=0.86)
hedgedconditional- Asserted: passes — The authors put it forward as true.
- Checkable: passes — It can be checked against evidence.
- Load-bearing: unclear — It is unclear whether the paper’s conclusions depend on it.
- Based: passes — The paper gives a reason why it holds.
It may state two separate claims as one.
The cited sources support only part of this claim — read each source’s verdict below.
In the paper
“Hemispheric asymmetry in the UF has been observed for both volume and diffusion metrics but there are inconsistencies in the directionality of such asymmetry of the UF.”
§ Cortical Terminations of the Inferior Fronto-Occipital and Uncinate Fasciculi: Anatomical Stem-Based Virtual Dissection > Discussion > Asymmetry of Cortical UF Terminations
What the sources say
- Not checked — no full text of the sourcecites Highley et al., 2002 source
- Partly supportedcites Park et al., 2004 sourceExperimental — accuracy not yet measured
The Discussion (page unavailable) reports differing left–right patterns of uncinate fasciculus fractional anisotropy and concludes that its asymmetry remains controversial. It also cites a postmortem finding for cross-sectional area and fiber number, but does not report an uncinate fasciculus volume measurement; that specific part of the claim is not established by our copy. (LLM, conf=0.85)
- Not checked — no full text of the sourcecites Thomas et al., 2015 source
plaincorrelational- Asserted: passes — The authors put it forward as true.
- Checkable: passes — It can be checked against evidence.
- Load-bearing: unclear — It is unclear whether the paper’s conclusions depend on it.
- Based: passes — The paper gives a reason why it holds.
It may state two separate claims as one.
A result the paper reports from its own data — it cites no other source for it, so there is none to check. The quote shows it is in the paper.
In the paper
“with minor branches projecting to the lateral (0.08 and 0.10)”
§ Cortical Terminations of the Inferior Fronto-Occipital and Uncinate Fasciculi: Anatomical Stem-Based Virtual Dissection > Results > Description of the Tracts
plain- Asserted: passes — The authors put it forward as true.
- Checkable: passes — It can be checked against evidence.
- Load-bearing: unclear — It is unclear whether the paper’s conclusions depend on it.
- Based: passes — The paper gives a reason why it holds.
The quote only partly states this claim.
A result the paper reports from its own data — it cites no other source for it, so there is none to check. The quote shows it is in the paper.
In the paper
“Projections to the fusiform gyrus were observed in the minority of subjects (37 and 43%)”
§ Cortical Terminations of the Inferior Fronto-Occipital and Uncinate Fasciculi: Anatomical Stem-Based Virtual Dissection > Results > Description of the Tracts
plain- Asserted: passes — The authors put it forward as true.
- Checkable: passes — It can be checked against evidence.
- Load-bearing: unclear — It is unclear whether the paper’s conclusions depend on it.
- Based: passes — The paper gives a reason why it holds.
It may state two separate claims as one.
A result the paper reports from its own data — it cites no other source for it, so there is none to check. The quote shows it is in the paper.
In the paper
“Anteriorly, the IFOF terminates predominantly in the inferior frontal gyrus (NTDS: 0.19 and 0.26 for the left and right, respectively henceforth)”
§ Cortical Terminations of the Inferior Fronto-Occipital and Uncinate Fasciculi: Anatomical Stem-Based Virtual Dissection > Results > Description of the Tracts
plain- Asserted: passes — The authors put it forward as true.
- Checkable: passes — It can be checked against evidence.
- Load-bearing: passes — The paper’s conclusions depend on it.
- Based: passes — The paper gives a reason why it holds.
It may state two separate claims as one.
A result the paper reports from its own data — it cites no other source for it, so there is none to check. The quote shows it is in the paper.
In the paper
“almost always projected to the lateral fronto-orbital (88 and 98%)”
§ Cortical Terminations of the Inferior Fronto-Occipital and Uncinate Fasciculi: Anatomical Stem-Based Virtual Dissection > Results > Description of the Tracts
plain- Asserted: passes — The authors put it forward as true.
- Checkable: passes — It can be checked against evidence.
- Load-bearing: unclear — It is unclear whether the paper’s conclusions depend on it.
- Based: passes — The paper gives a reason why it holds.
It may state two separate claims as one.
A result the paper reports from its own data — it cites no other source for it, so there is none to check. The quote shows it is in the paper.
In the paper
“Projections to the middle (12 and 60%)”
§ Cortical Terminations of the Inferior Fronto-Occipital and Uncinate Fasciculi: Anatomical Stem-Based Virtual Dissection > Results > Description of the Tracts
plain- Asserted: passes — The authors put it forward as true.
- Checkable: passes — It can be checked against evidence.
- Load-bearing: unclear — It is unclear whether the paper’s conclusions depend on it.
- Based: passes — The paper gives a reason why it holds.
It may state two separate claims as one.
A result the paper reports from its own data — it cites no other source for it, so there is none to check. The quote shows it is in the paper.
In the paper
“The UF also frequently projected to the inferior temporal gyrus (88 and 92%)”
§ Cortical Terminations of the Inferior Fronto-Occipital and Uncinate Fasciculi: Anatomical Stem-Based Virtual Dissection > Results > Description of the Tracts
plain- Asserted: passes — The authors put it forward as true.
- Checkable: passes — It can be checked against evidence.
- Load-bearing: unclear — It is unclear whether the paper’s conclusions depend on it.
- Based: passes — The paper gives a reason why it holds.
It may state two separate claims as one.
A result the paper reports from its own data — it cites no other source for it, so there is none to check. The quote shows it is in the paper.
In the paper
“with minor branches in the inferior temporal (0.04 bilaterally), fusiform (0.03 and 0.05) and entorhinal (0.03 and 0.05) gyri”
§ Cortical Terminations of the Inferior Fronto-Occipital and Uncinate Fasciculi: Anatomical Stem-Based Virtual Dissection > Results > Description of the Tracts
plain- Asserted: passes — The authors put it forward as true.
- Checkable: passes — It can be checked against evidence.
- Load-bearing: unclear — It is unclear whether the paper’s conclusions depend on it.
- Based: passes — The paper gives a reason why it holds.
The quote only partly states this claim.
A result the paper reports from its own data — it cites no other source for it, so there is none to check. The quote shows it is in the paper.
In the paper
“Projection to the cuneus (38 and 15%), fusiform gyrus (12 and 32%) and angular gyrus (10 and 33%) were observed in the minority of subjects.”
§ Cortical Terminations of the Inferior Fronto-Occipital and Uncinate Fasciculi: Anatomical Stem-Based Virtual Dissection > Results > Description of the Tracts
plainn = 60- Asserted: passes — The authors put it forward as true.
- Checkable: passes — It can be checked against evidence.
- Load-bearing: unclear — It is unclear whether the paper’s conclusions depend on it.
- Based: passes — The paper gives a reason why it holds.
It may state two separate claims as one.
- Rests on an assumption: The stem of a tract is the point of passage where all fibers pass through, and extracting streamlines passing through the stem yields the complete tract.
- Rests on an assumption: The precentral and superior parietal gyri contain no true terminations of IFOF and UF, respectively, and can serve as false positive regions for thresholding.
A result the paper reports from its own data — it cites no other source for it, so there is none to check. The quote shows it is in the paper.
In the paper
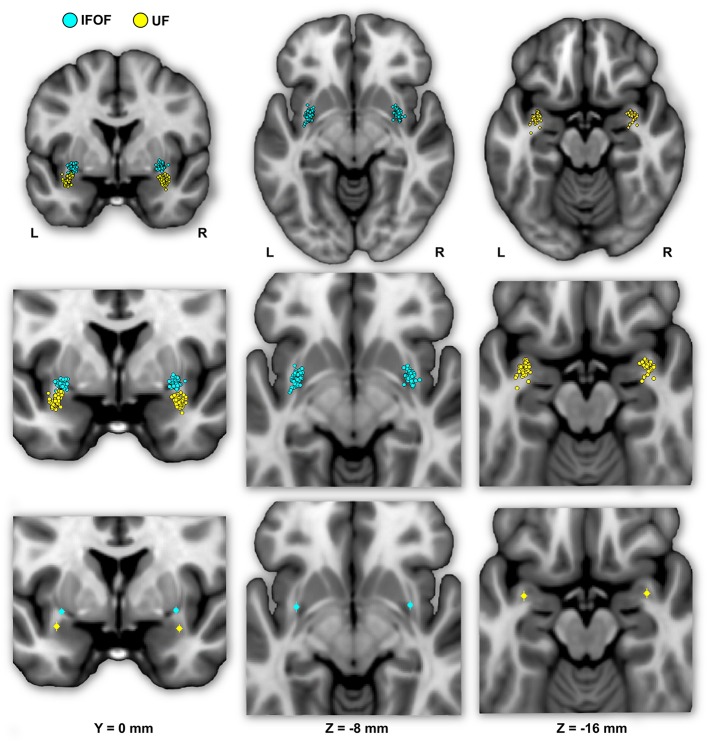
“The mean Euclidean distances between the left IFOF and UF stem centers of mass were 9.4 ± 2.7 mm and for the right IFOF and UF stems was 10.5 ± 2.1 mm, both being significantly different from 0 (Student’s t-test, p < 0.0001).”
§ Cortical Terminations of the Inferior Fronto-Occipital and Uncinate Fasciculi: Anatomical Stem-Based Virtual Dissection > Results > Description of the IFOF and UF Stems
plain- Asserted: passes — The authors put it forward as true.
- Checkable: passes — It can be checked against evidence.
- Load-bearing: passes — The paper’s conclusions depend on it.
- Based: passes — The paper gives a reason why it holds.
It may state two separate claims as one.
- Rests on an assumption: The stem of a tract is the point of passage where all fibers pass through, and extracting streamlines passing through the stem yields the complete tract.
A result the paper reports from its own data — it cites no other source for it, so there is none to check. The quote shows it is in the paper.
In the paper
“The IFOF also terminated in the inferior occipital gyrus (30 and 77%), in the temporal lobe in the superior (73 and 45%) and middle (33 and 52%) temporal gyri, and in the parietal lobe in the superior parietal gyrus (35 and 57%).”
§ Cortical Terminations of the Inferior Fronto-Occipital and Uncinate Fasciculi: Anatomical Stem-Based Virtual Dissection > Results > Description of the Tracts
plainn = 60- Asserted: passes — The authors put it forward as true.
- Checkable: passes — It can be checked against evidence.
- Load-bearing: unclear — It is unclear whether the paper’s conclusions depend on it.
- Based: passes — The paper gives a reason why it holds.
It may state two separate claims as one.
- Rests on an assumption: The stem of a tract is the point of passage where all fibers pass through, and extracting streamlines passing through the stem yields the complete tract.
- Rests on an assumption: The precentral and superior parietal gyri contain no true terminations of IFOF and UF, respectively, and can serve as false positive regions for thresholding.
A result the paper reports from its own data — it cites no other source for it, so there is none to check. The quote shows it is in the paper.
In the paper
“Projection to the cuneus (38 and 15%), fusiform gyrus (12 and 32%) and angular gyrus (10 and 33%) were observed in the minority of subjects.”
§ Cortical Terminations of the Inferior Fronto-Occipital and Uncinate Fasciculi: Anatomical Stem-Based Virtual Dissection > Results > Description of the Tracts
plainn = 60- Asserted: passes — The authors put it forward as true.
- Checkable: passes — It can be checked against evidence.
- Load-bearing: unclear — It is unclear whether the paper’s conclusions depend on it.
- Based: passes — The paper gives a reason why it holds.
It may state two separate claims as one.
- Rests on an assumption: The stem of a tract is the point of passage where all fibers pass through, and extracting streamlines passing through the stem yields the complete tract.
- Rests on an assumption: The precentral and superior parietal gyri contain no true terminations of IFOF and UF, respectively, and can serve as false positive regions for thresholding.
A result the paper reports from its own data — it cites no other source for it, so there is none to check. The quote shows it is in the paper.
In the paper
“Posteriorly, the UF projects in a graded manner with the largest portion in the temporal pole (0.25 and 0.47)”
§ Cortical Terminations of the Inferior Fronto-Occipital and Uncinate Fasciculi: Anatomical Stem-Based Virtual Dissection > Results > Description of the Tracts
plain- Asserted: passes — The authors put it forward as true.
- Checkable: passes — It can be checked against evidence.
- Load-bearing: unclear — It is unclear whether the paper’s conclusions depend on it.
- Based: passes — The paper gives a reason why it holds.
The quote only partly states this claim.
A result the paper reports from its own data — it cites no other source for it, so there is none to check. The quote shows it is in the paper.
In the paper
“and rectus (83 and 93%) gyri”
§ Cortical Terminations of the Inferior Fronto-Occipital and Uncinate Fasciculi: Anatomical Stem-Based Virtual Dissection > Results > Description of the Tracts
plain- Asserted: passes — The authors put it forward as true.
- Checkable: passes — It can be checked against evidence.
- Load-bearing: unclear — It is unclear whether the paper’s conclusions depend on it.
- Based: passes — The paper gives a reason why it holds.
It may state two separate claims as one.
A result the paper reports from its own data — it cites no other source for it, so there is none to check. The quote shows it is in the paper.
In the paper
“The most frequent posterior termination regions were the middle occipital gyrus (65 and 95%) and lingual gyrus (80 and 78%).”
§ Cortical Terminations of the Inferior Fronto-Occipital and Uncinate Fasciculi: Anatomical Stem-Based Virtual Dissection > Results > Description of the Tracts
plainn = 60- Asserted: passes — The authors put it forward as true.
- Checkable: passes — It can be checked against evidence.
- Load-bearing: unclear — It is unclear whether the paper’s conclusions depend on it.
- Based: passes — The paper gives a reason why it holds.
It may state two separate claims as one.
- Rests on an assumption: The stem of a tract is the point of passage where all fibers pass through, and extracting streamlines passing through the stem yields the complete tract.
- Rests on an assumption: The precentral and superior parietal gyri contain no true terminations of IFOF and UF, respectively, and can serve as false positive regions for thresholding.
A result the paper reports from its own data — it cites no other source for it, so there is none to check. The quote shows it is in the paper.
In the paper
“in the superior parietal (0.05 and 0.07) and angular (0.06 and 0.03,) gyri”
§ Cortical Terminations of the Inferior Fronto-Occipital and Uncinate Fasciculi: Anatomical Stem-Based Virtual Dissection > Results > Description of the Tracts
plain- Asserted: passes — The authors put it forward as true.
- Checkable: passes — It can be checked against evidence.
- Load-bearing: unclear — It is unclear whether the paper’s conclusions depend on it.
- Based: passes — The paper gives a reason why it holds.
It may state two separate claims as one.
A result the paper reports from its own data — it cites no other source for it, so there is none to check. The quote shows it is in the paper.
In the paper
“For the UF, the anterior projections are most predominant in the medial fronto-orbital gyrus (0.10 and 0.31)”
§ Cortical Terminations of the Inferior Fronto-Occipital and Uncinate Fasciculi: Anatomical Stem-Based Virtual Dissection > Results > Description of the Tracts
plain- Asserted: passes — The authors put it forward as true.
- Checkable: passes — It can be checked against evidence.
- Load-bearing: unclear — It is unclear whether the paper’s conclusions depend on it.
- Based: passes — The paper gives a reason why it holds.
The quote only partly states this claim.
A result the paper reports from its own data — it cites no other source for it, so there is none to check. The quote shows it is in the paper.
In the paper
“Anteriorly, the IFOF always projected to the inferior frontal gyrus (present in all subjects, bilaterally), almost always projected to the lateral fronto-orbital gyrus (87 and 90% for the left and right hemispheres, respectively henceforth) and less frequently projected to the medial fronto-orbital gyrus (63 and 32%) and middle frontal gyrus (60 and 55%).”
§ Cortical Terminations of the Inferior Fronto-Occipital and Uncinate Fasciculi: Anatomical Stem-Based Virtual Dissection > Results > Description of the Tracts
plainn = 60- Asserted: passes — The authors put it forward as true.
- Checkable: passes — It can be checked against evidence.
- Load-bearing: unclear — It is unclear whether the paper’s conclusions depend on it.
- Based: passes — The paper gives a reason why it holds.
It may state two separate claims as one.
- Rests on an assumption: The stem of a tract is the point of passage where all fibers pass through, and extracting streamlines passing through the stem yields the complete tract.
- Rests on an assumption: The precentral and superior parietal gyri contain no true terminations of IFOF and UF, respectively, and can serve as false positive regions for thresholding.
A result the paper reports from its own data — it cites no other source for it, so there is none to check. The quote shows it is in the paper.
In the paper
“almost always in the middle temporal gyrus (98 and 97%)”
§ Cortical Terminations of the Inferior Fronto-Occipital and Uncinate Fasciculi: Anatomical Stem-Based Virtual Dissection > Results > Description of the Tracts
plain- Asserted: passes — The authors put it forward as true.
- Checkable: passes — It can be checked against evidence.
- Load-bearing: unclear — It is unclear whether the paper’s conclusions depend on it.
- Based: passes — The paper gives a reason why it holds.
It may state two separate claims as one.
A result the paper reports from its own data — it cites no other source for it, so there is none to check. The quote shows it is in the paper.
In the paper
“The most frequent posterior termination regions were the middle occipital gyrus (65 and 95%) and lingual gyrus (80 and 78%).”
§ Cortical Terminations of the Inferior Fronto-Occipital and Uncinate Fasciculi: Anatomical Stem-Based Virtual Dissection > Results > Description of the Tracts
plainn = 60- Asserted: passes — The authors put it forward as true.
- Checkable: passes — It can be checked against evidence.
- Load-bearing: unclear — It is unclear whether the paper’s conclusions depend on it.
- Based: passes — The paper gives a reason why it holds.
It may state two separate claims as one.
- Rests on an assumption: The stem of a tract is the point of passage where all fibers pass through, and extracting streamlines passing through the stem yields the complete tract.
- Rests on an assumption: The precentral and superior parietal gyri contain no true terminations of IFOF and UF, respectively, and can serve as false positive regions for thresholding.
A result the paper reports from its own data — it cites no other source for it, so there is none to check. The quote shows it is in the paper.
In the paper
“and inferior (37 and 35%) frontal gyri”
§ Cortical Terminations of the Inferior Fronto-Occipital and Uncinate Fasciculi: Anatomical Stem-Based Virtual Dissection > Results > Description of the Tracts
plain- Asserted: passes — The authors put it forward as true.
- Checkable: passes — It can be checked against evidence.
- Load-bearing: unclear — It is unclear whether the paper’s conclusions depend on it.
- Based: passes — The paper gives a reason why it holds.
It may state two separate claims as one.
A result the paper reports from its own data — it cites no other source for it, so there is none to check. The quote shows it is in the paper.
In the paper
“Projection to the cuneus (38 and 15%), fusiform gyrus (12 and 32%) and angular gyrus (10 and 33%) were observed in the minority of subjects.”
§ Cortical Terminations of the Inferior Fronto-Occipital and Uncinate Fasciculi: Anatomical Stem-Based Virtual Dissection > Results > Description of the Tracts
plainn = 60- Asserted: passes — The authors put it forward as true.
- Checkable: passes — It can be checked against evidence.
- Load-bearing: unclear — It is unclear whether the paper’s conclusions depend on it.
- Based: passes — The paper gives a reason why it holds.
It may state two separate claims as one.
- Rests on an assumption: The stem of a tract is the point of passage where all fibers pass through, and extracting streamlines passing through the stem yields the complete tract.
- Rests on an assumption: The precentral and superior parietal gyri contain no true terminations of IFOF and UF, respectively, and can serve as false positive regions for thresholding.
A result the paper reports from its own data — it cites no other source for it, so there is none to check. The quote shows it is in the paper.
In the paper
“and entorhinal gyrus (77 and 78%)”
§ Cortical Terminations of the Inferior Fronto-Occipital and Uncinate Fasciculi: Anatomical Stem-Based Virtual Dissection > Results > Description of the Tracts
plain- Asserted: passes — The authors put it forward as true.
- Checkable: passes — It can be checked against evidence.
- Load-bearing: unclear — It is unclear whether the paper’s conclusions depend on it.
- Based: passes — The paper gives a reason why it holds.
It may state two separate claims as one.
A result the paper reports from its own data — it cites no other source for it, so there is none to check. The quote shows it is in the paper.
In the paper
“Projections to the superior frontal gyrus were observed in the minority of subjects (35 and 20%).”
§ Cortical Terminations of the Inferior Fronto-Occipital and Uncinate Fasciculi: Anatomical Stem-Based Virtual Dissection > Results > Description of the Tracts
plainn = 60- Asserted: passes — The authors put it forward as true.
- Checkable: passes — It can be checked against evidence.
- Load-bearing: unclear — It is unclear whether the paper’s conclusions depend on it.
- Based: passes — The paper gives a reason why it holds.
It may state two separate claims as one.
- Rests on an assumption: The stem of a tract is the point of passage where all fibers pass through, and extracting streamlines passing through the stem yields the complete tract.
- Rests on an assumption: The precentral and superior parietal gyri contain no true terminations of IFOF and UF, respectively, and can serve as false positive regions for thresholding.
A result the paper reports from its own data — it cites no other source for it, so there is none to check. The quote shows it is in the paper.
In the paper
“The mean Euclidean distances between the left IFOF and UF stem centers of mass were 9.4 ± 2.7 mm and for the right IFOF and UF stems was 10.5 ± 2.1 mm, both being significantly different from 0 (Student’s t-test, p < 0.0001).”
§ Cortical Terminations of the Inferior Fronto-Occipital and Uncinate Fasciculi: Anatomical Stem-Based Virtual Dissection > Results > Description of the IFOF and UF Stems
plain- Asserted: passes — The authors put it forward as true.
- Checkable: passes — It can be checked against evidence.
- Load-bearing: passes — The paper’s conclusions depend on it.
- Based: passes — The paper gives a reason why it holds.
It may state two separate claims as one.
- Rests on an assumption: The stem of a tract is the point of passage where all fibers pass through, and extracting streamlines passing through the stem yields the complete tract.
A result the paper reports from its own data — it cites no other source for it, so there is none to check. The quote shows it is in the paper.
In the paper
“in the middle temporal (0.05 and 0.04) and fusiform (0.05 and 0.03) gyri”
§ Cortical Terminations of the Inferior Fronto-Occipital and Uncinate Fasciculi: Anatomical Stem-Based Virtual Dissection > Results > Description of the Tracts
plain- Asserted: passes — The authors put it forward as true.
- Checkable: passes — It can be checked against evidence.
- Load-bearing: unclear — It is unclear whether the paper’s conclusions depend on it.
- Based: passes — The paper gives a reason why it holds.
It may state two separate claims as one.
A result the paper reports from its own data — it cites no other source for it, so there is none to check. The quote shows it is in the paper.
In the paper
“We observed a rightward lateralization of projections to the lateral frontal and occipital areas (inferior frontal, middle and inferior occipital gyri), and a leftward lateralization of projections to medial frontal and occipital areas (superior frontal, medial fronto-orbital, cuneus and lingual gyri) (Figure 7).”
§ Cortical Terminations of the Inferior Fronto-Occipital and Uncinate Fasciculi: Anatomical Stem-Based Virtual Dissection > Discussion > Asymmetry of Cortical IFOF Terminations
plaincorrelational- Asserted: passes — The authors put it forward as true.
- Checkable: passes — It can be checked against evidence.
- Load-bearing: passes — The paper’s conclusions depend on it.
- Based: passes — The paper gives a reason why it holds.
It may state two separate claims as one.
A result the paper reports from its own data — it cites no other source for it, so there is none to check. The quote shows it is in the paper.
In the paper
“We showed that the IFOF’s primary branch is clearly the inferior frontal subcomponent followed by the orbito-frontal subcomponent, with about equal density across the superior frontal and middle frontal subcomponents.”
§ Cortical Terminations of the Inferior Fronto-Occipital and Uncinate Fasciculi: Anatomical Stem-Based Virtual Dissection > Discussion > Cortical Terminations of the Stem-Based IFOF
boosted- Asserted: passes — The authors put it forward as true.
- Checkable: passes — It can be checked against evidence.
- Load-bearing: passes — The paper’s conclusions depend on it.
- Based: passes — The paper gives a reason why it holds.
It may state two separate claims as one.
A claim is checked only against the cited paper’s full text, never its abstract, and none is available for its sources.
In the paper
“We confirmed anterior UF terminations mainly within the medial and lateral orbito-frontal areas, and minor branches in the middle and inferior frontal and rectus gyri consistent with dissection and tractography studies”
§ Cortical Terminations of the Inferior Fronto-Occipital and Uncinate Fasciculi: Anatomical Stem-Based Virtual Dissection > Discussion > Cortical Terminations of the Stem-Based UF
What the sources say
plain- Asserted: passes — The authors put it forward as true.
- Checkable: passes — It can be checked against evidence.
- Load-bearing: passes — The paper’s conclusions depend on it.
- Based: passes — The paper gives a reason why it holds.
It may state two separate claims as one.
None of the sources cited for this claim have been checked yet.
In the paper
“In the temporal lobe, the IFOF projects to the superior and middle temporal gyri and to a lesser extent to the fusiform gyrus, confirming dissection studies (Crosby et al., 1962; Martino et al., 2010).”
§ Cortical Terminations of the Inferior Fronto-Occipital and Uncinate Fasciculi: Anatomical Stem-Based Virtual Dissection > Discussion > Cortical Terminations of the Stem-Based IFOF
What the sources say
- Not matchedcites Crosby et al., 1962
Couldn’t be matched to a paper in Crossref, so it can’t be checked.
- Not checked — no full text of the sourcecites Martino et al., 2010 source
plaincorrelational- Asserted: passes — The authors put it forward as true.
- Checkable: passes — It can be checked against evidence.
- Load-bearing: passes — The paper’s conclusions depend on it.
- Based: passes — The paper gives a reason why it holds.
It may state two separate claims as one.
- Not matched
A result the paper reports from its own data — it cites no other source for it, so there is none to check. The quote shows it is in the paper.
In the paper
“Nonetheless, thanks to the stem-based virtual dissection our approach allowed us to: (1) reproduce the consensus findings regarding IFOF and UF tract projections, and (2) provide clear evidence for more extensive projections beyond their conventional definitions”
§ Cortical Terminations of the Inferior Fronto-Occipital and Uncinate Fasciculi: Anatomical Stem-Based Virtual Dissection > Discussion > Methodological Limitations
boosteddirect- Asserted: passes — The authors put it forward as true.
- Checkable: passes — It can be checked against evidence.
- Load-bearing: passes — The paper’s conclusions depend on it.
- Based: passes — The paper gives a reason why it holds.
It may state two separate claims as one.
The paper states this without a source or data behind it here, so there is nothing to check it against. The quote shows it is in the paper.
In the paper
“This is especially noticeable for the IFOF, which presents the longest streamlines with the highest chance to cross other tracts.”
§ Cortical Terminations of the Inferior Fronto-Occipital and Uncinate Fasciculi: Anatomical Stem-Based Virtual Dissection > Discussion > Methodological Limitations
plaindirect- Asserted: passes — The authors put it forward as true.
- Checkable: passes — It can be checked against evidence.
- Load-bearing: passes — The paper’s conclusions depend on it.
- Based: passes — The paper gives a reason why it holds.
It may state two separate claims as one.
None of the sources cited for this claim have been checked yet.
In the paper
“We did not observe any projection to the cingulate gyrus, neither to the amygdala”
§ Cortical Terminations of the Inferior Fronto-Occipital and Uncinate Fasciculi: Anatomical Stem-Based Virtual Dissection > Discussion > Cortical Terminations of the Stem-Based UF
What the sources say
plain- Asserted: passes — The authors put it forward as true.
- Checkable: passes — It can be checked against evidence.
- Load-bearing: passes — The paper’s conclusions depend on it.
- Based: passes — The paper gives a reason why it holds.
It may state two separate claims as one.
In the paper
“Projections to the inferior occipital gyrus were observed, twice less in the left than in the right hemisphere, though it was reported in all subjects in a dissection study (Martino et al., 2010).”
§ Cortical Terminations of the Inferior Fronto-Occipital and Uncinate Fasciculi: Anatomical Stem-Based Virtual Dissection > Discussion > Cortical Terminations of the Stem-Based IFOF
What the sources say
- Not checked — no full text of the sourcecites Martino et al., 2010 source
plaincorrelational- Asserted: passes — The authors put it forward as true.
- Checkable: passes — It can be checked against evidence.
- Load-bearing: unclear — It is unclear whether the paper’s conclusions depend on it.
- Based: passes — The paper gives a reason why it holds.
It may state two separate claims as one.
A result the paper reports from its own data — it cites no other source for it, so there is none to check. The quote shows it is in the paper.
In the paper
“In terms of posterior density distribution, we showed that the IFOF projects mainly to the occipital lobe (especially the middle occipital and lingual gyri, with minor projections to the inferior occipital gyrus and cuneus), with minor projections to the temporal lobe (superior and middle temporal and fusiform gyri) as well as to the parietal lobe (superior parietal and angular gyri)”
§ Cortical Terminations of the Inferior Fronto-Occipital and Uncinate Fasciculi: Anatomical Stem-Based Virtual Dissection > Discussion > Cortical Terminations of the Stem-Based IFOF
boostedcorrelational- Asserted: passes — The authors put it forward as true.
- Checkable: passes — It can be checked against evidence.
- Load-bearing: passes — The paper’s conclusions depend on it.
- Based: passes — The paper gives a reason why it holds.
It may state two separate claims as one.
A result the paper reports from its own data — it cites no other source for it, so there is none to check. The quote shows it is in the paper.
In the paper
“Posteriorly, we observed occipital projections to the middle and inferior occipital gyri also consistent with the conventional definition of the IFOF, as well as additional terminations in the occipital (cuneus and lingual gyrus), temporal (superior and middle temporal gyri, fusiform gyrus) and parietal (superior parietal and angular gyri) cortices.”
§ Cortical Terminations of the Inferior Fronto-Occipital and Uncinate Fasciculi: Anatomical Stem-Based Virtual Dissection > Discussion > Cortical Terminations of the Stem-Based IFOF
plain- Asserted: passes — The authors put it forward as true.
- Checkable: passes — It can be checked against evidence.
- Load-bearing: passes — The paper’s conclusions depend on it.
- Based: passes — The paper gives a reason why it holds.
It may state two separate claims as one.
A result the paper reports from its own data — it cites no other source for it, so there is none to check. The quote shows it is in the paper.
In the paper
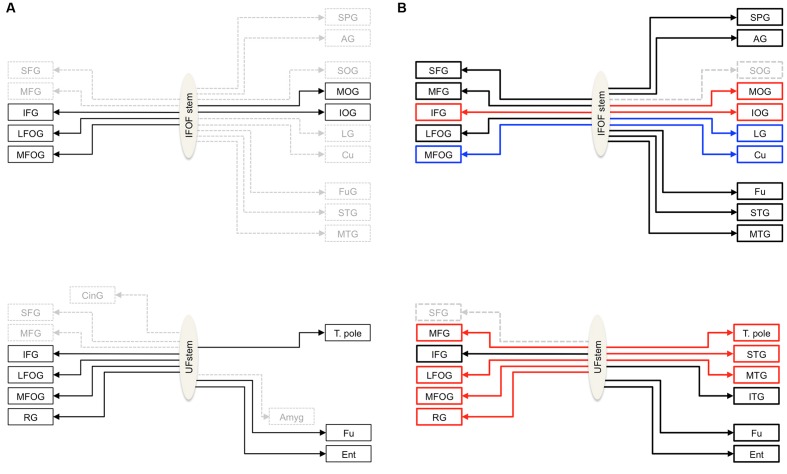
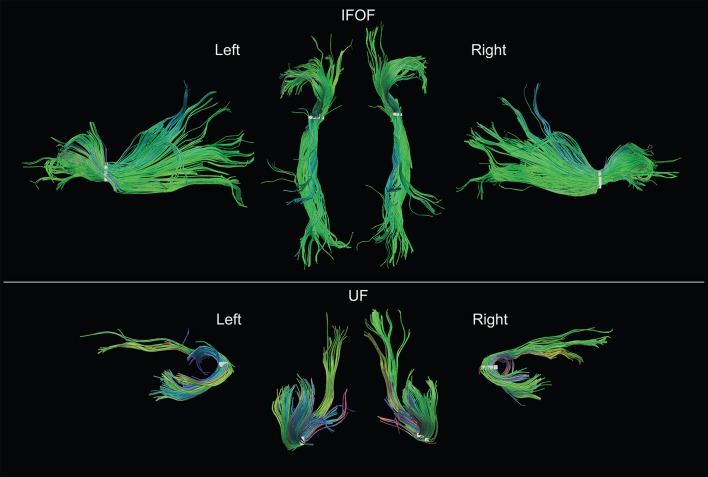
“By delineating anatomically both IFOF and UF stems, we minimized the constraints on the tract terminations and observed far more extensive projections than their conventional definitions (Figure 1B).”
§ Cortical Terminations of the Inferior Fronto-Occipital and Uncinate Fasciculi: Anatomical Stem-Based Virtual Dissection > Conclusion
plaindirect- Asserted: passes — The authors put it forward as true.
- Checkable: passes — It can be checked against evidence.
- Load-bearing: passes — The paper’s conclusions depend on it.
- Based: passes — The paper gives a reason why it holds.
It may state two separate claims as one.
None of the sources cited for this claim have been checked yet.
In the paper
“While these dissection studies confirmed the conventional definition of the respective tracts, they also revealed termination territories in more detail and beyond those previously described, suggesting more expansive definitions are needed.”
§ Cortical Terminations of the Inferior Fronto-Occipital and Uncinate Fasciculi: Anatomical Stem-Based Virtual Dissection > Introduction
hedgeddirect- Asserted: passes — The authors put it forward as true.
- Checkable: passes — It can be checked against evidence.
- Load-bearing: passes — The paper’s conclusions depend on it.
- Based: passes — The paper gives a reason why it holds.
It may state two separate claims as one.
The paper states this without a source or data behind it here, so there is nothing to check it against. The quote shows it is in the paper.
In the paper
“While the anatomical description of the UF has remained stable (connecting fronto-orbital cortices with the temporo-polar cortex)”
§ Cortical Terminations of the Inferior Fronto-Occipital and Uncinate Fasciculi: Anatomical Stem-Based Virtual Dissection > Introduction
plaincorrelational- Asserted: passes — The authors put it forward as true.
- Checkable: passes — It can be checked against evidence.
- Load-bearing: fails — The paper’s conclusions may not depend on it.
- Based: fails — The paper may give no reason why it holds.
Probably not a substantial claim. The paper’s conclusions may not depend on it. The paper may give no reason why it holds.
A claim is checked only against the cited paper’s full text, never its abstract, and none is available for its sources.
In the paper
“The consensus on the UF is that it connects, along with the fronto-orbital and temporo-polar cortices, ventral temporal areas (Ebeling and von Cramon, 1992; Catani and Thiebaut de Schotten, 2008).”
§ Cortical Terminations of the Inferior Fronto-Occipital and Uncinate Fasciculi: Anatomical Stem-Based Virtual Dissection > Introduction
What the sources say
boostedcorrelational- Asserted: passes — The authors put it forward as true.
- Checkable: passes — It can be checked against evidence.
- Load-bearing: fails — The paper’s conclusions may not depend on it.
- Based: passes — The paper gives a reason why it holds.
Probably not a substantial claim. The paper’s conclusions may not depend on it.
None of the sources cited for this claim have been checked yet.
In the paper
“the IFOF connects the ventral occipital cortex with the inferior frontal and fronto-orbital cortices”
§ Cortical Terminations of the Inferior Fronto-Occipital and Uncinate Fasciculi: Anatomical Stem-Based Virtual Dissection > Introduction
What the sources say
plaincorrelational- Asserted: passes — The authors put it forward as true.
- Checkable: passes — It can be checked against evidence.
- Load-bearing: passes — The paper’s conclusions depend on it.
- Based: passes — The paper gives a reason why it holds.
Probably not a substantial claim.
A claim is checked only against the cited paper’s full text, never its abstract, and none is available for its sources.
In the paper
“However, they are clearly distinct at the level of the stem and can be separated by a notable cleavage line (Curran, 1909; Kier et al., 2004; Martino et al., 2010; Sarubbo et al., 2013).”
§ Cortical Terminations of the Inferior Fronto-Occipital and Uncinate Fasciculi: Anatomical Stem-Based Virtual Dissection > Discussion
What the sources say
boosted- Asserted: passes — The authors put it forward as true.
- Checkable: passes — It can be checked against evidence.
- Load-bearing: passes — The paper’s conclusions depend on it.
- Based: passes — The paper gives a reason why it holds.
It may state two separate claims as one.
A conclusion the paper draws from its own results — it cites no other source for it, so there is none to check. The quote shows it is in the paper.
In the paper
“In both tracts, we consistently observed more extensive termination territories than their conventional definitions, within the middle and superior frontal, superior parietal and angular gyri for the IFOF and the middle frontal gyrus and superior, middle and inferior temporal gyri beyond the temporal pole for the UF.”
§ Cortical Terminations of the Inferior Fronto-Occipital and Uncinate Fasciculi: Anatomical Stem-Based Virtual Dissection > Abstract
plainn = 60- Asserted: passes — The authors put it forward as true.
- Checkable: passes — It can be checked against evidence.
- Load-bearing: passes — The paper’s conclusions depend on it.
- Based: passes — The paper gives a reason why it holds.
It may state two separate claims as one.
- Rests on an assumption: The stem of a tract is the point of passage where all fibers pass through, and extracting streamlines passing through the stem yields the complete tract.
- Rests on an assumption: The precentral and superior parietal gyri contain no true terminations of IFOF and UF, respectively, and can serve as false positive regions for thresholding.
What the paper did — it cites no source for this, so there is none to check. The quote shows it is in the paper.
In the paper
“The mean Euclidean distances between the stems drawn by the two operators was 1.7 ± 0.8 mm and 1.9 ± 0.8 mm for the left and right IFOF stems and was 1.4 ± 1.1 mm and 1.4 ± 0.9 for the left and right UF stems, distances below the 2-mm voxel resolution at which our stems were drawn.”
§ Cortical Terminations of the Inferior Fronto-Occipital and Uncinate Fasciculi: Anatomical Stem-Based Virtual Dissection > Results > Inter-operator Reliability to Delineate the IFOF and UF Stems
plain- Asserted: passes — The authors put it forward as true.
- Checkable: passes — It can be checked against evidence.
- Load-bearing: passes — The paper’s conclusions depend on it.
- Based: passes — The paper gives a reason why it holds.
It may state two separate claims as one.
What the paper did — it cites no source for this, so there is none to check. The quote shows it is in the paper.
In the paper
“The delineation of the stems was consistent between operators both in terms of volumes and mean centers of mass (Table 1).”
§ Cortical Terminations of the Inferior Fronto-Occipital and Uncinate Fasciculi: Anatomical Stem-Based Virtual Dissection > Results > Inter-operator Reliability to Delineate the IFOF and UF Stems
plain- Asserted: passes — The authors put it forward as true.
- Checkable: passes — It can be checked against evidence.
- Load-bearing: passes — The paper’s conclusions depend on it.
- Based: passes — The paper gives a reason why it holds.
It may state two separate claims as one.
What the paper did — it cites no source for this, so there is none to check. The quote shows it is in the paper.
In the paper
“The mean differences of volume between operators were between 6 and 9 mm3 for left and right IFOF stems and between 7 and 8 mm3 for left and right UF stems, which corresponds approximately to a difference of one voxel (8 mm3) and was not significant between operators (all Student’s t-tests, p > 0.05).”
§ Cortical Terminations of the Inferior Fronto-Occipital and Uncinate Fasciculi: Anatomical Stem-Based Virtual Dissection > Results > Inter-operator Reliability to Delineate the IFOF and UF Stems
plain- Asserted: passes — The authors put it forward as true.
- Checkable: passes — It can be checked against evidence.
- Load-bearing: passes — The paper’s conclusions depend on it.
- Based: passes — The paper gives a reason why it holds.
It may state two separate claims as one.
A conclusion the paper draws from its own results — it cites no other source for it, so there is none to check. The quote shows it is in the paper.
In the paper
“These differences may be due in part to the difference in templates used to register the terminations (they used the Freesurfer Desikan-Kyliany atlas whereas we used the JHU atlas).”
§ Cortical Terminations of the Inferior Fronto-Occipital and Uncinate Fasciculi: Anatomical Stem-Based Virtual Dissection > Discussion > Cortical Terminations of the Stem-Based IFOF
hedgedconditional- Asserted: passes — The authors put it forward as true.
- Checkable: passes — It can be checked against evidence.
- Load-bearing: fails — The paper’s conclusions may not depend on it.
- Based: passes — The paper gives a reason why it holds.
Probably not a substantial claim. The paper’s conclusions may not depend on it.
A conclusion the paper draws from its own results — it cites no other source for it, so there is none to check. The quote shows it is in the paper.
In the paper
“The prominence of the inferior frontal and orbito-frontal terminations may explain why these regions are consistently observed in the literature.”
§ Cortical Terminations of the Inferior Fronto-Occipital and Uncinate Fasciculi: Anatomical Stem-Based Virtual Dissection > Discussion > Cortical Terminations of the Stem-Based IFOF
hedgedconditional- Asserted: passes — The authors put it forward as true.
- Checkable: fails — It may be too vague to check against evidence.
- Load-bearing: fails — The paper’s conclusions may not depend on it.
- Based: passes — The paper gives a reason why it holds.
Probably not a substantial claim. It may be too vague to check against evidence. The paper’s conclusions may not depend on it.
A conclusion the paper draws from its own results — it cites no other source for it, so there is none to check. The quote shows it is in the paper.
In the paper
“This may also be due to technical limitations arising from the tractography method since it is farther and may require tracking through areas of crossings.”
§ Cortical Terminations of the Inferior Fronto-Occipital and Uncinate Fasciculi: Anatomical Stem-Based Virtual Dissection > Discussion > Cortical Terminations of the Stem-Based IFOF
hedgedconditional- Asserted: passes — The authors put it forward as true.
- Checkable: passes — It can be checked against evidence.
- Load-bearing: fails — The paper’s conclusions may not depend on it.
- Based: fails — The paper may give no reason why it holds.
Probably not a substantial claim. The paper’s conclusions may not depend on it. The paper may give no reason why it holds. It may state two separate claims as one.
A conclusion the paper draws from its own results — it cites no other source for it, so there is none to check. The quote shows it is in the paper.
In the paper
“It could also be that the superior frontal streamlines densities may be underrepresented given the limitations of the tractography method mentioned above.”
§ Cortical Terminations of the Inferior Fronto-Occipital and Uncinate Fasciculi: Anatomical Stem-Based Virtual Dissection > Discussion > Cortical Terminations of the Stem-Based IFOF
hedgedconditional- Asserted: passes — The authors put it forward as true.
- Checkable: passes — It can be checked against evidence.
- Load-bearing: fails — The paper’s conclusions may not depend on it.
- Based: passes — The paper gives a reason why it holds.
Probably not a substantial claim. The paper’s conclusions may not depend on it.
A conclusion the paper draws from its own results — it cites no other source for it, so there is none to check. The quote shows it is in the paper.
In the paper
“Moreover the large variability observed in the frequency of projections among subjects in these areas are likely to be due to such limitations and thus their densities may also be underrepresented.”
§ Cortical Terminations of the Inferior Fronto-Occipital and Uncinate Fasciculi: Anatomical Stem-Based Virtual Dissection > Discussion > Methodological Limitations
hedgedconditional- Asserted: passes — The authors put it forward as true.
- Checkable: passes — It can be checked against evidence.
- Load-bearing: unclear — It is unclear whether the paper’s conclusions depend on it.
- Based: passes — The paper gives a reason why it holds.
It may state two separate claims as one.
A conclusion the paper draws from its own results — it cites no other source for it, so there is none to check. The quote shows it is in the paper.
In the paper
“Thus areas of intersecting/overlapping/bordering pathways will greatly affect the tracking process and cause it to stop, producing broken streamlines.”
§ Cortical Terminations of the Inferior Fronto-Occipital and Uncinate Fasciculi: Anatomical Stem-Based Virtual Dissection > Discussion > Methodological Limitations
boosteddirect- Asserted: passes — The authors put it forward as true.
- Checkable: passes — It can be checked against evidence.
- Load-bearing: passes — The paper’s conclusions depend on it.
- Based: passes — The paper gives a reason why it holds.
It may state two separate claims as one.
A conclusion the paper draws from its own results — it cites no other source for it, so there is none to check. The quote shows it is in the paper.
In the paper
“This may be due to possible crossings with other prominent tracts (inferior longitudinal, vertical occipital fasciculi) in the occipital lobe, especially for the left hemisphere.”
§ Cortical Terminations of the Inferior Fronto-Occipital and Uncinate Fasciculi: Anatomical Stem-Based Virtual Dissection > Discussion > Cortical Terminations of the Stem-Based IFOF
hedgedconditional- Asserted: passes — The authors put it forward as true.
- Checkable: passes — It can be checked against evidence.
- Load-bearing: fails — The paper’s conclusions may not depend on it.
- Based: fails — The paper may give no reason why it holds.
Probably not a substantial claim. The paper’s conclusions may not depend on it. The paper may give no reason why it holds.
In the paper
“The medial occipital cortex (cuneus and lingual gyrus) are not often cited as a termination territory of the IFOF possibly be due to a lack of anatomical specificity in some of the earlier descriptions of the tract, with its first mention appearing late in the literature (Crosby et al., 1962).”
§ Cortical Terminations of the Inferior Fronto-Occipital and Uncinate Fasciculi: Anatomical Stem-Based Virtual Dissection > Discussion > Cortical Terminations of the Stem-Based IFOF
What the sources say
- Not matchedcites Crosby et al., 1962
Couldn’t be matched to a paper in Crossref, so it can’t be checked.
hedgedconditional- Asserted: passes — The authors put it forward as true.
- Checkable: passes — It can be checked against evidence.
- Load-bearing: fails — The paper’s conclusions may not depend on it.
- Based: passes — The paper gives a reason why it holds.
Probably not a substantial claim. The paper’s conclusions may not depend on it. It may state two separate claims as one.
- Not matched
A conclusion the paper draws from its own results — it cites no other source for it, so there is none to check. The quote shows it is in the paper.
In the paper
“Note that the hook-shaped pattern of these posterior temporal streamlines looks more like UF than IFOF streamlines, which led us to consider them as belonging to the UF.”
§ Cortical Terminations of the Inferior Fronto-Occipital and Uncinate Fasciculi: Anatomical Stem-Based Virtual Dissection > Discussion > Cortical Terminations of the Stem-Based UF
plaindirect- Asserted: passes — The authors put it forward as true.
- Checkable: passes — It can be checked against evidence.
- Load-bearing: passes — The paper’s conclusions depend on it.
- Based: passes — The paper gives a reason why it holds.
It may state two separate claims as one.
A conclusion the paper draws from its own results — it cites no other source for it, so there is none to check. The quote shows it is in the paper.
In the paper
“In addition, the quantitative information available through diffusion imaging provides not only tract-specific but branch-specific measures of the tracts providing better specificity that can be correlated with behavioral measures or patient populations.”
§ Cortical Terminations of the Inferior Fronto-Occipital and Uncinate Fasciculi: Anatomical Stem-Based Virtual Dissection > Conclusion
plaincorrelational- Asserted: passes — The authors put it forward as true.
- Checkable: passes — It can be checked against evidence.
- Load-bearing: passes — The paper’s conclusions depend on it.
- Based: passes — The paper gives a reason why it holds.
Probably not a substantial claim. It may state two separate claims as one.
The paper relies on this without support.
The stem of a tract is the point of passage where all fibers pass through, and extracting streamlines passing through the stem yields the complete tract.
“we adopted the approach of neuroanatomists who first locate the stem, which is the point of passage where all fibers pass through, as an anatomical reference to identify the tract.”
The paper relies on this without support.
The precentral and superior parietal gyri contain no true terminations of IFOF and UF, respectively, and can serve as false positive regions for thresholding.
“The precentral and superior parietal gyri were chosen as the regions containing false positives (FP_REG) for the IFOF and UF, respectively.”
The paper relies on this without support.
The posterior projections of the IFOF pass through the inferior longitudinal fasciculus within the temporal lobe to reach the middle occipital gyrus.
“Similarly the posterior projections of the IFOF need to pass through the inferior longitudinal fasciculus within the temporal lobe in order to reach the middle occipital gyrus.”
Self-check
Percentages, sums and reported differences re-computed from the paper’s own numbers.
Each contradiction between two passages listed here was confirmed by an independent check.
Rated major: it would touch a result — a value a result rests on, reported and recomputed p-values on opposite sides of the significance level, two passages that conflict with no sign which is right, or a cited work retracted before this paper was published.
In the paper
§ Cortical Terminations of the Inferior Fronto-Occipital and Uncinate Fasciculi: Anatomical Stem-Based Virtual Dissection > Results > Description of the Tracts
“Posteriorly, the UF projects in a graded manner with the largest portion in the temporal pole (0.25 and 0.47), followed by the superior temporal (0.16 and 0.36) and middle temporal (0.09 and 0.14) gyri and with minor branches in the inferior temporal (0.04 bilaterally), fusiform (0.03 and 0.05) and entorhinal (0.03 and 0.05) gyri.”
§ Cortical Terminations of the Inferior Fronto-Occipital and Uncinate Fasciculi: Anatomical Stem-Based Virtual Dissection > Materials and Methods > Analysis of the IFOF and UF Cortical Terminations
“An individual normalized termination density score (NTDS) was obtained for each region by dividing the total number of tract streamlines ending in it by the total number of left and right tract streamlines for IFOF and UF, respectively.”
Rated minor: it would not touch a result — a value no result rests on, a p-value that stays on the same side of the significance level, or a conflict that is clerical, resolved elsewhere in the paper, or outside its own findings.
In the paper
§ Cortical Terminations of the Inferior Fronto-Occipital and Uncinate Fasciculi: Anatomical Stem-Based Virtual Dissection > Discussion > Cortical Terminations of the Stem-Based IFOF
“Projections to the cuneus were infrequent in the right hemisphere (present in 15 vs. 38% in the left hemisphere) showing the opposite pattern of Caverzasi et al. (2014)”
§ Cortical Terminations of the Inferior Fronto-Occipital and Uncinate Fasciculi: Anatomical Stem-Based Virtual Dissection > Discussion > Cortical Terminations of the Stem-Based IFOF
“who reported more subjects in the left than in the right hemispheres.”
Citations
Cites
Advances in functional and structural MR image analysis and implementation as FSL
Smith, S. M., Jenkinson, M., Woolrich, M. W., Beckmann, C. F., Behrens, T. E. J., Johansen-Berg, H., Bannister, P. R., De Luca, M., Drobnjak, I., Flitney, D. E., et al. (2004) · NeuroImage · doi:10.1016/j.neuroimage.2004.07.051 · Cited by 13,630 · cited 2×
“The raw diffusion images were corrected for eddy current distortion using the FMRIB Software Library (Smith et al., 2004) and processed with the Diffusion Toolkit software package to obtain the local tensor orientation estimates and fractional anisotropy maps and perform fiber tracking (Figure 2, top row).”
MethodFiber Tract–based Atlas of Human White Matter Anatomy
Wakana, S., Jiang, H., Nagae‐Poetscher, L. M., van Zijl, P. C. M., & Mori, S. (2004) · Radiology · doi:10.1148/radiol.2301021640 · Cited by 2,023
A diffusion tensor imaging tractography atlas for virtual in vivo dissections.
CATANI, M., & THIEBAUTDESCHOTTEN, M. (2008) · Cortex · doi:10.1016/j.cortex.2008.05.004 · Cited by 1,642 · cited 6×
“…segmentation approaches rely heavily on a priori knowledge, using set-of-ROIs strategies that place the ROIs around their known terminal areas or areas of passage (Catani and Thiebaut de Schotten, 2008; Zhang et al., 2010), our stem-based virtual dissection results in more extensive IFOFs and UFs.”
BackgroundMethodInfluentialVirtual in vivo interactive dissection of white matter fasciculi in the human brain
Catani, M., Howard, R. J., Pajevic, S., & Jones, D. K. (2002) · NeuroImage · doi:10.1006/nimg.2002.1136 · Cited by 1,637 · cited 8×
“While current tract segmentation approaches rely heavily on a priori knowledge, using set-of-ROIs strategies that place the ROIs around their known terminal areas or areas of passage (Catani and Thiebaut de Schotten, 2008; Zhang et al., 2010), our stem-based virtual dissection results in more extensive IFOFs and UFs.”
InfluentialMRtrix: Diffusion tractography in crossing fiber regions
Tournier, J., Calamante, F., & Connelly, A. (2012) · International Journal of Imaging Systems and Technology · doi:10.1002/ima.22005 · Cited by 1,370
Schmahmann, J. D., & Pandya, D. N. (2006) · doi:10.1093/acprof:oso/9780195104233.001.0001 · Cited by 1,157
MRI atlas of human white matter
Ling, C. L., & Rumpel, H. (2006) · Concepts in Magnetic Resonance Part A · doi:10.1002/cmr.a.20052 · Cited by 1,021
Turken, A. U., & Dronkers, N. F. (2011) · Frontiers in System Neuroscience · doi:10.3389/fnsys.2011.00001 · Cited by 1,012 · cited 1×
“…for the ventral intra-hemispheric transfer of information between the frontal cortex and the occipital, temporal and parietal cortices, and knowing their cortical terminations is fundamental for understanding their role in mediating language semantics (Turken and Dronkers, 2011; Duffau, 2015).”
BackgroundDissecting the uncinate fasciculus: disorders, controversies and a hypothesis.
Von Der Heide, R. J., Skipper, L. M., Klobusicky, E., & Olson, I. R. (2013) · Brain · doi:10.1093/brain/awt094 · Cited by 829 · cited 2×
“There has been no detailed study of the UF terminations using tractography (Von Der Heide et al., 2013).”
BackgroundDeterministic and probabilistic tractography based on complex fibre orientation distributions
Descoteaux, M., Deriche, R., Knosche, T. R., & Anwander, A. (2009) · IEEE Transactions on Medical Imaging · doi:10.1109/tmi.2008.2004424 · Cited by 698 · cited 1×
“Note that, in future studies, using more advanced tractography methods such as higher-order modeling (Descoteaux et al., 2009; Tournier et al., 2012) and anatomically constrained tracking (Girard et al., 2014) will help to prevent broken streamlines and enable the study of their whole connectional…”
Background
Research works printed but not linked: 5
- Burdach, Vom Baue und Leben des Gehirns und Rückenmark., 1819
- Dejerine, 1895, Anatomie des Centres Nerveux. Tome 1.
- Reil, 1809, Die Sylvische Grube oder das Thal, das gestreifte grobe hirnganglium, dessen kapsel und die seitentheile des grobn gehirns., Arch. Physiol., 9, 195
- Trolard, 1906, Le faisceau longitudinal inférieur du cerveau., Rev. Neurol., 14, 440
- Wang, 2007, Diffusion toolkit: a software package for diffusion imaging data processing and tractography, Proceedings of the International Society for Magnetic Resonance in Medicine
Cited by
Sorted by citations
Tractography-based connectomes are dominated by false-positive connections
Maier-Hein, K. H., Neher, P., Houde, J.-C., Côté, M.-A., Garyfallidis, E., Zhong, J., Chamberland, M., Yeh, F.-C., Lin, Y.-C., Ji, Q., et al. (2016) · doi:10.1101/084137 · Cited by 1,376
Self-citationFibre-specific white matter reductions in Alzheimer’s disease and mild cognitive impairment
Mito, R., Raffelt, D., Dhollander, T., Vaughan, D. N., Tournier, J.-D., Salvado, O., Brodtmann, A., Rowe, C. C., Villemagne, V. L., & Connelly, A. (2018) · Brain · doi:10.1093/brain/awx355 · Cited by 309
“Degeneration of the inferior fronto-occipital fascic- ulus could also be associated with disconnections to DMN regions such as the angular gyrus to which it is believed to connect (Hau et al., 2016).”
BackgroundXTRACT - Standardised protocols for automated tractography in the human and macaque brain
Warrington, S., Bryant, K. L., Khrapitchev, A., Sallet, J., Charquero-Ballester, M., Douaud, G., Jbabdi, S., Mars, R., & Sotiropoulos, S. (2020) · NeuroImage · doi:10.1016/j.neuroimage.2020.116923 · Cited by 293
“…automated ROI-based tractography approaches have proven powerful in the extraction of a range of tracts (Catani et al., 2012; Eichert et al., 2019b; Hau et al., 2016; Hecht et al., 2015; Howells et al., 2018; Maffei et al., 2019; Makris et al., 2013, 2009; Menjot de Champ fl eur et al., 2013;…”
BackgroundMethodResultHerbet, G., & Duffau, H. (2020) · Physiological Reviews · doi:10.1152/physrev.00033.2019 · Cited by 321
Garyfallidis, E., Côté, M.-A., Rheault, F., Sidhu, J., Hau, J., Petit, L., Fortin, D., Cunanne, S., & Descoteaux, M. (2018) · NeuroImage · doi:10.1016/j.neuroimage.2017.07.015 · Cited by 279
Self-citation
Metadata
- Authors
- Hau, J., Sarubbo, S., Perchey, G., Crivello, F., Zago, L., Mellet, E., Jobard, G., Joliot, M., Mazoyer, B. M., Tzourio-Mazoyer, N., & Petit, L.
- Affiliations
- Centre National de la Recherche Scientifique (FR)
- Ospedale Santa Chiara (IT)
- Corresponding author
- Petit, Laurent
- ORCID
- Venue
- Frontiers in Neuroanatomy
- Publisher
- Frontiers Media SA
- Published
- 2016-05-24
- Volume
- 10
- Pages
- 58-58
- ISSN
- 1662-5129 (ISSN-L)
- PMC
- PMC4877506
- OpenAlex
- W2401804202
- Semantic Scholar
- f35b01547d5fb73b199505278b89977ed455f872
- Cited by
- 142
- References
- 41
- Citations by year
- 2026: 4 · 2025: 12 · 2024: 11 · 2023: 9 · 2022: 16 · 2021: 25 · 2020: 20 · 2019: 13 · 2018: 15 · 2017: 15 · 2016: 2
- FWCI
- 11.82
- Type
- journal article
- Language
- en
- Open access
- gold
- doi.org
- Licence
- cc-by
- Locations
- Frontiers in Neuroanatomy (publishedVersion, cc-by)
- PubMed (publishedVersion)
- Institutional Research Information System (Università degli Studi di Trento) (submittedVersion, cc-by)
- Europe PMC (PubMed Central) (submittedVersion, cc-by)
- PubMed Central (submittedVersion, cc-by)
- HAL (Le Centre pour la Communication Scientifique Directe) (submittedVersion, cc-by)
- Funders
- Agence Nationale de la Recherche (10-LABX-57, ANR-10LABX-57, ANR-10, ANR-10-LABX)
- Topics
- Health Sciences › Medicine › Radiology, Nuclear Medicine and Imaging › Advanced Neuroimaging Techniques and Applications
- Health Sciences › Medicine › Anatomy › Classical Anatomy and Histology
- Life Sciences › Neuroscience › Cognitive Neuroscience › Functional Brain Connectivity Studies
- Keywords
- inferior fronto-occipital fasciculus, uncinate fasciculus, association tracts, hemispheric lateralization, white matter tracts, diffusion tractography
About these checks
Registry, retraction, Cites and statistics results are computed, not judged, with one exception: a printed reference that no index lists is read once by a model before it counts as a citation error. Claims are extracted by a model and kept only when their quote appears verbatim in the text; each cited source is then checked, with a model’s help, for whether it says what the claim relies on. Those verdicts can be wrong — read the claim’s quote and the cited source before relying on one.
A language model drew the claims from the paper on 2026-10-18, under version 3 of the claim definition (model deepseek-v4.1-flash, prompt extract-v3).
A second model labelled each claim on 2026-10-18 (model jev-1.13-20260917, definition revision gold-guideline-v0.2).
Cited sources are checked with a language model’s help (gpt-6-sol).
Statistics and arithmetic are recomputed, not judged.
Confidence bands are shown only for fields calibrated on our annotated test set. None is calibrated yet, so no band is shown.
What counts as a claim ›How we measure confidence ›How we check this ›
Are you an author, or do you see a problem with this page? Request a review
