

The DOI matches its Crossref record; 60 of the 60 references it cites were found in a registry or an index; none of the 30 sources its claims cite is checked for support yet.
The effect of nutrition education sessions on energy availability, body composition, eating attitude and sports nutrition knowledge in young female endurance athletes
Open accessAbstract
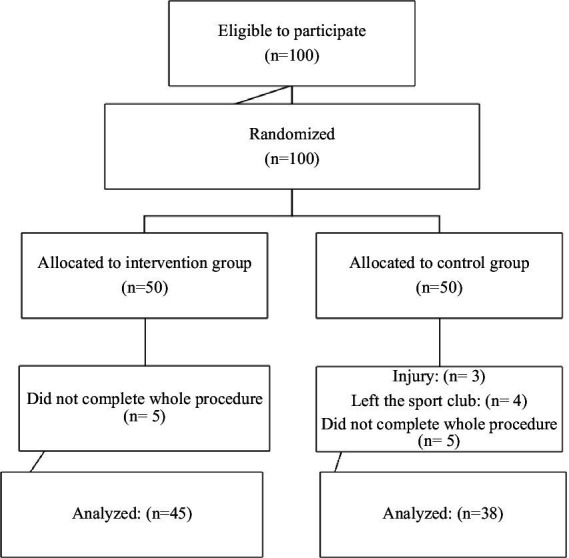
Nutrition knowledge plays a pivotal role in shaping dietary habits and food choices, particularly in the realm of sports nutrition. This study investigates the effects of a series of nutrition education sessions conducted by a registered dietitian on energy availability, various anthropometric measurements, eating attitudes, and sports nutrition knowledge in young female endurance athletes aged 15–18 years (football, basketball, volleyball) who engage in training for more than 10 h per week ( n = 83). Participants were randomly divided into two groups with 45 individuals receiving six physical nutrition education lectures, and the remaining 38 participants receiving no nutrition education. Participants completed the low energy availability in females questionnaire (LEAF-Q), Eating Attitude Test (EAT-26), and Sports Nutrition Knowledge Questionnaire (SNKQ). Energy and nutrient intakes were evaluated through 3-day food records, while exercise energy expenditure was assessed using 3-day activity logs. All of the questionnaires were repeated after 6 months. At baseline, the prevalence of LEA among athletes was determined to be 63.8%. In the intervention group, energy availability (EA) and SNKQ scores increased, and LEAF-Q scores decreased significantly ( p < 0.05). However, there was no significant change in EAT-26 scores between the two groups. Energy intake, weight, fat-free mass, and resting metabolic rate have been increased significantly in the intervention group ( p < 0,05). These findings suggest that nutrition education proves beneficial in enhancing dietary intake, positively influencing body composition, and improving nutrition knowledge, ultimately contributing to increased energy availability in female athletes over the short term.
Overview
CoChat Summary
TL;DR
In a randomized controlled trial with 83 adolescent female team-sport athletes, six dietitian-led nutrition education sessions improved sports nutrition knowledge and energy availability and lowered LEAF-Q risk scores over 6 months, but did not change EAT-26 eating-attitude scores. Baseline low energy availability prevalence was high (63.8% overall).
Key findings
- Baseline LEA prevalence was 63.8% overall; by group, 73.3% in the intervention and 52.6% in the control. After the intervention, LEA fell to 46.7% (n = 21) in the intervention group, while the text reports it remained 52.6% (n = 22) in the control group.
- In the intervention group, energy availability increased from 24.11 ± 10.69 to 32.24 ± 12.14 kcal/kg FFM, SNKQ scores increased from 29.18 ± 8.60 to 35.29 ± 7.17, and LEAF-Q scores decreased from 8.57 ± 4.36 to 6.82 ± 3.72 (p < 0.05). EAT-26 showed no significant group-by-time interaction (F = 0.21, p = 0.65).
- Energy intake increased in the intervention group from 1739.7 ± 396.6 to 2046.1 ± 448 kcal; protein from 70.66 ± 22.06 to 84.76 ± 22.53 g; carbohydrate from 184.36 ± 54.65 to 228.04 ± 57.09 g; and fat from 76.52 ± 33.64 to 82.80 ± 25.91 g. BMI and fat mass showed significant group-by-time increases in the intervention group: BMI 20.81 ± 2.16 to 21.23 ± 1.99, and fat mass 11.64 ± 4.59 to 12.05 ± 4.65 kg.
- SNKQ improvement was reported as 7.2%; post-intervention scores remained below 50% in both groups (discussion reports control 27.0/32.5% and intervention 35.3/34.9%, with a total score of 78, though methods state a maximum total score of 83).
Methods
- Randomized clinical trial (NCT06116097) with a control group, conducted in Istanbul, Turkey; data collection occurred from August 2019 to February 2020. Of 100 initially included adolescent female athletes, 17 were excluded, leaving 83 analyzed, aged 15–18 years (mean 17.2 ± 2.0; football n = 34, basketball n = 16, volleyball n = 33) who trained more than 10 h per week. Participants were randomly assigned to six weekly 60-min face-to-face nutrition education sessions led by a registered dietitian (n = 45) or no nutrition education (n = 38 per abstract/Table 1; methods text says n = 33).
- Measures included the LEAF-Q, EAT-26, and SNKQ; 3-day food records; 3-day activity logs; and bioelectrical impedance for body composition. Energy availability was calculated as (EI − EEE) / FFM, and resting metabolic rate was estimated using the Cunningham equation. Main analysis used mixed-model ANOVA with Bonferroni post hoc comparisons and partial eta-squared effect sizes.
Limitations
- Stated in the paper: self-reported dietary intake may be underreported, potentially overestimating LEA prevalence; the 3-day monitoring period may not reflect normal dietary habits and activity levels across the season; exercise energy expenditure was estimated from MET-based activity logs rather than indirect calorimetry or accelerometers; future work should also assess trainers’ nutrition knowledge.
- Evident from the text: the control-group size is inconsistent (abstract/Table 1 n = 38 vs methods text n = 33); the post-intervention control LEA percentage is inconsistent (text 52.6% vs Table 4 EA ≤ 30 row 57.8%); the SNKQ maximum total score is inconsistent (methods 83 vs discussion 78); and the abstract reports significant increases in weight, fat-free mass, and resting metabolic rate in the intervention group, but Table 2 shows no significant group-by-time interaction for FFM or RMR (RMR time p = 0.07).
Model-written summary. Check it against the paper before relying on it.
Integrity signals
Registry
Cites
Statistics
Figures
Verification
Claims the paper makes
0 Valid · 0 Not valid · 21 Not checked · 64 Own results and interpretations
A result the paper reports from its own data — it cites no other source for it, so there is none to check. The quote shows it is in the paper.
In the paper
“Additionally, there was no group-by-time interaction for Body Fat Percentage, FFM, RMR, and TEE.”
§ The effect of nutrition education sessions on energy availability, body composition, eating attitude and sports nutrition knowledge in young female endurance athletes > Results
plain- Asserted: passes — The authors put it forward as true.
- Checkable: passes — It can be checked against evidence.
- Load-bearing: unclear — It is unclear whether the paper’s conclusions depend on it.
- Based: passes — The paper gives a reason why it holds.
A result the paper reports from its own data — it cites no other source for it, so there is none to check. The quote shows it is in the paper.
In the paper
“However, there was no significant change in EAT-26 scores between the two groups.”
§ The effect of nutrition education sessions on energy availability, body composition, eating attitude and sports nutrition knowledge in young female endurance athletes > Abstract
plain- Asserted: passes — The authors put it forward as true.
- Checkable: passes — It can be checked against evidence.
- Load-bearing: unclear — It is unclear whether the paper’s conclusions depend on it.
- Based: passes — The paper gives a reason why it holds.
A result the paper reports from its own data — it cites no other source for it, so there is none to check. The quote shows it is in the paper.
In the paper
“In the intervention group, energy availability (EA) and SNKQ scores increased, and LEAF-Q scores decreased significantly (p < 0.05).”
§ The effect of nutrition education sessions on energy availability, body composition, eating attitude and sports nutrition knowledge in young female endurance athletes > Abstract
plainstates a causen = 45- Asserted: passes — The authors put it forward as true.
- Checkable: passes — It can be checked against evidence.
- Load-bearing: passes — The paper’s conclusions depend on it.
- Based: passes — The paper gives a reason why it holds.
A result the paper reports from its own data — it cites no other source for it, so there is none to check. The quote shows it is in the paper.
In the paper
“Similarly, a significant group-by-time interaction effect was found for carbohydrate intake (F (1,81) = 6.48, p < 0.05, Partial Eta Squared = 0.07; medium). Following Bonferroni correction for pairwise comparisons, it was observed that carbohydrate intake in the experimental group increased from pre-intervention (184.36 ± 54.65) g to post-intervention (228.04 ± 57.09) g (p = 0.01).”
§ The effect of nutrition education sessions on energy availability, body composition, eating attitude and sports nutrition knowledge in young female endurance athletes > Results
plainstates a cause- Asserted: passes — The authors put it forward as true.
- Checkable: passes — It can be checked against evidence.
- Load-bearing: passes — The paper’s conclusions depend on it.
- Based: passes — The paper gives a reason why it holds.
A result the paper reports from its own data — it cites no other source for it, so there is none to check. The quote shows it is in the paper.
In the paper
“In the intervention group, energy availability (EA) and SNKQ scores increased, and LEAF-Q scores decreased significantly (p < 0.05).”
- Also stated in: § Results · plain
“A significant group-by-time interaction effect was found for EA (F (1,81) = 13.53; p < 0.05, Partial Eta Squared = 0.14; large). Following Bonferroni correction for pairwise comparisons, it was observed that EA in the experimental group increased from pre-intervention (24.11 ± 10.69) to post-intervention (32.24 ± 12.14) (p = 0.01).”
§ The effect of nutrition education sessions on energy availability, body composition, eating attitude and sports nutrition knowledge in young female endurance athletes > Abstract
plainstates a causen = 45- Asserted: passes — The authors put it forward as true.
- Checkable: passes — It can be checked against evidence.
- Load-bearing: passes — The paper’s conclusions depend on it.
- Based: passes — The paper gives a reason why it holds.
- Also stated in: § Results · plain
55 more claims
Create a free account to see all 85 claims and to verify the 30 references still open.
- It may state two separate claims as one. 13
- Probably not a substantial claim. 16
Claims other papers make about this one
Each is checked against this paper’s own text: does it say what the citing paper says it does?
In the citing paper
“Others evaluated match-week behavior-change strategies or individualized counseling (20, 21), parent-supported goal setting (22), or repeated dietitian-led education (23, 24).”
In the citing paper
“Improvements were reported after workbook, interdisciplinary, team-based, lecture, classroom, digital, repeated-counseling, and dietitian-led programs (11, 13–15, 18, 21–24, 32–37).”
In the citing paper
“Interventions incorporating individual counseling, repeated sessions, food-record review, photographic feedback, goal setting, practical food tasks, or controlled dietary modification showed more favorable dietary signals (15–18, 20, 24), although these components and the predominance of non-randomized designs limited attribution.”
In the citing paper
“Several studies reported favorable changes in weight-related measures, fat-free mass, or circumferences (19, 21, 24, 34, 38).”
In the citing paper
“More favorable dietary signals were reported in some studies, but repeated contact and non-randomized designs often limited causal attribution.”
13 more claims about this paper
Create a free account to see every claim other papers make about this one.
Statistics recomputed
Every reported test result, recomputed from its test statistic and degrees of freedom. A result shows as not adding up only once an independent check has confirmed it.
- ConsistentF(1, 81) = 7.55reported p < .05 · recomputed p = .007
“F (1,81) = 7.55, p < .05”
- ConsistentF(1, 81) = 6.71reported p < .05 · recomputed p = .011
“F (1,81) = 6.71, p < .05”
- ConsistentF(1, 81) = 6.48reported p < .05 · recomputed p = .013
“F (1,81) = 6.48, p < .05”
- ConsistentF(1, 81) = 6.17reported p < .05 · recomputed p = .015
“F (1,81) = 6.17, p < .05”
- ConsistentF(1, 81) = 10.35reported p < .05 · recomputed p = .002
“F (1,81) = 10.35, p < .05”
1 more recomputed test
Create a free account to see every test the Stats check recomputed.
Self-check
Percentages, sums and reported differences re-computed from the paper’s own numbers.
Each contradiction between two passages listed here was confirmed by an independent check.
Rated major: it would touch a result — a value a result rests on, reported and recomputed p-values on opposite sides of the significance level, two passages that conflict with no sign which is right, or a cited work retracted before this paper was published.
In the paper
§ The effect of nutrition education sessions on energy availability, body composition, eating attitude and sports nutrition knowledge in young female endurance athletes > Results
“| RMR (kcal) | 1545.9 ± 110.8 | 1533.1 ± 124.9 | 0.852m |”
§ The effect of nutrition education sessions on energy availability, body composition, eating attitude and sports nutrition knowledge in young female endurance athletes > Results
“| RMR (kcal) | Interv. | 1,518,57 ± 132,94 | 1,531,04 ± 143,00 | Time | 3,45 | 0.07 | | | RMR (kcal) | Control | 1,525,52 ± 118,49 | 1,539,08 ± 141,45 | Time*group | 0,01 | 0.94 | |”
Rated minor: it would not touch a result — a value no result rests on, a p-value that stays on the same side of the significance level, or a conflict that is clerical, resolved elsewhere in the paper, or outside its own findings.
In the paper
“| Post-intervention | LEAF-Q(≥8) | 20 | 45,5 | 25 | 65,8 | 45 | 54,3 |”
§ The effect of nutrition education sessions on energy availability, body composition, eating attitude and sports nutrition knowledge in young female endurance athletes > Results
Reported 45.5 · recomputed 44.444444
Rated minor: it would not touch a result — a value no result rests on, a p-value that stays on the same side of the significance level, or a conflict that is clerical, resolved elsewhere in the paper, or outside its own findings.
In the paper
“while it remained at 52.6% (n = 22) in the control group.”
§ The effect of nutrition education sessions on energy availability, body composition, eating attitude and sports nutrition knowledge in young female endurance athletes > Results
Reported 52.6 · recomputed 57.894737
Rated minor: it would not touch a result — a value no result rests on, a p-value that stays on the same side of the significance level, or a conflict that is clerical, resolved elsewhere in the paper, or outside its own findings.
In the paper
“mean score and percentage for control and intervention groups, respectively, after the intervention were 27.0 (32.5%) and 35.3 (34.9%), with a total score of 78”
§ The effect of nutrition education sessions on energy availability, body composition, eating attitude and sports nutrition knowledge in young female endurance athletes > Discussion
Reported 34.9 · recomputed 45.25641
Rated minor: it would not touch a result — a value no result rests on, a p-value that stays on the same side of the significance level, or a conflict that is clerical, resolved elsewhere in the paper, or outside its own findings.
In the paper
§ The effect of nutrition education sessions on energy availability, body composition, eating attitude and sports nutrition knowledge in young female endurance athletes > Results
“| BMI (kg/m2) | 19.2 ± 5.8 | 19.4 ± 5.7 | 0.780m |”
§ The effect of nutrition education sessions on energy availability, body composition, eating attitude and sports nutrition knowledge in young female endurance athletes > Results
“| BMI (kg/m2) | Interv. | 20,81 ± 2,16 | 21,23 ± 1,99 | Time | 5,84 | 0.02 | 0,07 | | BMI (kg/m2) | Control | 20,47 ± 2,46 | 20,44 ± 2,55 | Time*group | 7,55 | 0.01 | 0,09 |”
5 more findings
Create a free account to see every finding of this check.
Citations
Cites
2011 Compendium of Physical Activities: A Second Update of Codes and MET Values
AINSWORTH, B. E., HASKELL, W. L., HERRMANN, S. D., MECKES, N., BASSETT, D. R., TUDOR-LOCKE, C., GREER, J. L., VEZINA, J., WHITT-GLOVER, M. C., & LEON, A. S. (2011) · Medicine & Science in Sports & Exercise · doi:10.1249/mss.0b013e31821ece12 · Cited by 6,317
Rosa, S. D., Samoni, S., Villa, G., & Ronco, C. (2017) · Blood Purification · doi:10.1159/000452650 · Cited by 5,040
Bioelectrical impedance analysis?part I: review of principles and methods
KYLE, U. (2004) · Clinical Nutrition · doi:10.1016/j.clnu.2004.06.004 · Cited by 3,200
(2007) · Medicine & Science in Sports & Exercise · doi:10.1249/mss.0b013e318149f111 · Cited by 1,554
Jetté, M., Sidney, K., & Blümchen, G. (1990) · Clinical Cardiology · doi:10.1002/clc.4960130809 · Cited by 1,501
Nutrition and Athletic Performance
(2016) · Medicine & Science in Sports & Exercise · doi:10.1249/mss.0000000000000852 · Cited by 1,305
International Society of Sports Nutrition position stand: protein and exercise
Campbell, B., Kreider, R. B., Ziegenfuss, T., La Bounty, P., Roberts, M., Burke, D., Landis, J., Lopez, H., & Antonio, J. (2007) · Journal of the International Society of Sports Nutrition · doi:10.1186/1550-2783-4-8 · Cited by 716
De Souza, M. J., Nattiv, A., Joy, E., Misra, M., Williams, N. I., Mallinson, R. J., Gibbs, J. C., Olmsted, M., Goolsby, M., Matheson, G., et al. (2014) · British Journal of Sports Medicine · doi:10.1136/bjsports-2013-093218 · Cited by 661
Ackland, T. R., Lohman, T. G., Sundgot-Borgen, J., Maughan, R. J., Meyer, N. L., Stewart, A. D., & Müller, W. (2012) · Sports Medicine · doi:10.2165/11597140-000000000-00000 · Cited by 599
Metabolic equivalent: one size does not fit all
Byrne, N. M., Hills, A. P., Hunter, G. R., Weinsier, R. L., & Schutz, Y. (2005) · Journal of Applied Physiology · doi:10.1152/japplphysiol.00023.2004 · Cited by 527
Energy availability in athletes
Loucks, A. B., Kiens, B., & Wright, H. H. (2011) · Journal of Sports Sciences · doi:10.1080/02640414.2011.588958 · Cited by 513
Melin, A., Tornberg, Å. B., Skouby, S., Faber, J., Ritz, C., Sjödin, A., & Sundgot-Borgen, J. (2014) · British Journal of Sports Medicine · doi:10.1136/bjsports-2013-093240 · Cited by 435
The Eating Attitudes Test: Validation With DSM-IV Eating Disorder Criteria
Mintz, L. B., & O'Halloran, M. S. (2000) · Journal of Personality Assessment · doi:10.1207/s15327752jpa7403_11 · Cited by 396
Logue, D. M., Madigan, S. M., Melin, A., Delahunt, E., Heinen, M., Donnell, S.-J. M., & Corish, C. A. (2020) · Nutrients · doi:10.3390/nu12030835 · Cited by 321
Heikura, I. A., Uusitalo, A. L. T., Stellingwerff, T., Bergland, D., Mero, A. A., & Burke, L. M. (2018) · International Journal of Sport Nutrition and Exercise Metabolism · doi:10.1123/ijsnem.2017-0313 · Cited by 318
Bonci, C. M., Bonci, L. J., Granger, L. R., Johnson, C. L., Malina, R. M., Milne, L. W., Ryan, R. R., & Vanderbunt, E. M. (2008) · Journal of Athletic Training · doi:10.4085/1062-6050-43.1.80 · Cited by 306
Logue, D., Madigan, S. M., Delahunt, E., Heinen, M., Mc Donnell, S.-J., & Corish, C. A. (2018) · Sports Medicine · doi:10.1007/s40279-017-0790-3 · Cited by 274
Inaccuracies in self-reported intake identified by comparison with the doubly labelled water method
Schoeller, D. A., Bandini, L. G., & Dietz, W. H. (1990) · Canadian Journal of Physiology and Pharmacology · doi:10.1139/y90-143 · Cited by 266
Rodgers, R., & Chabrol, H. (2009) · European Eating Disorders Review · doi:10.1002/erv.907 · Cited by 264
Energy Availability in Athletics: Health, Performance, and Physique
Melin, A. K., Heikura, I. A., Tenforde, A., & Mountjoy, M. (2019) · International Journal of Sport Nutrition and Exercise Metabolism · doi:10.1123/ijsnem.2018-0201 · Cited by 258
Pitfalls of conducting and interpreting estimates of energy availability in free-living athletes
Burke, L. M., Lundy, B., Fahrenholtz, I. L., & Melin, A. K. (2018) · International Journal of Sport Nutrition and Exercise Metabolism · doi:10.1123/ijsnem.2018-0142 · Cited by 244
Koehler, K., Hoerner, N. R., Gibbs, J. C., Zinner, C., Braun, H., De Souza, M. J., & Schaenzer, W. (2016) · Journal of Sports Sciences · doi:10.1080/02640414.2016.1142109 · Cited by 164
Piccoli, A., & for the Italian CAPD-BIA Study Group (2004) · Kidney International · doi:10.1111/j.1523-1755.2004.00467.x · Cited by 134
Condo, D., Lohman, R., Kelly, M., & Carr, A. (2019) · Nutrients · doi:10.3390/nu11050971 · Cited by 122
Viner, R. T., Harris, M., Berning, J. R., & Meyer, N. L. (2015) · International Journal of Sport Nutrition and Exercise Metabolism · doi:10.1123/ijsnem.2015-0073 · Cited by 118
Accuracy of Resting Metabolic Rate Prediction Equations in Athletes
Jagim, A. R., Camic, C. L., Kisiolek, J. N., Luedke, J. A., Erickson, J. L., Jones, M. T., & Oliver, J. M. (2017) · The Journal of Strength and Conditioning Research · doi:10.1519/jsc.0000000000002111 · Cited by 104
Sport nutrition for young athletes
Purcell, L., Canadian Paediatric Society, & Section, P. S. A. E. M. (2013) · Paediatrics & Child Health · doi:10.1093/pch/18.4.200 · Cited by 92
Changes in energy availability across the season in division I female soccer players
Reed, J. L., De Souza, M. J., & Williams, N. I. (2013) · Journal of Sports Sciences · doi:10.1080/02640414.2012.733019 · Cited by 88
Cialdella-Kam, L., Guebels, C., Maddalozzo, G., & Manore, M. (2014) · Nutrients · doi:10.3390/nu6083018 · Cited by 85
Stubbs, R. J., O'Reilly, L. M., Whybrow, S., Fuller, Z., Johnstone, A. M., Livingstone, M. B. E., Ritz, P., & Horgan, G. W. (2014) · British Journal of Nutrition · doi:10.1017/s0007114514000154 · Cited by 85
Eating disorders among athletes. Research and recommendations
Garner, D. M., Rosen, L. W., & Barry, D. (1998) · Child and Adolescent Psychiatric Clinics of North America · doi:10.1016/s1056-4993(18)30215-3 · Cited by 72
Development of a psychometrically valid and reliable sports nutrition knowledge questionnaire
Zinn, C., Schofield, G., & Wall, C. (2005) · Journal of Science and Medicine in Sport · doi:10.1016/s1440-2440(05)80045-3 · Cited by 70
Vázquez-Espino, K., Rodas-Font, G., & Farran-Codina, A. (2022) · Nutrients · doi:10.3390/nu14071345 · Cited by 67
Łagowska, K., Kapczuk, K., & Jeszka, J. (2014) · Journal of the International Society of Sports Nutrition · doi:10.1186/s12970-014-0052-9 · Cited by 65
Philippou, E., Middleton, N., Pistos, C., Andreou, E., & Petrou, M. (2017) · Journal of Science and Medicine in Sport · doi:10.1016/j.jsams.2016.08.023 · Cited by 65
Nascimento, M., Silva, D., Ribeiro, S., Nunes, M., Almeida, M., & Mendes-Netto, R. (2016) · Nutrients · doi:10.3390/nu8090535 · Cited by 63
Assessment of energy availability and associated risk factors in professional female soccer players
Moss, S. L., Randell, R. K., Burgess, D., Ridley, S., ÓCairealláin, C., Allison, R., & Rollo, I. (2021) · European Journal of Sport Science · doi:10.1080/17461391.2020.1788647 · Cited by 62
Prevalence of indicators of low energy availability in elite female sprinters
Sygo, J., Coates, A. M., Sesbreno, E., Mountjoy, M. L., & Burr, J. F. (2018) · International Journal of Sport Nutrition and Exercise Metabolism · doi:10.1123/ijsnem.2017-0397 · Cited by 60
Heikkilä, M., Lehtovirta, M., Autio, O., Fogelholm, M., & Valve, R. (2019) · Nutrients · doi:10.3390/nu11092249 · Cited by 58
Patton-Lopez, M. M., Manore, M. M., Branscum, A., Meng, Y., & Wong, S. S. (2018) · Nutrients · doi:10.3390/nu10111636 · Cited by 58
da Costa, N. F., Schtscherbyna, A., Soares, E. A., & Ribeiro, B. G. (2012) · Nutrition · doi:10.1016/j.nut.2012.06.007 · Cited by 50
Coelho, G. M. D. O., Farias, M. L. F., de Mendonça, L. M. C., de Mello, D. B., Lanzillotti, H. S., Ribeiro, B. G., & Soares, E. D. A. (2013) · Appetite · doi:10.1016/j.appet.2013.01.001 · Cited by 49
Simpson, A., Gemming, L., Baker, D., & Braakhuis, A. J. (2017) · Sports · doi:10.3390/sports5030060 · Cited by 49
Effects of dietary intervention in young female athletes with menstrual disorders
Łagowska, K., Kapczuk, K., Friebe, Z., & Bajerska, J. (2014) · Journal of the International Society of Sports Nutrition · doi:10.1186/1550-2783-11-21 · Cited by 47
Nutrition Status of Young Elite Female German Football Players
Braun, H., von Andrian-Werburg, J., Schänzer, W., & Thevis, M. (2018) · Pediatric Exercise Science · doi:10.1123/pes.2017-0072 · Cited by 47
Buffington, B. C., Melnyk, B. M., Morales, S., Lords, A., & Zupan, M. R. (2016) · Journal of the American Association of Nurse Practitioners · doi:10.1002/2327-6924.12359 · Cited by 44
Prevalence of low energy availability in collegiate women soccer athletes
Magee, M. K., Lockard, B. L., Zabriskie, H. A., Schaefer, A. Q., Luedke, J. A., Erickson, J. L., Jones, M. T., & Jagim, A. R. (2020) · Journal of Functional Morphology and Kinesiology · doi:10.3390/jfmk5040096 · Cited by 44
Silva, M.-R. G., Silva, H.-H., & Paiva, T. (2018) · European Journal of Pediatrics · doi:10.1007/s00431-018-3124-z · Cited by 36
Family functioning, peer influence, and media influence as predictors of bulimic behavior
Young, E. A., McFatter, R. M., & Clopton, J. R. (2001) · Eating Behaviors · doi:10.1016/s1471-0153(01)00038-1 · Cited by 35
Łuszczki, E., Jagielski, P., Bartosiewicz, A., Kuchciak, M., Dereń, K., Stolarczyk, A., Pakosz, P., & Oleksy, L. (2021) · PeerJ · doi:10.7717/peerj.12118 · Cited by 32
Raymond-Barker, P., Petroczi, A., & Quested, E. (2007) · Journal of Occupational Medicine and Toxicology · doi:10.1186/1745-6673-2-10 · Cited by 29
The Prevalence of “at Risk” Eating Disorders among Athletes in Jordan
Ghazzawi, H., Alhaj, O. A., Nemer, L. S. S., Amawi, A. T., Trabelsi, K., & Jahrami, H. (2022) · Sports · doi:10.3390/sports10110182 · Cited by 28
Eating attitudes and food intakes of elite adolescent female figure skaters: A cross sectional study
Dwyer, J., Eisenberg, A., Prelack, K., Song, W. O., Sonneville, K., & Ziegler, P. (2012) · Journal of the International Society of Sports Nutrition · doi:10.1186/1550-2783-9-53 · Cited by 26
Adolescent Endurance Runners Exhibit Suboptimal Energy Availability and Intakes of Key Nutrients
Matt, S. A., Barrack, M. T., Gray, V., Cotter, J. A., Loan, M. D. V., Rauh, M. J., McGowan, R., & Nichols, J. F. (2021) · Journal of the American Nutrition Association · doi:10.1080/07315724.2021.1925994 · Cited by 24
Risk of disordered eating among division I female college athletes
Wells, E., Chin, A., Tacke, J., & Bunn, J. (2015) · International Journal of Exercise Science · doi:10.70252/raqk3996 · Cited by 21
Tan, X., Rogers, N., Brown, N., MacDonald, M., Bowler, A.-L., & Cox, G. R. (2022) · Nutrients · doi:10.3390/nu14245203 · Cited by 13
Low energy availability in group of polish female soccer players
Dobrowolski, H., & Włodarek, D. (2020) · Roczniki Państwowego Zakładu Higieny · doi:10.32394/rpzh.2020.0106 · Cited by 9
Karpinski, C. A., Touger-Decker, R. E., Denmark, R., Radler, D. R., & Rosenbloom, C. (2012) · Journal of the Academy of Nutrition and Dietetics · doi:10.1016/j.jand.2012.06.037 · Cited by 7
(1997) · PubMed
(2020)
Self-citation
Research works printed but not linked: 1
- 2004, Nutrition data base software
Cited by
Why do students drop out of regular sport in late adolescent? The experience of a systematic review
Zhang, Y., Wang, F., Szakál, Z., Bíró, Z., Kovács, M., Őrsi, B., & Kovács, K. E. (2024) · Frontiers in Public Health · doi:10.3389/fpubh.2024.1416558 · Cited by 30
Ibáñez, H. E., Drehmer, E., da Silva, V. S., Souza, I., Silva, D. A. S., & Vieira, F. S. (2025) · Nutrients · doi:10.3390/nu17040714 · Cited by 11
Veloso-Pulgar, M., Fernández de Arriba, R., & Farran-Codina, A. (2025) · Nutrition Research Reviews · doi:10.1017/s0954422425100152 · Cited by 4
Veloso-Pulgar, M., & Farran-Codina, A. (2025) · Nutrients · doi:10.3390/nu17152560 · Cited by 4
Smulligan, K. L., Brna, M. L., Hogg-Cornejo, V., Petersen, S., Sweeney, E. A., Meyers, R. N., Howell, D. R., & Armento, A. M. (2025) · Physical Therapy in Sport · doi:10.1016/j.ptsp.2025.09.011 · Cited by 5
Metadata
- Authors
- Tektunalı Akman, C., Gönen Aydın, C., & Ersoy, G.
- Affiliations
- Istanbul Medipol University (TR)
- ORCID
- Ersoy, Gülgün
- Venue
- Frontiers in Public Health
- Publisher
- Frontiers Media SA
- Published
- 2024-03-14
- Volume
- 12
- Pages
- 1289448-1289448
- ISSN
- 2296-2565 (ISSN-L)
- PMC
- PMC10973170
- OpenAlex
- W4392814340
- Cited by
- 46
- References
- 60
- Citations by year
- 2026: 26 · 2025: 16 · 2024: 4
- FWCI
- 10.50
- Type
- journal article
- Language
- en
- Open access
- gold
- doi.org
- Licence
- Locations
- Frontiers in Public Health (publishedVersion, cc-by)
- PubMed Central (publishedVersion, cc-by)
- PubMed (publishedVersion)
- DOAJ (DOAJ: Directory of Open Access Journals) (submittedVersion, cc-by-sa)
- Greater South Information System
- Topics
- Health Sciences › Nursing › Nutrition and Dietetics › Nutrition, Health and Food Behavior
- Social Sciences › Psychology › Clinical Psychology › Eating Disorders and Behaviors
- Health Sciences › Nursing › Nutrition and Dietetics › Dietetics, Nutrition, and Education
- Keywords
- nutrition education, energy availability, low energy availability, female athletes, endurance athletes, eating attitudes, sports nutrition knowledge, body composition, fat-free mass, resting metabolic rate, energy intake, youth athletes
- MeSH terms
- Adolescent, Body Composition, Energy Intake, Female, Humans, Sports, Athletes
About these checks
Registry, retraction, Cites and statistics results are computed, not judged, with one exception: a printed reference that no index lists is read once by a model before it counts as a citation error. Claims are extracted by a model and kept only when their quote appears verbatim in the text; each cited source is then checked, with a model’s help, for whether it says what the claim relies on. Those verdicts can be wrong — read the claim’s quote and the cited source before relying on one.
A language model drew the claims from the paper on 2026-11-14, under version 3 of the claim definition (model deepseek-v4.1-flash, prompt extract-v3).
A second model labelled each claim on 2026-11-14 (model jev-1.13-20260917, definition revision gold-guideline-v0.2).
Statistics and arithmetic are recomputed, not judged.
Confidence bands are shown only for fields calibrated on our annotated test set. None is calibrated yet, so no band is shown.
What counts as a claim ›How we measure confidence ›How we check this ›
Are you an author, or do you see a problem with this page? Request a review
Data sources
Bibliographic data: Semantic Scholar, OpenAlex, Crossref.
Contains information from the Semantic Scholar Academic Graph Datasets, made available under the ODC Attribution License (ODC-BY 1.0).
Semantic Scholar’s data is described in: Kinney, R., et al. (2023). The Semantic Scholar Open Data Platform. arXiv:2301.10140.
