

The DOI matches its Crossref record; 118 of the 118 references it cites were found in a registry or an index.
Wearable Biosensors for Non-Invasive Sweat Diagnostics
Open accessAbstract
Recent advances in microfluidics, microelectronics, and electrochemical sensing methods have steered the way for the development of novel and potential wearable biosensors for healthcare monitoring. Wearable bioelectronics has received tremendous attention worldwide due to its great a potential for predictive medical modeling and allowing for personalized point-of-care-testing (POCT). They possess many appealing characteristics, for example, lightweight, flexibility, good stretchability, conformability, and low cost. These characteristics make wearable bioelectronics a promising platform for personalized devices. In this paper, we review recent progress in flexible and wearable sensors for non-invasive biomonitoring using sweat as the bio-fluid. Real-time and molecular-level monitoring of personal health states can be achieved with sweat-based or perspiration-based wearable biosensors. The suitability of sweat and its potential in healthcare monitoring, sweat extraction, and the challenges encountered in sweat-based analysis are summarized. The paper also discusses challenges that still hinder the full-fledged development of sweat-based wearables and presents the areas of future research.
Overview
The claims and statistics of this paper haven’t been checked yet.
Run the check — free, no account needed. It reads the open-access text and checks the sources it cites.
Integrity signals
Registry
Cites
Statistics
Figures
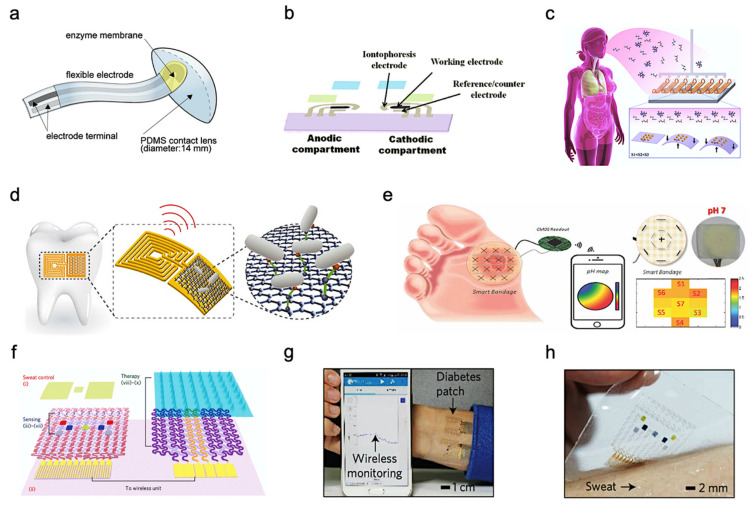
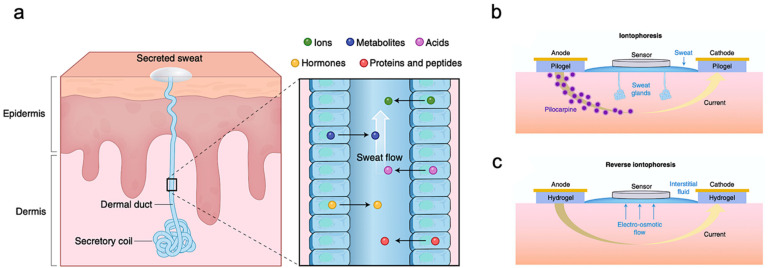
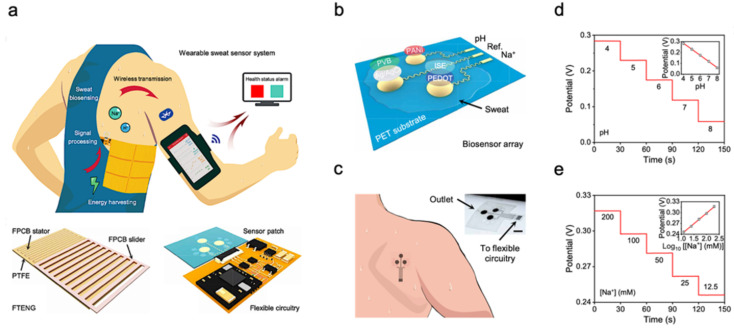
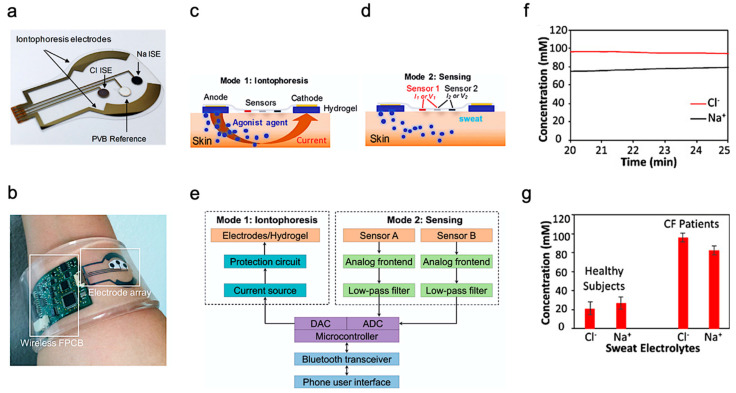
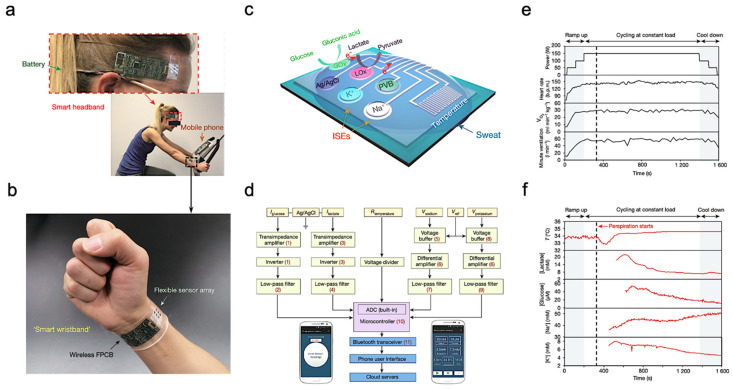
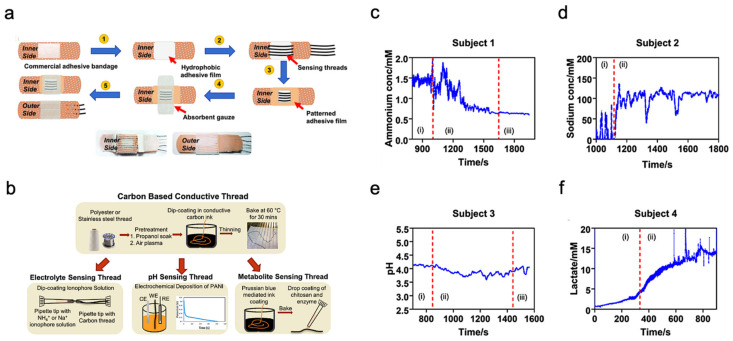
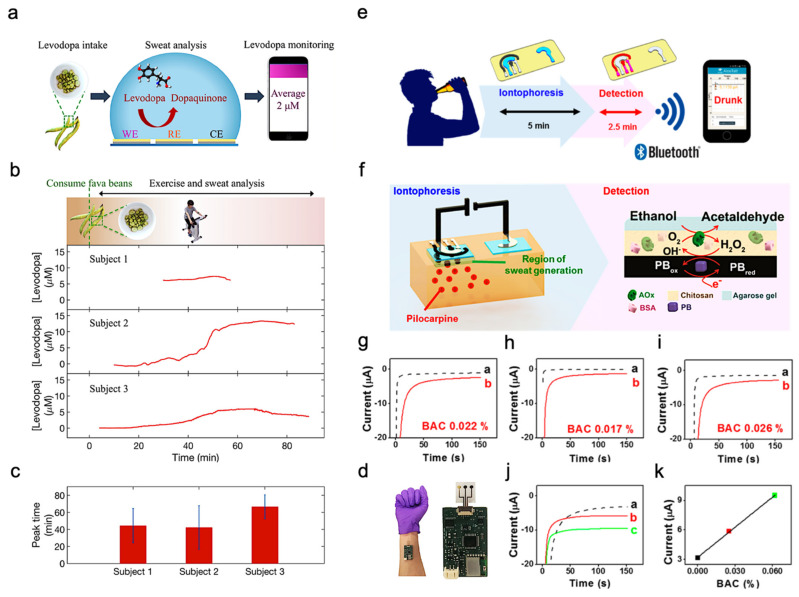
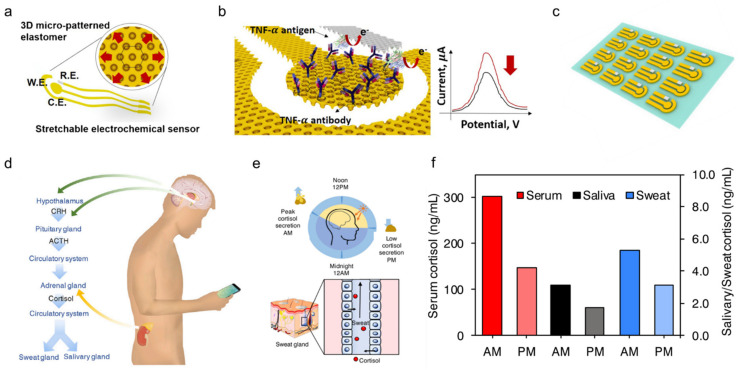
Verification
Claims the paper makes
The claims and statistics of this paper haven’t been checked yet.
Run the check — free, no account needed. It reads the open-access text and checks the sources it cites.
Claims other papers make about this one
Each is checked against this paper’s own text: does it say what the citing paper says it does?
In the citing paper
“The same temporal change of cortisol concentration was also reported for all biofluids, such as saliva, serum, and sweat.[ 8 , 30 ]”
From MicroSweat: A wearable microfluidic patch for noninvasive and reliable sweat collection enables human stress monitoring (2023) · cites this paper as [30]
Self-check
Percentages, sums and reported differences re-computed from the paper’s own numbers.
The self-check needs the paper’s full text.
Citations
Cites
Fully integrated wearable sensor arrays for multiplexed in situ perspiration analysis
Gao, W., Emaminejad, S., Nyein, H. Y. Y., Challa, S., Chen, K., Peck, A., Fahad, H. M., Ota, H., Shiraki, H., Kiriya, D., et al. (2016) · Nature · doi:10.1038/nature16521 · Cited by 5,087 · cited 7×
“For example, diabetes is directly related to the metabolite profile of glucose, which can be easily detected through sweat [44,98].”
BackgroundMethodInfluentialLee, H., Choi, T. K., Lee, Y. B., Cho, H. R., Ghaffari, R., Wang, L., Choi, H. J., Chung, T. D., Lu, N., Hyeon, T., et al. (2016) · Nature Nanotechnology · doi:10.1038/nnano.2016.38 · Cited by 1,802
Bariya, M., Nyein, H. Y. Y., & Javey, A. (2018) · Nature Electronics · doi:10.1038/s41928-018-0043-y · Cited by 1,486
Wearable and flexible electronics for continuous molecular monitoring
Yang, Y., & Gao, W. (2019) · Chemical Society Reviews · doi:10.1039/c7cs00730b · Cited by 1,315 · cited 5×
“Moreover, because the concentration of chlorine in the sweat of patients who have cystic fibrosis (CF) is abnormally high, the analysis of chlorine in sweat has been regarded as a widely used method for the diagnosis of CF [74].”
BackgroundMethodInfluentialA soft, wearable microfluidic device for the capture, storage, and colorimetric sensing of sweat
Koh, A., Kang, D., Xue, Y., Lee, S., Pielak, R. M., Kim, J., Hwang, T., Min, S., Banks, A., Bastien, P., et al. (2016) · Science Translational Medicine · doi:10.1126/scitranslmed.aaf2593 · Cited by 1,308
A laser-engraved wearable sensor for sensitive detection of uric acid and tyrosine in sweat
Yang, Y., Song, Y., Bo, X., Min, J., Pak, O. S., Zhu, L., Wang, M., Tu, J., Kogan, A., Zhang, H., et al. (2020) · Nature Biotechnology · doi:10.1038/s41587-019-0321-x · Cited by 1,270
Non-invasive wearable electrochemical sensors: a review
Bandodkar, A. J., & Wang, J. (2014) · Trends in Biotechnology · doi:10.1016/j.tibtech.2014.04.005 · Cited by 1,247
Lee, H., Song, C., Hong, Y. S., Kim, M., Cho, H. R., Kang, T., Shin, K., Choi, S. H., Hyeon, T., & Kim, D.-H. (2017) · Science Advances · doi:10.1126/sciadv.1601314 · Cited by 1,118
Self-powered ultra-flexible electronics via nano-grating-patterned organic photovoltaics
Park, S., Heo, S. W., Lee, W., Inoue, D., Jiang, Z., Yu, K., Jinno, H., Hashizume, D., Sekino, M., Yokota, T., et al. (2018) · Nature · doi:10.1038/s41586-018-0536-x · Cited by 1,068
Graphene-based wireless bacteria detection on tooth enamel
Mannoor, M. S., Tao, H., Clayton, J. D., Sengupta, A., Kaplan, D. L., Naik, R. R., Verma, N., Omenetto, F. G., & McAlpine, M. C. (2012) · Nature Communications · doi:10.1038/ncomms1767 · Cited by 1,014
Research works printed but not linked: 1
- Xiao, X., Xiao, X., Nashalian, A., Libanori, A., Fang, Y., Li, X., and Chen, J. (2021). Triboelectric Nanogenerators for Self-Powered Wound Healing. Adv. Healthc. Mater. · DOI
Cited by
Sorted by citations
Items 201–208 of 208
Yao, Y., & Xiang, S. (2026) · tm - Technisches Messen · doi:10.1515/teme-2026-0002
Xiaohong, 李. L. (2026) · Laser & Optoelectronics Progress · doi:10.3788/lop252379
Research on the usability of metallised fabrics as moisture sensor elements
Leśnikowski, J. (2026) · Autex Research Journal · doi:10.1515/aut-2025-0082
Wearable Iontophoretic Biosensing: From Active Sampling Principles to Analytical Validation
Ahmed, F., Song, J., Kim, S., Masud, & Kim, J. (2026) · Analytical Chemistry · doi:10.1021/acs.analchem.6c01565
Closed-Loop Neuromodulation for Brain Fatigue: From Real-Time Biomarkers to Adaptive Intervention
Lü, H., Zhang, Y., Wu, S., & Miao, D. (2026) · International Journal of Molecular Sciences · doi:10.3390/ijms27177970
Cheng, X., Tang, Y., & Xu, Z. (2026) · Reviews in Analytical Chemistry · doi:10.1515/revac-2025-0103
Chelmea, L., Badea, M., Bilal, S., Mereu, D. C., Neculau, A. E., Necula, R. D., Cocuz, M. E., Bratu, O. G., & Scârneciu, I. (2026) · Applied Sciences · doi:10.3390/app162010077
Slide-Ring Microneedle Hydrogels for Sweat Monitoring Evaluated via a Benchtop Sweat Simulator
Ros-Sirvent, M., Chillagana, P., Lucío, M. I., Maquieira, Á., Tortajada-Genaro, L. A., & Bañuls, M. (2026) · Gels · doi:10.3390/gels12110973
Metadata
- Authors
- Xu, J., Fang, Y., & Chen, J.
- Affiliations
- North China Electric Power University (CN)
- University of California, Los Angeles (US)
- Corresponding author
- Chen, Jun
- Venue
- Biosensors
- Publisher
- MDPI AG
- Published
- 2021-07-23
- Volume
- 11
- Issue
- 8
- Pages
- 245
- ISSN
- 2079-6374 (ISSN-L)
- PMC
- PMC8391966
- OpenAlex
- W3186719133
- Cited by
- 208
- References
- 118
- Citations by year
- 2026: 28 · 2025: 53 · 2024: 48 · 2023: 38 · 2022: 34 · 2021: 7
- FWCI
- 2.69
- Type
- journal article
- Language
- en
- Open access
- gold
- doi.org
- Licence
- Locations
- Biosensors (publishedVersion, cc-by)
- PubMed Central (publishedVersion, cc-by)
- PubMed (publishedVersion)
- DOAJ (DOAJ: Directory of Open Access Journals) (submittedVersion, cc-by-sa)
- eScholarship (California Digital Library) (submittedVersion)
- eScholarship (California Digital Library) (submittedVersion, cc-by)
- Funders
- Israel Science Foundation
- University of California, Los Angeles
- Topics
- Physical Sciences › Engineering › Biomedical Engineering › Advanced Sensor and Energy Harvesting Materials
- Physical Sciences › Chemistry › Analytical Chemistry › Electrochemical sensors and biosensors
- Physical Sciences › Engineering › Biomedical Engineering › Non-Invasive Vital Sign Monitoring
- Keywords
- wearable biosensors, sweat analysis, non-invasive diagnosis, wearable bioelectronics, flexible sensors, sweating, point-of-care testing, real-time health monitoring, electrochemical sensing, microfluidics
- MeSH terms
- Wearable Electronic Devices, Sweat, Biosensing Techniques, Microfluidics, Electrochemical Techniques
About these checks
Registry, retraction, Cites and statistics results are computed, not judged, with one exception: a printed reference that no index lists is read once by a model before it counts as a citation error. Claims are extracted by a model and kept only when their quote appears verbatim in the text; each cited source is then checked, with a model’s help, for whether it says what the claim relies on. Those verdicts can be wrong — read the claim’s quote and the cited source before relying on one.
Statistics and arithmetic are recomputed, not judged.
Confidence bands are shown only for fields calibrated on our annotated test set. None is calibrated yet, so no band is shown.
What counts as a claim ›How we measure confidence ›How we check this ›
Are you an author, or do you see a problem with this page? Request a review
