

The DOI matches its Crossref record; 9 of the 9 references it cites were found in a registry or an index.
Faecal Microbiota Composition Varies between Patients with Breast Cancer and Healthy Women: A Comparative Case-Control Study
Abstract
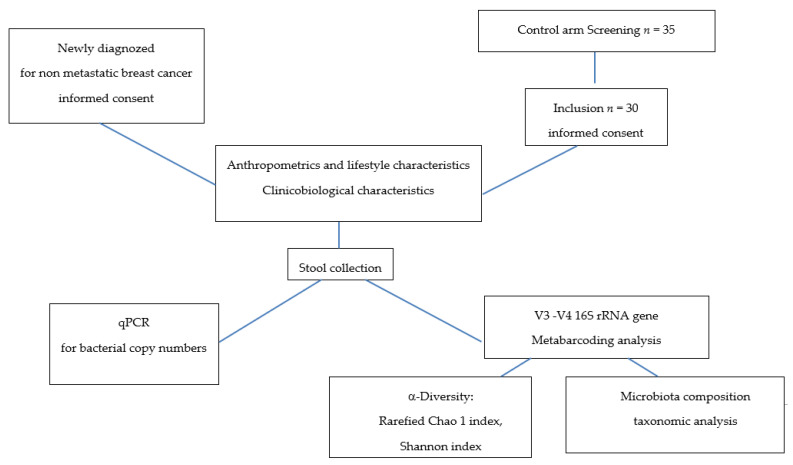
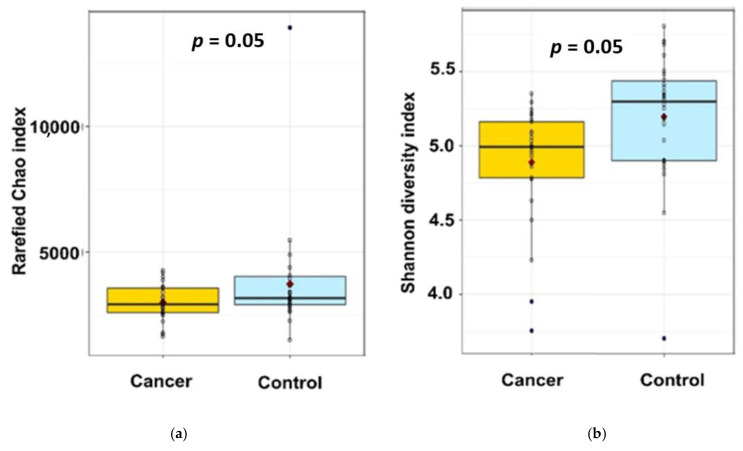
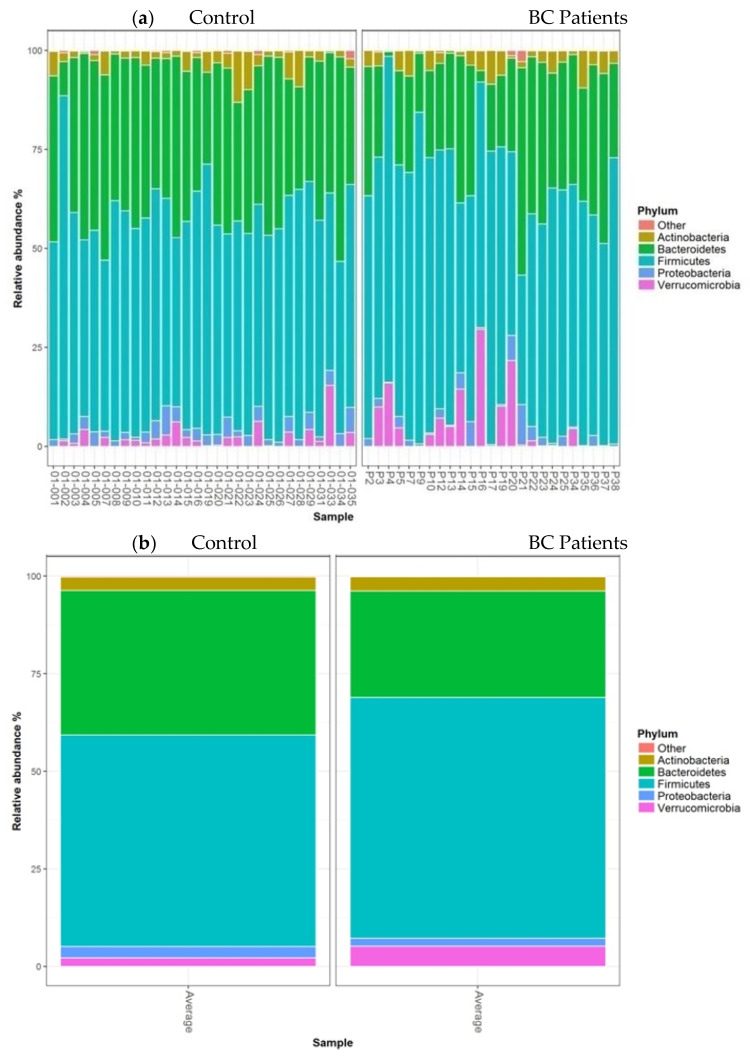
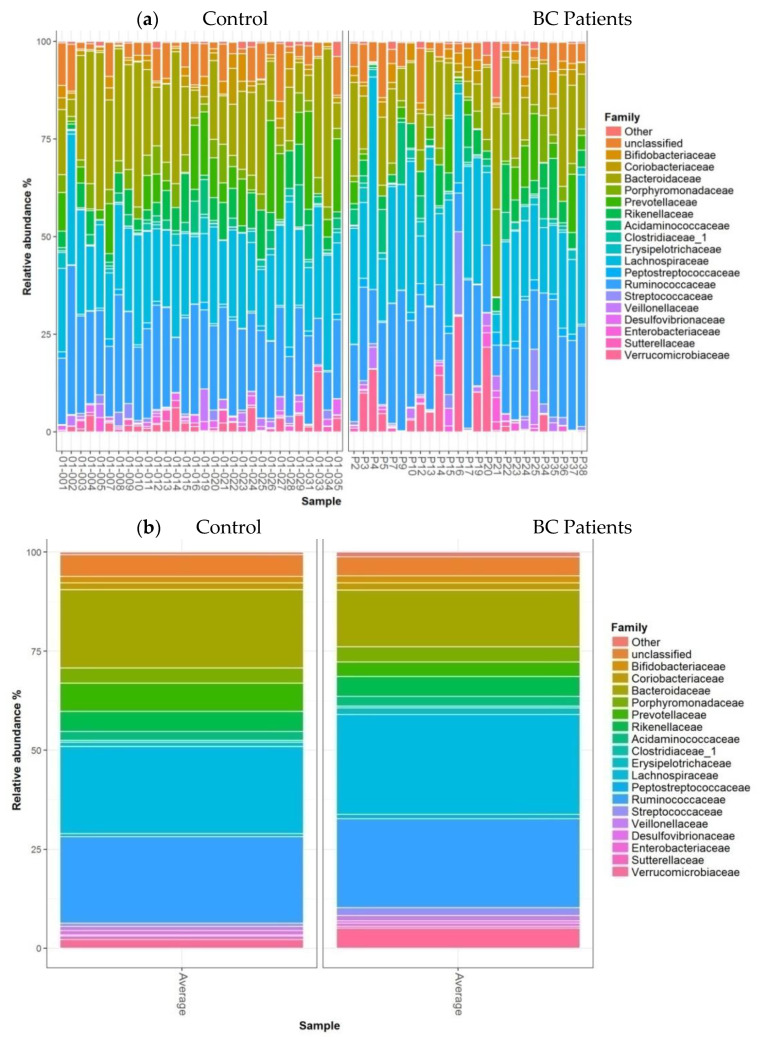
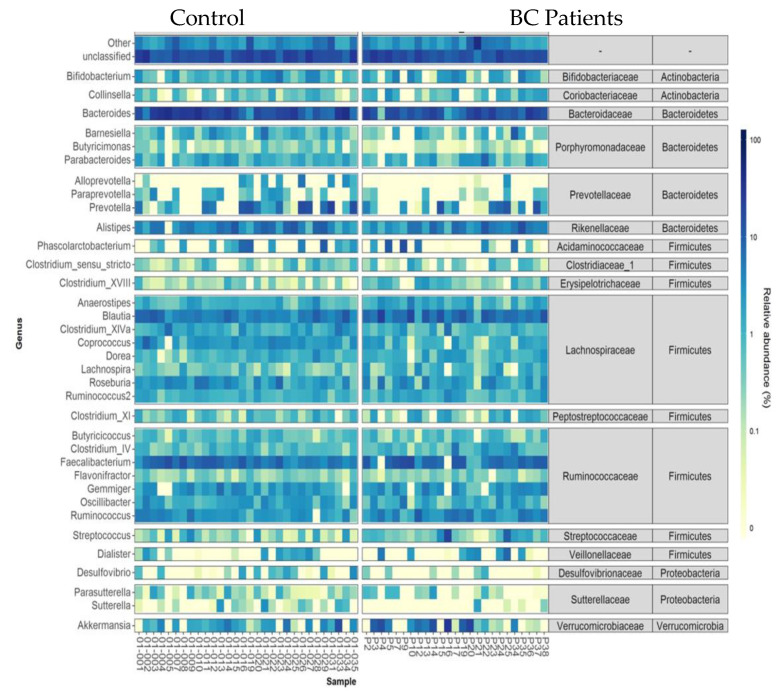
The intestinal microbiota plays an essential role in many diseases, such as obesity, irritable bowel disease (IBD), and cancer. This study aimed to characterize the faecal microbiota from early-stage breast cancer (BC) patients and healthy controls. Faeces from newly diagnosed breast cancer patients, mainly for an invasive carcinoma of no specific type (HR+ and HER2−), before any therapeutic treatment and healthy controls were collected for metabarcoding analyses. We show that the Shannon index, used as an index of diversity, was statistically lower in the BC group compared to that of controls. This work highlights a reduction of microbial diversity, a relative enrichment in Firmicutes, as well as a depletion in Bacteroidetes in patients diagnosed with early BC compared to those of healthy women. A tendency towards a decreased relative abundance of Odoribacter sp., Butyricimonas sp., and Coprococcus sp. was observed. This preliminary study suggests that breast cancer patients may differ from healthy subjects in their intestinal bacterial composition.
Overview
The claims and statistics of this paper haven’t been checked yet.
Run the check — free, no account needed. It reads the open-access text and checks the sources it cites.
Integrity signals
Registry
Cites
Statistics
Figures
Verification
Claims the paper makes
The claims and statistics of this paper haven’t been checked yet.
Run the check — free, no account needed. It reads the open-access text and checks the sources it cites.
Claims other papers make about this one
Each is checked against this paper’s own text: does it say what the citing paper says it does?
The source backs part of the claim, not all of it — or backs it for a different population, condition or comparison.
In the citing paper
“prior work has revealed that certain diseases are associated with changes in the α diversity of the microbiome, while others are not [35–38].”
From Saliva microbiome alterations in dental fluorosis population (2023) · cites this paper as [38]
Experimental — accuracy not yet measured
Self-check
Percentages, sums and reported differences re-computed from the paper’s own numbers.
The self-check needs the paper’s full text.
Citations
Cites
Klindworth, A., Pruesse, E., Schweer, T., Peplies, J., Quast, C., Horn, M., & Glöckner, F. O. (2013) · Nucleic Acids Research · doi:10.1093/nar/gks808 · Cited by 8,850
Commensal Bifidobacterium promotes antitumor immunity and facilitates anti–PD-L1 efficacy
Sivan, A., Corrales, L., Hubert, N., Williams, J. B., Aquino-Michaels, K., Earley, Z. M., Benyamin, F. W., Man Lei, Y., Jabri, B., Alegre, M.-L., et al. (2015) · Science · doi:10.1126/science.aac4255 · Cited by 3,888 · cited 1×
“[37] showed that the oral administration of Bifidobacterium alone can improve the immune response against melanoma growth in several different mouse models.”
BackgroundThe human tumor microbiome is composed of tumor type–specific intracellular bacteria
Nejman, D., Livyatan, I., Fuks, G., Gavert, N., Zwang, Y., Geller, L. T., Rotter-Maskowitz, A., Weiser, R., Mallel, G., Gigi, E., et al. (2020) · Science · doi:10.1126/science.aay9189 · Cited by 2,464
Reduced incidence of Prevotella and other fermenters in intestinal microflora of autistic children
Kang, D.-W., Park, J. G., Ilhan, Z. E., Wallstrom, G., LaBaer, J., Adams, J. B., & Krajmalnik-Brown, R. (2013) · PLoS ONE · doi:10.1371/journal.pone.0068322 · Cited by 976
Mechanisms and consequences of intestinal dysbiosis
Weiss, G. A., & Hennet, T. (2017) · Cellular and Molecular Life Sciences · doi:10.1007/s00018-017-2509-x · Cited by 775
Cancer and the gut microbiota: An unexpected link
Zitvogel, L., Galluzzi, L., Viaud, S., Vétizou, M., Daillère, R., Merad, M., & Kroemer, G. (2015) · Science Translational Medicine · doi:10.1126/scitranslmed.3010473 · Cited by 465
Goedert, J. J., Jones, G., Hua, X., Xu, X., Yu, G., Flores, R., Falk, R. T., Gail, M. H., Shi, J., Ravel, J., et al. (2015) · JNCI: Journal of the National Cancer Institute · doi:10.1093/jnci/djv147 · Cited by 393
Breast Cancer and Its Relationship with the Microbiota
Fernández, M. F., Reina-Pérez, I., Astorga, J. M., Rodríguez-Carrillo, A., Plaza-Díaz, J., & Fontana, L. (2018) · International Journal of Environmental Research and Public Health · doi:10.3390/ijerph15081747 · Cited by 350
Dabek, M., McCrae, S. I., Stevens, V. J., Duncan, S. H., & Louis, P. (2008) · FEMS Microbiology Ecology · doi:10.1111/j.1574-6941.2008.00520.x · Cited by 332
Research works printed but not linked: 37
- Wiseman, 2018, Nutrition and cancer: Prevention and survival, Br. J. Nutr., 122, 481, 10.1017/S0007114518002222 · DOI
- Huybrechts, 2020, The Human Microbiome in Relation to Cancer Risk: A Systematic Review of Epidemiologic Studies, Cancer Epidemiol. Biomark. Prev., 29, 1856, 10.1158/1055-9965.EPI-20-0288 · DOI · Paper page
- Bhatt, 2017, The role of the microbiome in cancer development and therapy, CA Cancer J. Clin., 67, 326, 10.3322/caac.21398 · DOI · Paper page
- Sheflin, 2014, Cancer-promoting effects of microbial dysbiosis, Curr. Oncol. Rep., 16, 406, 10.1007/s11912-014-0406-0 · DOI · Paper page
- Rajagopala, 2017, The Human Microbiome and Cancer. Cancer Prev Res, Am. Assoc. Cancer Res., 10, 226
- Lakritz, 2015, Gut bacteria require neutrophils to promote mammary tumorigenesis, Oncotarget, 6, 9387, 10.18632/oncotarget.3328 · DOI
- Wirtz, 2013, Frequent antibiotic use and second breast cancer events, Cancer Epidemiol. Biomark. Prev., 22, 1588, 10.1158/1055-9965.EPI-13-0454 · DOI
- Luu, 2017, Intestinal Proportion of Blautia sp. is Associated with Clinical Stage and Histoprognostic Grade in Patients with Early-Stage Breast Cancer, Nutr. Cancer, 69, 267, 10.1080/01635581.2017.1263750 · DOI
- Heymann, 2020, Centre de Ressources Biologiques-Tumorothèque: Bioresources and Associated Clinical Data Dedicated to Translational Research in Oncology at the Institut de Cancérologie de l’Ouest, France, Open J. Bioresour., 7, 5, 10.5334/ojb.62 · DOI
- Schloss, 2009, Introducing mothur: Open-Source, Platform-Independent, Community-Supported Software for Describing and Comparing Microbial Communities, Appl. Environ. Microbiol., 75, 7537, 10.1128/AEM.01541-09 · DOI
- Golombos, 2018, The Role of Gut Microbiome in the Pathogenesis of Prostate Cancer: A Prospective, Pilot Study, Urology, 111, 122, 10.1016/j.urology.2017.08.039 · DOI
- Gao, 2015, Microbiota disbiosis is associated with colorectal cancer, Front. Microbiol., 6, 20, 10.3389/fmicb.2015.00020 · DOI · Paper page
- Pellegrini, 2020, Gut microbiota composition after diet and probiotics in overweight breast cancer survivors: A randomized open-label pilot intervention trial, Nutrition, 74, 110749, 10.1016/j.nut.2020.110749 · DOI
- Arslan, 2014, Circulating estrogen metabolites and risk of breast cancer in postmenopausal women, Cancer Epidemiol. Biomarkers Prev., 23, 1290, 10.1158/1055-9965.EPI-14-0009 · DOI
- Odamaki, T., Kato, K., Sugahara, H., Hashikura, N., Takahashi, S., Xiao, J.-Z., Abe, F., and Osawa, R. (2016). Age-related changes in gut microbiota composition from newborn to centenarian: A cross-sectional study. BMC Microbiol., 16. · DOI · Paper page
- Claesson, 2011, Composition, variability, and temporal stability of the intestinal microbiota of the elderly, Proc. Natl. Acad. Sci. USA, 108, 4586, 10.1073/pnas.1000097107 · DOI · Paper page
- Lahti, 2014, Tipping elements in the human intestinal ecosystem, Nat. Commun., 5, 4344, 10.1038/ncomms5344 · DOI
- An, 2018, Age-Dependent Changes in GI Physiology and Microbiota: Time to Reconsider?, Gut, 67, 2213, 10.1136/gutjnl-2017-315542 · DOI · Paper page
- Mueller, 2006, Differences in Fecal Microbiota in Different European Study Populations in Relation to Age, Gender, and Country: A Cross-Sectional Study, Appl. Environ. Microbiol., 72, 1027, 10.1128/AEM.72.2.1027-1033.2006 · DOI · Paper page
- Hamilton, 2005, Species diversity or biodiversity?, J. Environ. Manag., 75, 89, 10.1016/j.jenvman.2004.11.012 · DOI
- Ahn, 2013, Human gut microbiome and risk for colorectal cancer, J. Natl. Cancer Inst., 105, 1907, 10.1093/jnci/djt300 · DOI · Paper page
- Sha, 2013, The biodiversity and composition of the dominant fecal microbiota in patients with inflammatory bowel disease, Diagn. Microbiol. Infect. Dis., 75, 245, 10.1016/j.diagmicrobio.2012.11.022 · DOI
- Labus, 2017, Differences in gut microbial composition correlate with regional brain volumes in irritable bowel syndrome, Microbiome, 5, 49, 10.1186/s40168-017-0260-z · DOI · Paper page
- Ling, 2016, Alterations in the Fecal Microbiota of Patients with HIV-1 Infection: An Observational Study in A Chinese Population, Sci. Rep., 6, 30673, 10.1038/srep30673 · DOI
- Vaiserman, 2017, Gut Microbiota: A Player in Aging and a Target for Anti-Aging Intervention, Ageing Res. Rev., 35, 36, 10.1016/j.arr.2017.01.001 · DOI · Paper page
- Plottel, 2011, Microbiome and malignancy, Cell Host Microbe., 10, 324, 10.1016/j.chom.2011.10.003 · DOI · Paper page
- Parida, S., and Sharma, D. (2019). The Microbiome-Estrogen Connection and Breast Cancer Risk. Cells, 8. · DOI
- Butel, 2014, Probiotics, gut microbiota and health, Médecine Mal. Infectieuses., 44, 1, 10.1016/j.medmal.2013.10.002 · DOI
- Shen, 2010, Molecular characterization of mucosal adherent bacteria and associations with colorectal adenomas, Gut Microbes., 1, 138, 10.4161/gmic.1.3.12360 · DOI · Paper page
- Bailey, 2011, Exposure to a social stressor alters the structure of the intestinal microbiota: Implications for stressor-induced immunomodulation, Brain Behav. Immun., 25, 397, 10.1016/j.bbi.2010.10.023 · DOI · Paper page
- Bhargava, 2014, Gut Microbiome and Multiple Sclerosis, Curr. Neurol. Neurosci. Rep., 14, 492, 10.1007/s11910-014-0492-2 · DOI · Paper page
- Montassier, 2016, Pretreatment gut microbiome predicts chemotherapy-related bloodstream infection, Genome Med., 8, 49, 10.1186/s13073-016-0301-4 · DOI
- Thomas, 2016, Tissue-Associated Bacterial Alterations in Rectal Carcinoma Patients Revealed by 16S rRNA Community Profiling, Front. Cell. Infect. Microbiol., 6, 179, 10.3389/fcimb.2016.00179 · DOI · Paper page
- Mikó, E., Kovács, T., Sebő, É., Tóth, J., Csonka, T., Ujlaki, G., Sipos, A., Szabó, J., Méhes, G., and Bai, P. (2019). Microbiome—Microbial Metabolome—Cancer Cell Interactions in Breast Cancer—Familiar, but Unexplored. Cells, 8. · DOI
- Saad, 2016, Linking Gut Microbiota and Inflammation to Obesity and Insulin Resistance, Physiology, 31, 283, 10.1152/physiol.00041.2015 · DOI
- Morris, 2011, Inflammation and increased aromatase expression occur in the breast tissue of obese women with breast cancer, Cancer Prev. Res., 4, 1021, 10.1158/1940-6207.CAPR-11-0110 · DOI
- Wu, 2020, Gut Microbiome Associations with Breast Cancer Risk Factors and Tumor Characteristics: A Pilot Study, Breast Cancer Res. Treat., 182, 451, 10.1007/s10549-020-05702-6 · DOI
Cited by
Sorted by citations
Saliva microbiome alterations in dental fluorosis population
Liu, S., Song, Q., Zhang, C., Li, M., Li, Z., Liu, Y., Xu, L., Xie, X., Zhao, L., Zhang, R., et al. (2023) · Journal of Oral Microbiology · doi:10.1080/20002297.2023.2180927 · Cited by 24
Metadata
- Authors
- Bobin-Dubigeon, C., Luu, H. T., Leuillet, S., Lavergne, S. N., Carton, T., Le Vacon, F., Michel, C., Nazih, H., & Bard, J.-M.
- Affiliations
- Institut de Cancérologie de l’Ouest, 44805 Saint-Herblain, France
- EA 2160—IUML FR3473 CNRS, Nantes University, 44035 Nantes, France
- Biofortis Mérieux NutriSciences, 3 Route de la Chatterie, 44800 Saint-Herblain, France
- Research Center of Human Nutrition CRNH Ouest, 44093 Nantes, France
- Venue
- Nutrients
- Publisher
- MDPI AG
- Published
- 2021-08-05
- Volume
- 13
- Issue
- 8
- Pages
- 2705
- ISSN
- 2072-6643
- PMC
- PMC8399700
- Cited by
- 90
- References
- 9
- Language
- en
About these checks
Registry, retraction, Cites and statistics results are computed, not judged, with one exception: a printed reference that no index lists is read once by a model before it counts as a citation error. Claims are extracted by a model and kept only when their quote appears verbatim in the text; each cited source is then checked, with a model’s help, for whether it says what the claim relies on. Those verdicts can be wrong — read the claim’s quote and the cited source before relying on one.
Statistics and arithmetic are recomputed, not judged.
Confidence bands are shown only for fields calibrated on our annotated test set. None is calibrated yet, so no band is shown.
What counts as a claim ›How we measure confidence ›How we check this ›
Are you an author, or do you see a problem with this page? Request a review
