

The DOI matches its Crossref record; 6 of the 6 references it cites were found in a registry or an index.
Role of Dietary Defatted Rice Bran in the Modulation of Gut Microbiota in AOM/DSS-Induced Colitis-Associated Colorectal Cancer Rat Model
Abstract
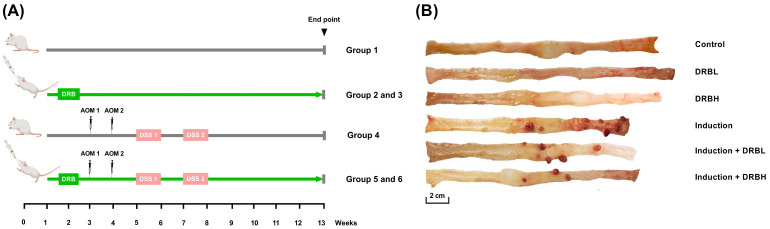
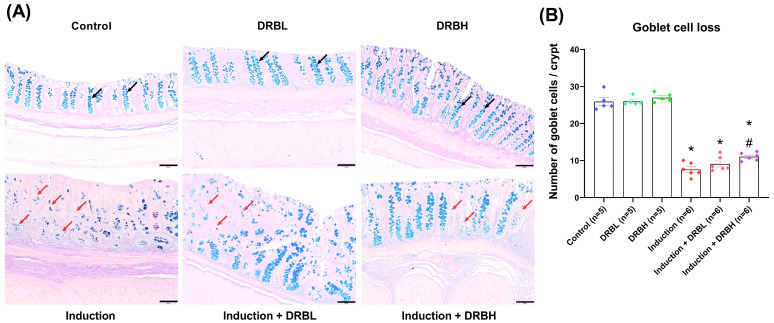
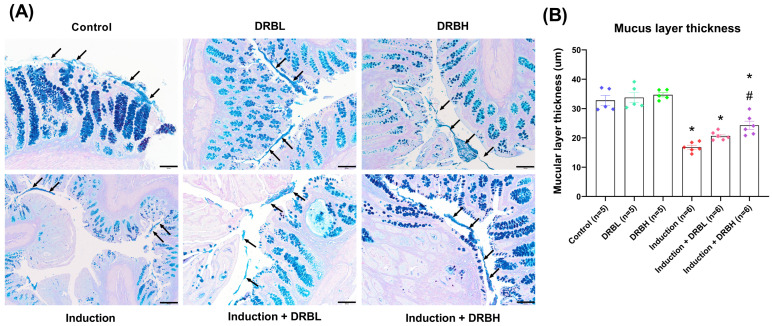
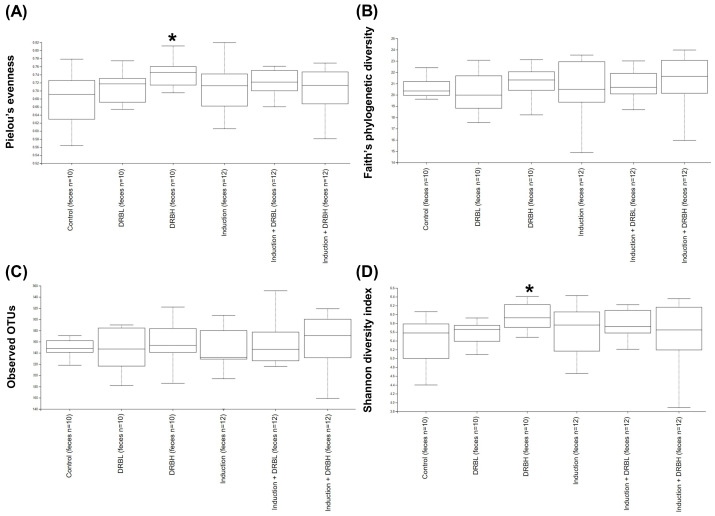
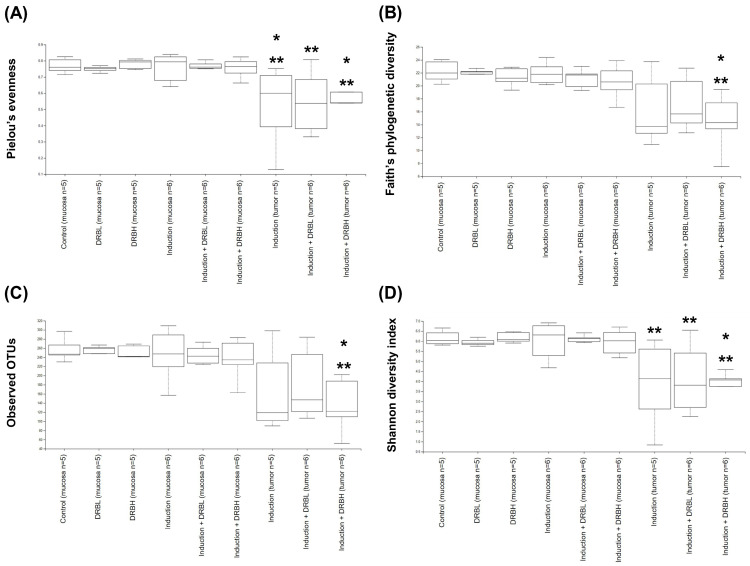
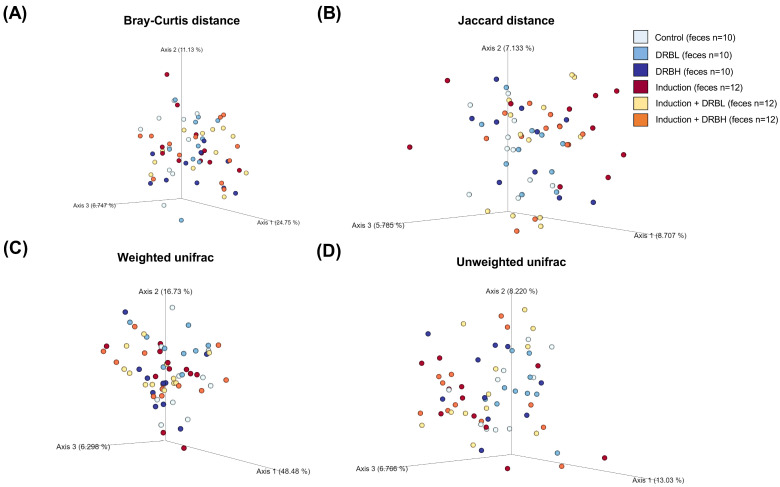
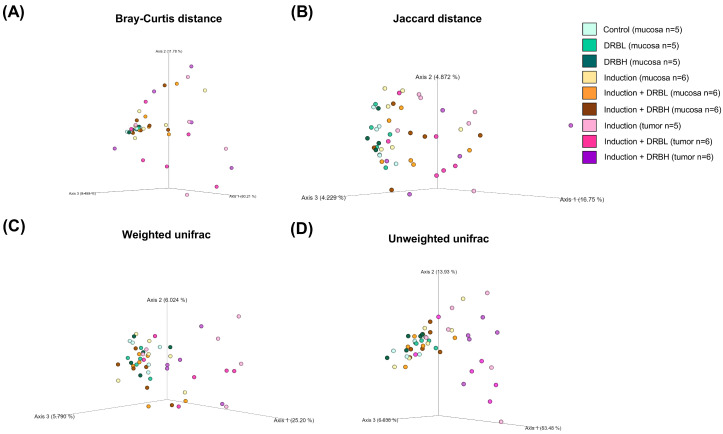
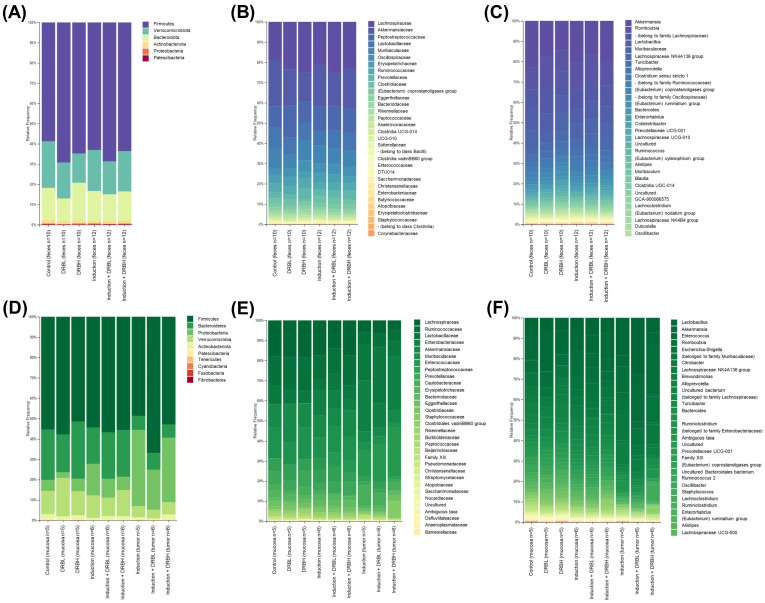
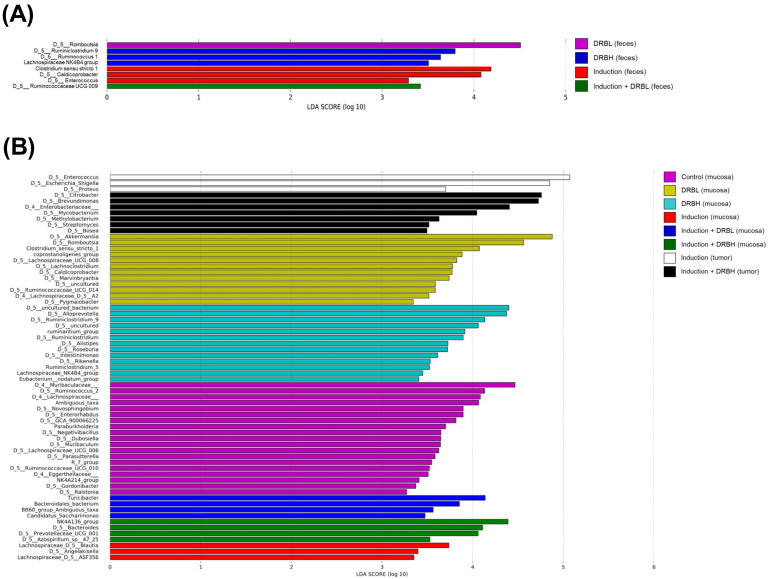
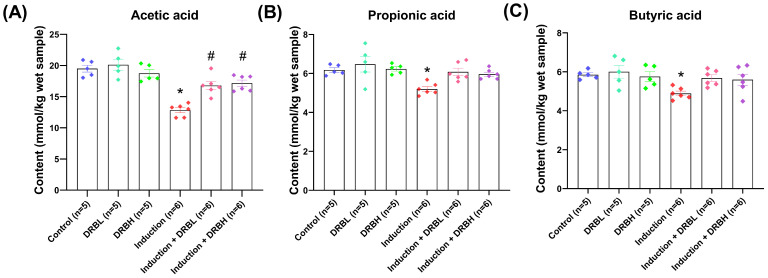
Defatted rice bran (DRB) is a by-product of rice bran derived after the oil extraction. DRB contains several bioactive compounds, including dietary fiber and phytochemicals. The supplementation with DRB manifests chemopreventive effects in terms of anti-chronic inflammation, anti-cell proliferation, and anti-tumorigenesis in the azoxymethane (AOM) and dextran sodium sulfate (DSS)-induced colitis-associated colorectal cancer (CRC) model in rats. However, little is known about its effect on gut microbiota. Herein, we investigated the effect of DRB on gut microbiota and short chain fatty acid (SCFA) production, colonic goblet cell loss, and mucus layer thickness in the AOM/DSS-induced colitis-associated CRC rat model. The results suggested that DRB enhanced the production of beneficial bacteria (Alloprevotella, Prevotellaceae UCG-001, Ruminococcus, Roseburia, Butyricicoccus) and lessened the production of harmful bacteria (Turicibacter, Clostridium sensu stricto 1, Escherichia–Shigella, Citrobacter) present in colonic feces, mucosa, and tumors. In addition, DRB also assisted the cecal SCFAs (acetate, propionate, butyrate) production. Furthermore, DRB restored goblet cell loss and improved the thickness of the mucus layer in colonic tissue. These findings suggested that DRB could be used as a prebiotic supplement to modulate gut microbiota dysbiosis, which decreases the risks of CRC, therefore encouraging further research on the utilization of DRB in various nutritional health products to promote the health-beneficial bacteria in the colon.
Overview
The claims and statistics of this paper haven’t been checked yet.
Run the check — free, no account needed. It reads the open-access text and checks the sources it cites.
Integrity signals
Registry
Cites
Statistics
Figures
Verification
Claims the paper makes
The claims and statistics of this paper haven’t been checked yet.
Run the check — free, no account needed. It reads the open-access text and checks the sources it cites.
Claims other papers make about this one
Each is checked against this paper’s own text: does it say what the citing paper says it does?
In the citing paper
“Cap used alone increased the levels of Turicibacter, Rikenella, Enterorhabdus, and Odoribacter, which are associated with intestinal inflammation and dysbiosis45–49.”
From Combining gut microbiota modulation and chemotherapy by capecitabine-loaded prebiotic nanoparticle improves colorectal cancer therapy (2023) · cites this paper as [48]
Self-check
Percentages, sums and reported differences re-computed from the paper’s own numbers.
The self-check needs the paper’s full text.
Citations
Cites
The role of short-chain fatty acids in microbiota–gut–brain communication
Dalile, B., Van Oudenhove, L., Vervliet, B., & Verbeke, K. (2019) · Nature Reviews Gastroenterology & Hepatology · doi:10.1038/s41575-019-0157-3 · Cited by 3,357
Desai, M. S., Seekatz, A. M., Koropatkin, N. M., Kamada, N., Hickey, C. A., Wolter, M., Pudlo, N. A., Kitamoto, S., Terrapon, N., Muller, A., et al. (2016) · Cell · doi:10.1016/j.cell.2016.10.043 · Cited by 2,805
Structural segregation of gut microbiota between colorectal cancer patients and healthy volunteers
Wang, T., Cai, G., Qiu, Y., Fei, N., Zhang, M., Pang, X., Jia, W., Cai, S., & Zhao, L. (2012) · The ISME Journal · doi:10.1038/ismej.2011.109 · Cited by 1,287
Host–microbiota maladaptation in colorectal cancer
Janney, A., Powrie, F., & Mann, E. H. (2020) · Nature · doi:10.1038/s41586-020-2729-3 · Cited by 445
Bacteria Penetrate the Inner Mucus Layer before Inflammation in the Dextran Sulfate Colitis Model
Johansson, M. E. V., Gustafsson, J. K., Sjöberg, K. E., Petersson, J., Holm, L., Sjövall, H., & Hansson, G. C. (2010) · PLoS ONE · doi:10.1371/journal.pone.0012238 · Cited by 368
Gut microbiota, inflammation and colorectal cancer
Sun, J., & Kato, I. (2016) · Genes & Diseases · doi:10.1016/j.gendis.2016.03.004 · Cited by 257 · cited 1×
“The gut microbiota is vital in maintaining intestinal homeostasis [2].”
Background
Research works printed but not linked: 59
- Xi, 2021, Global colorectal cancer burden in 2020 and projections to 2040, Transl. Oncol., 14, 101174, 10.1016/j.tranon.2021.101174 · DOI
- Zou, 2018, Dysbiosis of gut microbiota in promoting the development of colorectal cancer, Gastroenterol. Rep., 6, 1, 10.1093/gastro/gox031 · DOI
- Nistal, 2015, Factors Determining Colorectal Cancer: The Role of the Intestinal Microbiota, Front. Oncol., 5, 220, 10.3389/fonc.2015.00220 · DOI
- Hevia, 2015, Molecular Players Involved in the Interaction Between Beneficial Bacteria and the Immune System, Front. Microbiol., 6, 1285, 10.3389/fmicb.2015.01285 · DOI
- Sohail, 2017, Rice bran nutraceutics: A comprehensive review, Crit. Rev. Food Sci. Nutr., 57, 3771, 10.1080/10408398.2016.1164120 · DOI
- Sapwarobol, 2021, Biological Functions and Activities of Rice Bran as a Functional Ingredient: A Review, Nutr. Metab. Insights, 14, 11786388211058559, 10.1177/11786388211058559 · DOI
- Cheong, L.-Z., and Xu, X. (2019). Rice Bran and Rice Bran Oil, AOCS Press. · DOI
- So, W.K., Law, B.M., Law, P.T., Chan, C.W., and Chair, S.Y. (2016). Current Hypothesis for the Relationship between Dietary Rice Bran Intake, the Intestinal Microbiota and Colorectal Cancer Prevention. Nutrients, 8. · DOI
- Wang, H., Li, P., Du, T., Pu, G., Fan, L., Gao, C., Niu, P., Wu, C., Zhou, W., and Huang, R. (2019). Effects of Increasing Levels of Defatted Rice Bran on Intestinal Physical Barrier and Bacteria in Finishing Pigs. Animals, 9. · DOI
- Su, 2022, Co-fermented defatted rice bran alters gut microbiota and improves growth performance, antioxidant capacity, immune status and intestinal permeability of finishing pigs, Anim. Nutr., 11, 413, 10.1016/j.aninu.2022.07.008 · DOI
- Liu, 2021, Positive intervention of insoluble dietary fiber from defatted rice bran on hyperlipidemia in high fat diet fed rats, J. Food Sci., 86, 3964, 10.1111/1750-3841.15812 · DOI
- Hou, 2022, Gut microbiota-derived short-chain fatty acids and colorectal cancer: Ready for clinical translation?, Cancer Lett., 526, 225, 10.1016/j.canlet.2021.11.027 · DOI
- Śliżewska, K., Markowiak-Kopeć, P., and Śliżewska, W. (2020). The Role of Probiotics in Cancer Prevention. Cancers, 13. · DOI · Paper page
- Belcheva, 2015, Gut microbial metabolism and colon cancer: Can manipulations of the microbiota be useful in the management of gastrointestinal health?, Bioessays, 37, 403, 10.1002/bies.201400204 · DOI
- Li, 2018, Pro-and anti-inflammatory effects of short chain fatty acids on immune and endothelial cells, Eur. J. Pharmacol., 831, 52, 10.1016/j.ejphar.2018.05.003 · DOI
- Mirzaei, 2021, Role of microbiota-derived short-chain fatty acids in cancer development and prevention, Biomed. Pharmacother., 139, 111619, 10.1016/j.biopha.2021.111619 · DOI
- Zeng, 2014, Mechanisms linking dietary fiber, gut microbiota and colon cancer prevention, World J. Gastrointest. Oncol., 6, 41, 10.4251/wjgo.v6.i2.41 · DOI
- Liu, 2018, Butyrate: A Double-Edged Sword for Health?, Adv. Nutr., 9, 21, 10.1093/advances/nmx009 · DOI
- Sheflin, 2015, Pilot dietary intervention with heat-stabilized rice bran modulates stool microbiota and metabolites in healthy adults, Nutrients, 7, 1282, 10.3390/nu7021282 · DOI
- Brown, 2017, Heat-stabilised rice bran consumption by colorectal cancer survivors modulates stool metabolite profiles and metabolic networks: A randomised controlled trial, Br. J. Nutr., 117, 1244, 10.1017/S0007114517001106 · DOI
- Nair, 2016, A simple practice guide for dose conversion between animals and human, J. Basic Clin. Pharm., 7, 27, 10.4103/0976-0105.177703 · DOI · Paper page
- Ribeiro, 2018, Use of Gas Chromatography to Quantify Short Chain Fatty Acids in the Serum, Colonic Luminal Content and Feces of Mice, Bio-Protocol, 8, e3089, 10.21769/BioProtoc.3089 · DOI
- Tajasuwan, L., Kettawan, A., Rungruang, T., Wunjuntuk, K., Prombutara, P., Muangnoi, C., and Kettawan, A.K. (2022). Inhibitory Effect of Dietary Defatted Rice Bran in an AOM/DSS-Induced Colitis-Associated Colorectal Cancer Experimental Animal Model. Foods, 11. · DOI
- Koh, 2016, From Dietary Fiber to Host Physiology: Short-Chain Fatty Acids as Key Bacterial Metabolites, Cell, 165, 1332, 10.1016/j.cell.2016.05.041 · DOI · Paper page
- Nagpal, 2018, Comparative Microbiome Signatures and Short-Chain Fatty Acids in Mouse, Rat, Non-human Primate, and Human Feces, Front. Microbiol., 9, 2897, 10.3389/fmicb.2018.02897 · DOI
- Mukhopadhya, 2012, IBD—What role do Proteobacteria play?, Nat. Rev. Gastroenterol. Hepatol., 9, 219, 10.1038/nrgastro.2012.14 · DOI · Paper page
- Rizzatti, 2017, Proteobacteria: A Common Factor in Human Diseases, Biomed. Res. Int., 2017, 9351507, 10.1155/2017/9351507 · DOI
- Lee, 2021, Role of the global gut microbial community in the development of colitis-associated cancer in a murine model, Biomed. Pharmacother., 135, 111206, 10.1016/j.biopha.2020.111206 · DOI
- Umar, 2012, Citrobacter Infection and Wnt signaling, Curr. Color. Cancer Rep., 8, 298
- Keku, 2015, The gastrointestinal microbiota and colorectal cancer, Am. J. Physiol. Gastrointest. Liver Physiol., 308, G351, 10.1152/ajpgi.00360.2012 · DOI
- Park, 2021, Fecal Microbiota and Gut Microbe-Derived Extracellular Vesicles in Colorectal Cancer, Front. Oncol., 11, 650026, 10.3389/fonc.2021.650026 · DOI
- Pierce, 2018, Could Mycobacterium avium subspecies paratuberculosis cause Crohn’s disease, ulcerative colitis…and colorectal cancer?, Infect. Agent. Cancer, 13, 1, 10.1186/s13027-017-0172-3 · DOI
- Hou, 2021, Dietary Fiber, Gut Microbiota, Short-Chain Fatty Acids, and Host Metabolism, Am. J. Life Sci., 9, 162, 10.11648/j.ajls.20210906.12 · DOI
- Abreu, 2021, Dietary fiber and the microbiota: A narrative review by a group of experts from the Asociación Mexicana de Gastroenterología, Rev. Gastroenterol. Mex., 86, 287
- Tian, 2021, Effects of Short-Term Dietary Fiber Intervention on Gut Microbiota in Young Healthy People, Diabetes Metab. Syndr. Obes., 14, 3507, 10.2147/DMSO.S313385 · DOI
- Wang, 2021, Amelioration of AOM/DSS-Induced Murine Colitis-Associated Cancer by Evodiamine Intervention is Primarily Associated with Gut Microbiota-Metabolism-Inflammatory Signaling Axis, Front. Pharmacol., 12, 797605, 10.3389/fphar.2021.797605 · DOI · Paper page
- Geirnaert, 2017, Butyrate-producing bacteria supplemented in vitro to Crohn’s disease patient microbiota increased butyrate production and enhanced intestinal epithelial barrier integrity, Sci. Rep., 7, 11450, 10.1038/s41598-017-11734-8 · DOI
- Smida, 2017, Roseburia spp.: A marker of health?, Future Microbiol., 12, 157, 10.2217/fmb-2016-0130 · DOI
- Sivamaruthi, 2020, The Role of Probiotics in Colorectal Cancer Management, Evid. Based Complement. Alternat. Med., 2020, 3535982, 10.1155/2020/3535982 · DOI
- Landskron, 2019, Short Chain Fatty Acids (SCFAs)-Mediated Gut Epithelial and Immune Regulation and Its Relevance for Inflammatory Bowel Diseases, Front. Immunol., 10, 277, 10.3389/fimmu.2019.00277 · DOI · Paper page
- Geerlings, S.Y., Kostopoulos, I., de Vos, W.M., and Belzer, C. (2018). Akkermansia muciniphila in the Human Gastrointestinal Tract: When, Where, and How?. Microorganisms, 6. · DOI
- Plamada, D., and Vodnar, D.C. (2021). Polyphenols-Gut Microbiota Interrelationship: A Transition to a New Generation of Prebiotics. Nutrients, 14. · DOI
- Schneeberger, 2015, Akkermansia muciniphila inversely correlates with the onset of inflammation, altered adipose tissue metabolism and metabolic disorders during obesity in mice, Sci. Rep., 5, 16643, 10.1038/srep16643 · DOI · Paper page
- Wang, 2022, Akkermansia muciniphila administration exacerbated the development of colitis-associated colorectal cancer in mice, J. Cancer, 13, 124, 10.7150/jca.63578 · DOI
- Nealon, 2019, Bifidobacterium longum-fermented rice bran and rice bran supplementation affects the gut microbiome and metabolome, Benef. Microbes, 10, 823, 10.3920/BM2019.0017 · DOI
- Parker, K.D., Maurya, A.K., Ibrahim, H., Rao, S., Hove, P.R., Kumar, D., Kant, R., Raina, B., Agarwal, R., and Kuhn, K.A. (2021). Dietary Rice Bran-Modified Human Gut Microbial Consortia Confers Protection against Colon Carcinogenesis Following Fecal Transfaunation. Biomedicines, 9. · DOI
- Zhao, G., Zhang, R., Huang, F., Dong, L., Liu, L., Jia, X., Chi, J., Ma, Y., Deng, M., and Chen, Y. (2022). Hydrolyzed Bound Phenolics from Rice Bran Alleviate Hyperlipidemia and Improve Gut Microbiota Dysbiosis in High-Fat-Diet Fed Mice. Nutrients, 14. · DOI
- Komiyama, 2011, New prebiotics from rice bran ameliorate inflammation in murine colitis models through the modulation of intestinal homeostasis and the mucosal immune system, Scand. J. Gastroenterol., 46, 40, 10.3109/00365521.2010.513062 · DOI
- Islam, J., Koseki, T., Watanabe, K., Budijanto, S., Oikawa, A., Alauddin, M., Goto, T., Aso, H., Komai, M., and Shirakawa, H. (2017). Dietary Supplementation of Fermented Rice Bran Effectively Alleviates Dextran Sodium Sulfate-Induced Colitis in Mice. Nutrients, 9. · DOI
- Solomon, 2010, The dextran sulphate sodium (DSS) model of colitis: An overview, Comp. Clin. Path., 19, 235, 10.1007/s00580-010-0979-4 · DOI
- Birchenough, 2015, New developments in goblet cell mucus secretion and function, Mucosal Immunol., 8, 712, 10.1038/mi.2015.32 · DOI
- Duangnumsawang, 2021, Development and Functional Properties of Intestinal Mucus Layer in Poultry, Front. Immunol., 12, 745849, 10.3389/fimmu.2021.745849 · DOI
- Grondin, 2020, Mucins in Intestinal Mucosal Defense and Inflammation: Learning From Clinical and Experimental Studies, Front. Immunol., 11, 2054, 10.3389/fimmu.2020.02054 · DOI
- Kim, 2010, Intestinal goblet cells and mucins in health and disease: Recent insights and progress, Curr. Gastroenterol. Rep., 12, 319, 10.1007/s11894-010-0131-2 · DOI
- Schroeder, 2019, Fight them or feed them: How the intestinal mucus layer manages the gut microbiota, Gastroenterol. Rep., 7, 3, 10.1093/gastro/goy052 · DOI · Paper page
- Paone, 2020, Mucus barrier, mucins and gut microbiota: The expected slimy partners?, Gut, 69, 2232, 10.1136/gutjnl-2020-322260 · DOI
- Fang, 2021, Slimy partners: The mucus barrier and gut microbiome in ulcerative colitis, Exp. Mol. Med., 53, 772, 10.1038/s12276-021-00617-8 · DOI
- Wang, 2020, Soluble dietary fiber protects intestinal mucosal barrier by improving intestinal flora in a murine model of sepsis, Biomed. Pharmacother., 129, 110343, 10.1016/j.biopha.2020.110343 · DOI
- Brownlee, 2003, Colonic mucus: Secretion and turnover in relation to dietary fibre intake, Proc. Nutr. Soc., 62, 245, 10.1079/PNS2003206 · DOI
Cited by
Sorted by citations
Lang, T., Zhu, R., Zhu, X., Yan, W., Li, Y., Zhai, Y., Wu, T., Huang, X., Yin, Q., & Li, Y. (2023) · Nature Communications · doi:10.1038/s41467-023-40439-y · Cited by 133
Metadata
- Authors
- Tajasuwan, L., Kettawan, A., Rungruang, T., Wunjuntuk, K., & Prombutara, P.
- Venue
- Nutrients
- Publisher
- MDPI AG
- Published
- 2023-03-22
- Volume
- 15
- Issue
- 6
- Pages
- 1528
- ISSN
- 2072-6643
- PMC
- PMC10052090
- Cited by
- 49
- References
- 6
- Language
- en
- Funders
- Thailand Research Fund (TRF) and the Researchers for Industries (RRI) Scheme (PHD62I0006, PRP6405030310)
- Thai Ruam Jai Vegetable Oil Co., Ltd. (Phra Nakhon Si Ayutthaya, Thailand) (PHD62I0006, PRP6405030310)
- Agricultural Research Development Agency (Public Organization) or “ARDA” (PHD62I0006, PRP6405030310)
About these checks
Registry, retraction, Cites and statistics results are computed, not judged, with one exception: a printed reference that no index lists is read once by a model before it counts as a citation error. Claims are extracted by a model and kept only when their quote appears verbatim in the text; each cited source is then checked, with a model’s help, for whether it says what the claim relies on. Those verdicts can be wrong — read the claim’s quote and the cited source before relying on one.
Statistics and arithmetic are recomputed, not judged.
Confidence bands are shown only for fields calibrated on our annotated test set. None is calibrated yet, so no band is shown.
What counts as a claim ›How we measure confidence ›How we check this ›
Are you an author, or do you see a problem with this page? Request a review
How to cite
Cite CoChat for the checks on this page, and the paper for its own findings.
- This page
- CoChat. (2026). Citation check: Role of Dietary Defatted Rice Bran in the Modulation of Gut Microbiota in AOM/DSS-Induced Colitis-Associated Colorectal Cancer Rat Model. https://app.cochat.ai/papers/10.3390/nu15061528
- The paper
- Tajasuwan, L., Kettawan, A., Rungruang, T., Wunjuntuk, K., & Prombutara, P. (2023). Role of Dietary Defatted Rice Bran in the Modulation of Gut Microbiota in AOM/DSS-Induced Colitis-Associated Colorectal Cancer Rat Model. Nutrients. https://doi.org/10.3390/nu15061528
