

The DOI matches its Crossref record; 69 of the 69 references it cites were found in a registry or an index.
Passive Sensing of Prediction of Moment-To-Moment Depressed Mood among Undergraduates with Clinical Levels of Depression Sample Using Smartphones
Open accessAbstract
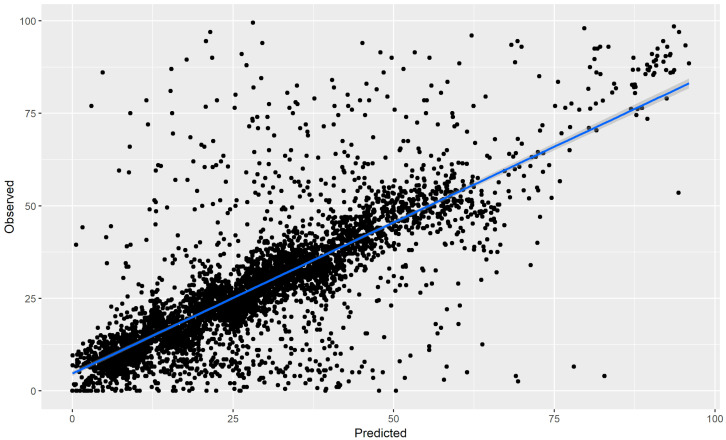
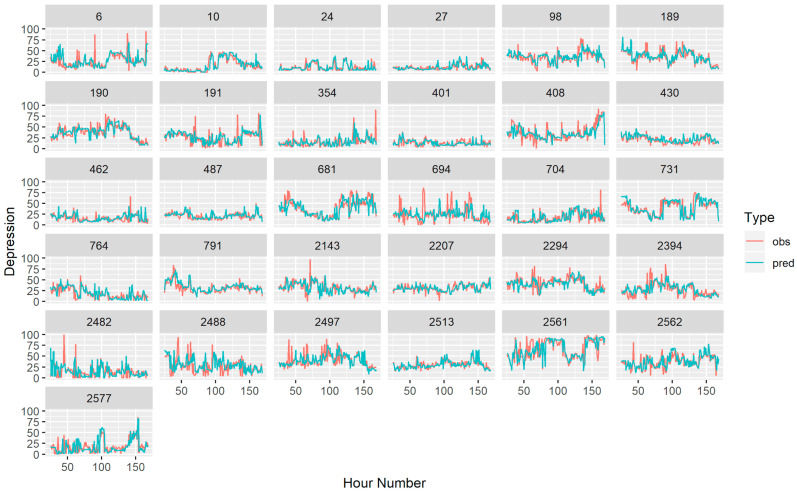
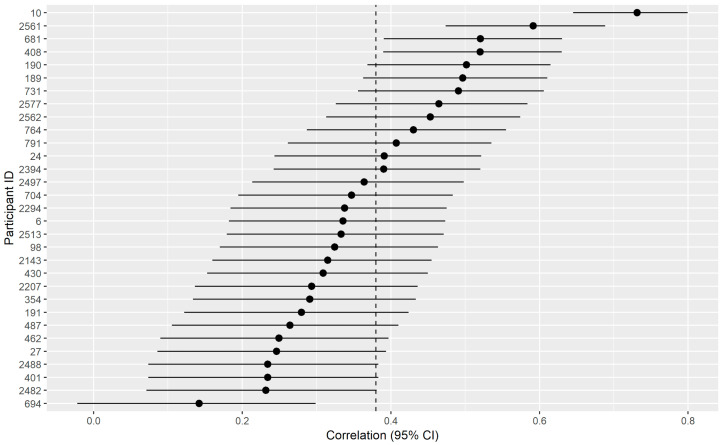
Prior research has recently shown that passively collected sensor data collected within the contexts of persons daily lives via smartphones and wearable sensors can distinguish those with major depressive disorder (MDD) from controls, predict MDD severity, and predict changes in MDD severity across days and weeks. Nevertheless, very little research has examined predicting depressed mood within a day, which is essential given the large amount of variation occurring within days. The current study utilized passively collected sensor data collected from a smartphone application to future depressed mood from hour-to-hour in an ecological momentary assessment study in a sample reporting clinical levels of depression (N = 31). Using a combination of nomothetic and idiographically-weighted machine learning models, the results suggest that depressed mood can be accurately predicted from hour to hour with an average correlation between out of sample predicted depressed mood levels and observed depressed mood of 0.587, CI [0.552, 0.621]. This suggests that passively collected smartphone data can accurately predict future depressed mood among a sample reporting clinical levels of depression. If replicated in other samples, this modeling framework may allow just-in-time adaptive interventions to treat depression as it changes in the context of daily life.
Overview
The claims and statistics of this paper haven’t been checked yet.
Run the check — free, no account needed. It reads the open-access text and checks the sources it cites.
Integrity signals
Registry
Cites
Statistics
Figures
Verification
Claims the paper makes
The claims and statistics of this paper haven’t been checked yet.
Run the check — free, no account needed. It reads the open-access text and checks the sources it cites.
Claims other papers make about this one
Each is checked against this paper’s own text: does it say what the citing paper says it does?
In the citing paper
“Multimodal and intensive sampling data streams (for example, experience sampling and passive measures gathered through smartphones and other electronic devices) used in some MBI studies133 and mental health research broadly134,135 might be particularly promising inputs for machine learning models, given that these models can often handle many correlated predictors136.”
From A common factors perspective on mindfulness-based interventions (2022) · cites this paper as [136]
In the citing paper
“This type of research has established that passive sensor data can be used to predict various symptoms of mental disorders or mental health problems (23, 33–38), as well as their future development [e.g., (39)].”
From Personalised depression forecasting using mobile sensor data and ecological momentary assessment (2022) · cites this paper as [39]
In the citing paper
“However, it has been recognised that the inherent clinical heterogeneity associated with mental disorders may necessitate a greater focus on inter-individual differences to ensure generalisability to unseen cases (39, 43, 44).”
From Personalised depression forecasting using mobile sensor data and ecological momentary assessment (2022) · cites this paper as [39]
In the citing paper
“only two studies have combined these data streams in models to monitor changing depressive symptoms (26, 27).”
From Monitoring Changes in Depression Severity Using Wearable and Mobile Sensors (2020) · cites this paper as [26]
In the citing paper
“This has resulted in possible reliability problems, since these investigations have primarily focused on detecting presence or absence of depression rather than on assessing its severity, and they have shown overall low accuracy (14–18, 23–27).”
From Monitoring Changes in Depression Severity Using Wearable and Mobile Sensors (2020) · cites this paper as [26]
In the citing paper
“Those studies conducted with patients with depression have mostly relied on self-report questionnaires to assign diagnoses and/or measure variation in symptoms and train the models.”
From Monitoring Changes in Depression Severity Using Wearable and Mobile Sensors (2020) · cites this paper as [26]
In the citing paper
“Previous models estimating mood states with moderate accuracy have included measures of heart rate (HR) (27, 44) and HRV (26).”
From Monitoring Changes in Depression Severity Using Wearable and Mobile Sensors (2020) · cites this paper as [26]
In the citing paper
“Previous evaluations of models to estimate depression passively have primarily relied on examining correlations between estimated and observed symptoms (18, 26, 27).”
From Monitoring Changes in Depression Severity Using Wearable and Mobile Sensors (2020) · cites this paper as [26]
In the citing paper
“was higher than the one of a previous model combining features from the fitbit and from smartphones (the best model yielded an r2 = 0.44 or r = 0.66) (27) and the one of a model aggregating mobile-based and physiological features (r = 0.58) (26).”
From Monitoring Changes in Depression Severity Using Wearable and Mobile Sensors (2020) · cites this paper as [26]
Self-check
Percentages, sums and reported differences re-computed from the paper’s own numbers.
The self-check needs the paper’s full text.
Citations
Cites
Geurts, P., Ernst, D., & Wehenkel, L. (2006) · Machine Learning · doi:10.1007/s10994-006-6226-1 · Cited by 9,300 · cited 1×
“Note that a grid search was used to optimize the number of trees to grow (based on a sequence of length three between the number of predictors) and to select the split tree rule based on variance or extremely randomized trees [61,62].”
Methodranger : A Fast Implementation of Random Forests for High Dimensional Data in C++ and R
Wright, M. N., & Ziegler, A. (2017) · Journal of Statistical Software · doi:10.18637/jss.v077.i01 · Cited by 4,185 · cited 1×
“Note that a grid search was used to optimize the number of trees to grow (based on a sequence of length three between the number of predictors) and to select the split tree rule based on variance or extremely randomized trees [61,62].”
MethodDepression Anxiety Stress Scales
Lovibond, S. H., & Lovibond, P. F. (2011) · PsycTESTS Dataset · doi:10.1037/t01004-000 · Cited by 2,416
Cacioppo, J. T., Hughes, M. E., Waite, L. J., Hawkley, L. C., & Thisted, R. A. (2006) · Psychology and Aging · doi:10.1037/0882-7974.21.1.140 · Cited by 2,380
Nahum-Shani, I., Smith, S. N., Spring, B. J., Collins, L. M., Witkiewitz, K., Tewari, A., & Murphy, S. A. (2018) · Annals of Behavioral Medicine · doi:10.1007/s12160-016-9830-8 · Cited by 2,171 · cited 1×
“Consequently, most prior research is unable to adequately translate to inform just-in-time adaptive interventions (JITAI) [38,39], as this research might miss important times in which persons might be experiencing depressed mood fluctuations.”
BackgroundPsychometric properties of the Depression Anxiety Stress Scales (DASS) in clinical samples
Brown, T. A., Chorpita, B. F., Korotitsch, W., & Barlow, D. H. (1997) · Behaviour Research and Therapy · doi:10.1016/s0005-7967(96)00068-x · Cited by 1,860 · cited 3×
“75 with various measures of depression [52].”
BackgroundBlanco, C., Okuda, M., Wright, C., Hasin, D. S., Grant, B. F., Liu, S.-M., & Olfson, M. (2008) · Archives of General Psychiatry · doi:10.1001/archpsyc.65.12.1429 · Cited by 1,582 · cited 3×
“45% [2] of the sample met moderate depression severity, 38.”
BackgroundLack of group-to-individual generalizability is a threat to human subjects research
Fisher, A. J., Medaglia, J. D., & Jeronimus, B. F. (2018) · Proceedings of the National Academy of Sciences · doi:10.1073/pnas.1711978115 · Cited by 1,099
Harnessing context sensing to develop a mobile intervention for depression
Burns, M. N., Begale, M., Duffecy, J., Gergle, D., Karr, C. J., Giangrande, E., & Mohr, D. C. (2011) · Journal of Medical Internet Research · doi:10.2196/jmir.1838 · Cited by 646 · cited 6×
“Of these studies, two of three studies found strong agreement between predicted and observed daily depression outcomes (although this depended upon the analytic approach) [30,36], whereas one study found that they were unable to significantly predict depressed mood within the day in a small sample [31].”
BackgroundMethodResultInfluentialTwenge, J. M., Gentile, B., DeWall, C. N., Ma, D., Lacefield, K., & Schurtz, D. R. (2009) · Clinical Psychology Review · doi:10.1016/j.cpr.2009.10.005 · Cited by 606 · cited 1×
“Studies have found that an increasing number of college students have experienced “severe psychological problems”, including suicides and crisis management, in recent years [4] and that mental health issues are affecting up to eight times as many college students as it did in the Great Depression era [5].”
BackgroundJacobson, N. C., & Newman, M. G. (2017) · Psychological Bulletin · doi:10.1037/bul0000111 · Cited by 576
Self-citationCanzian, L., & Musolesi, M. (2015) · Proceedings of the 2015 ACM International Joint Conference on Pervasive and Ubiquitous Computing · doi:10.1145/2750858.2805845 · Cited by 477
Ben-Zeev, D., Scherer, E. A., Wang, R., Xie, H., & Campbell, A. T. (2015) · Psychiatric Rehabilitation Journal · doi:10.1037/prj0000130 · Cited by 429
Exploring the idiographic dynamics of mood and anxiety via network analysis
Fisher, A. J., Reeves, J. W., Lawyer, G., Medaglia, J. D., & Rubel, J. A. (2017) · Journal of Abnormal Psychology · doi:10.1037/abn0000311 · Cited by 385
Smartphone-Based Recognition of States and State Changes in Bipolar Disorder Patients
Grunerbl, A., Muaremi, A., Osmani, V., Bahle, G., Ohler, S., Troster, G., Mayora, O., Haring, C., & Lukowicz, P. (2015) · IEEE Journal of Biomedical and Health Informatics · doi:10.1109/jbhi.2014.2343154 · Cited by 384 · cited 1×
“Other research has focused on predicting changes in depression severity across varying numbers of weeks, including across ten weeks via mobile phone location sensor data [14], eight weeks via smartphone mobile sensing and support [18], twelve weeks via smartphone data [19,20], eight weeks via a smartphone-based monito…”
MethodMobile Sensing and Support for People With Depression: A Pilot Trial in the Wild
Wahle, F., Kowatsch, T., Fleisch, E., Rufer, M., & Weidt, S. (2016) · JMIR mHealth and uHealth · doi:10.2196/mhealth.5960 · Cited by 333 · cited 2×
“[18] 8 weeks smartphone mobile sensing and support 59.”
BackgroundMethodDepressive symptoms in late life: a 10-year follow-up
Heikkinen, R.-L., & Kauppinen, M. (2004) · Archives of Gerontology and Geriatrics · doi:10.1016/j.archger.2003.10.004 · Cited by 319
The relationship between mobile phone location sensor data and depressive symptom severity
Saeb, S., Lattie, E. G., Schueller, S. M., Kording, K. P., & Mohr, D. C. (2016) · PeerJ · doi:10.7717/peerj.2537 · Cited by 313
Diurnal mood variation in major depressive disorder
Peeters, F., Berkhof, J., Delespaul, P., Rottenberg, J., & Nicolson, N. A. (2006) · Emotion · doi:10.1037/1528-3542.6.3.383 · Cited by 306 · cited 1×
“Secondly, two of the three studies did not examine depressed mood within days, which neglects the substantial mood changes in MDD across a single day [32], rapid mood fluctuations on an hourly basis [33,35,36], and a great deal of variation in depressed mood not being stable across more than several hours [37].”
BackgroundPsychometric properties of the Depression Anxiety Stress Scales (DASS) in depressed clinical samples
Page, A. C., Hooke, G. R., & Morrison, D. L. (2007) · British Journal of Clinical Psychology · doi:10.1348/014466506x158996 · Cited by 301
Toward a dynamic model of psychological assessment: Implications for personalized care.
Fisher, A. J. (2015) · Journal of Consulting and Clinical Psychology · doi:10.1037/ccp0000026 · Cited by 271
Depression and Cardiovascular Disorders
Whooley, M. A., & Wong, J. M. (2013) · Annual Review of Clinical Psychology · doi:10.1146/annurev-clinpsy-050212-185526 · Cited by 241 · cited 1×
“This implies that current undergraduate students are more prone to the fatal conditions associated with major depressive disorder (MDD) such as cardiovascular disease, diabetes mellitus [6] and notably death by suicide [7].”
BackgroundAutomatic detection of social rhythms in bipolar disorder
Abdullah, S., Matthews, M. L., Frank, E., Doherty, G. J., Gay, G. K., & Choudhury, T. (2016) · Journal of the American Medical Informatics Association · doi:10.1093/jamia/ocv200 · Cited by 235 · cited 1×
“Although such research has favored idiographic modeling techniques over between-person work [44], this shift as an either idiographic or nomothetic methods as dichotomous decisions is a contrived dichotomy [45].”
BackgroundZulueta, J., Piscitello, A., Rasic, M., Easter, R., Babu, P., Langenecker, S. A., McInnis, M., Ajilore, O., Nelson, P. C., Ryan, K., et al. (2018) · Journal of Medical Internet Research · doi:10.2196/jmir.9775 · Cited by 233 · cited 1×
“Other research has focused on predicting changes in depression severity across varying numbers of weeks, including across ten weeks via mobile phone location sensor data [14], eight weeks via smartphone mobile sensing and support [18], twelve weeks via smartphone data [19,20], eight weeks via a smartphone-based monito…”
MethodJacobson, N. C., Lekkas, D., Price, G. D., Heinz, M. V., Song, M., O’Malley, A., & Barr, P. J. (2020) · JMIR Mental Health · doi:10.2196/19347 · Cited by 197 · cited 1×
“Additionally, future work should also consider potential digital phenotypes of observed environmental stressors, given their potential for societal impacts on mood [69,70].”
BackgroundSelf-citationUsing Smartphones to Monitor Bipolar Disorder Symptoms: A Pilot Study
Beiwinkel, T., Kindermann, S., Maier, A., Kerl, C., Moock, J., Barbian, G., & Rössler, W. (2016) · JMIR Mental Health · doi:10.2196/mental.4560 · Cited by 191 · cited 1×
“Other research has focused on predicting changes in depression severity across varying numbers of weeks, including across ten weeks via mobile phone location sensor data [14], eight weeks via smartphone mobile sensing and support [18], twelve weeks via smartphone data [19,20], eight weeks via a smartphone-based monito…”
MethodSmartphone data as objective measures of bipolar disorder symptoms
Faurholt-Jepsen, M., Frost, M., Vinberg, M., Christensen, E. M., Bardram, J. E., & Kessing, L. V. (2014) · Psychiatry Research · doi:10.1016/j.psychres.2014.03.009 · Cited by 185 · cited 1×
“Other research has focused on predicting changes in depression severity across varying numbers of weeks, including across ten weeks via mobile phone location sensor data [14], eight weeks via smartphone mobile sensing and support [18], twelve weeks via smartphone data [19,20], eight weeks via a smartphone-based monito…”
MethodDetecting Bipolar Depression From Geographic Location Data
Palmius, N., Tsanas, A., Saunders, K. E. A., Bilderbeck, A. C., Geddes, J. R., Goodwin, G. M., & De Vos, M. (2017) · IEEE Transactions on Biomedical Engineering · doi:10.1109/tbme.2016.2611862 · Cited by 180 · cited 1×
“Other research has focused on predicting changes in depression severity across varying numbers of weeks, including across ten weeks via mobile phone location sensor data [14], eight weeks via smartphone mobile sensing and support [18], twelve weeks via smartphone data [19,20], eight weeks via a smartphone-based monito…”
MethodChow, P. I., Fua, K., Huang, Y., Bonelli, W., Xiong, H., Barnes, L. E., & Teachman, B. A. (2017) · Journal of Medical Internet Research · doi:10.2196/jmir.6820 · Cited by 172
Digital Biomarkers of Social Anxiety Severity: Digital Phenotyping Using Passive Smartphone Sensors
Jacobson, N. C., Summers, B., & Wilhelm, S. (2020) · Journal of Medical Internet Research · doi:10.2196/16875 · Cited by 162 · cited 1×
“In particular, anxiety is related to digital biomarkers [63,64] and is highly interrelated to depression across time [65–68].”
BackgroundSelf-citationDigital biomarkers of mood disorders and symptom change
Jacobson, N. C., Weingarden, H., & Wilhelm, S. (2019) · npj Digital Medicine · doi:10.1038/s41746-019-0078-0 · Cited by 160 · cited 1×
“8% [17] met very severe depression severity [49].”
BackgroundSelf-citationOpen trial of a personalized modular treatment for mood and anxiety
Fisher, A. J., Bosley, H. G., Fernandez, K. C., Reeves, J. W., Soyster, P. D., Diamond, A. E., & Barkin, J. (2019) · Behaviour Research and Therapy · doi:10.1016/j.brat.2019.01.010 · Cited by 156
Avoidance mediates the relationship between anxiety and depression over a decade later
Jacobson, N. C., & Newman, M. G. (2014) · Journal of Anxiety Disorders · doi:10.1016/j.janxdis.2014.03.007 · Cited by 149
Self-citationFaurholt-Jepsen, M., Vinberg, M., Frost, M., Debel, S., Margrethe Christensen, E., Bardram, J. E., & Kessing, L. V. (2016) · International Journal of Methods in Psychiatric Research · doi:10.1002/mpr.1502 · Cited by 146 · cited 1×
“Other research has focused on predicting changes in depression severity across varying numbers of weeks, including across ten weeks via mobile phone location sensor data [14], eight weeks via smartphone mobile sensing and support [18], twelve weeks via smartphone data [19,20], eight weeks via a smartphone-based monito…”
MethodGruenerbl, A., Osmani, V., Bahle, G., Carrasco, J. C., Oehler, S., Mayora, O., Haring, C., & Lukowicz, P. (2014) · Proceedings of the 5th Augmented Human International Conference · doi:10.1145/2582051.2582089 · Cited by 139 · cited 1×
“Other research has focused on predicting changes in depression severity across varying numbers of weeks, including across ten weeks via mobile phone location sensor data [14], eight weeks via smartphone mobile sensing and support [18], twelve weeks via smartphone data [19,20], eight weeks via a smartphone-based monito…”
MethodCognitive-Behavioral Therapy in the Digital Age: Presidential Address
Wilhelm, S., Weingarden, H. M., Ladis, I., Braddick, V., Shin, J. Y., & Jacobson, N. C. (2019) · Behavior Therapy · doi:10.1016/j.beth.2019.08.001 · Cited by 128 · cited 1×
“Consequently, most prior research is unable to adequately translate to inform just-in-time adaptive interventions (JITAI) [38,39], as this research might miss important times in which persons might be experiencing depressed mood fluctuations.”
BackgroundSelf-citationCurrent research and trends in the use of smartphone applications for mood disorders
Torous, J., & Powell, A. C. (2015) · Internet Interventions · doi:10.1016/j.invent.2015.03.002 · Cited by 121 · cited 2×
“, heart rate and heart rate variability using photoplethysmographic signals) with digital phenotyping of depression [47].”
BackgroundMethodThe accuracy of passive phone sensors in predicting daily mood
Pratap, A., Atkins, D. C., Renn, B. N., Tanana, M. J., Mooney, S. D., Anguera, J. A., & Areán, P. A. (2019) · Depression and Anxiety · doi:10.1002/da.22822 · Cited by 119
Diurnal mood variation in depression: A signal of disturbed circadian function?
Murray, G. (2007) · Journal of Affective Disorders · doi:10.1016/j.jad.2006.12.001 · Cited by 118 · cited 1×
“Secondly, two of the three studies did not examine depressed mood within days, which neglects the substantial mood changes in MDD across a single day [32], rapid mood fluctuations on an hourly basis [33,35,36], and a great deal of variation in depressed mood not being stable across more than several hours [37].”
BackgroundMobile Phone Detection of Semantic Location and Its Relationship to Depression and Anxiety
Saeb, S., Lattie, E. G., Kording, K. P., & Mohr, D. C. (2017) · JMIR mhealth and uhealth · doi:10.2196/mhealth.7297 · Cited by 116 · cited 2×
“[11] 3–6 weeks mobile phone sensors and location data AUC = 0.”
BackgroundMethodJacobson, N. C., Lord, K. A., & Newman, M. G. (2017) · Journal of Affective Disorders · doi:10.1016/j.jad.2017.01.011 · Cited by 109
Self-citationUsing digital phenotyping to accurately detect depression severity
Jacobson, N. C., Weingarden, H., & Wilhelm, S. (2019) · Journal of Nervous & Mental Disease · doi:10.1097/nmd.0000000000001042 · Cited by 94
Self-citationJoint modeling of heterogeneous sensing data for depression assessment via multi-task learning
Lu, J., Shang, C., Yue, C., Morillo, R., Ware, S., Kamath, J., Bamis, A., Russell, A., Wang, B., & Bi, J. (2018) · Proceedings of the ACM on Interactive Mobile Wearable and Ubiquitous Technologies · doi:10.1145/3191753 · Cited by 85 · cited 2×
“[24] 13 weeks smartphone sensors and wearable sensors R 2 = 0.”
BackgroundMethodThirty Years of the National Survey of Counseling Center Directors: A Personal Account
Gallagher, R. P. (2012) · Journal of College Student Psychotherapy · doi:10.1080/87568225.2012.685852 · Cited by 83 · cited 1×
“Studies have found that an increasing number of college students have experienced “severe psychological problems”, including suicides and crisis management, in recent years [4] and that mental health issues are affecting up to eight times as many college students as it did in the Great Depression era [5].”
BackgroundSmartphones in Mental Health: Detecting Depressive and Manic Episodes
Osmani, V. (2015) · IEEE Pervasive Computing · doi:10.1109/mprv.2015.54 · Cited by 82 · cited 1×
“Other research has focused on predicting changes in depression severity across varying numbers of weeks, including across ten weeks via mobile phone location sensor data [14], eight weeks via smartphone mobile sensing and support [18], twelve weeks via smartphone data [19,20], eight weeks via a smartphone-based monito…”
Method“Being all alone makes me sad”: loneliness in older adults with depressive symptoms
van Beljouw, I. M. J., van Exel, E. R., Gierveld, J. D. J., Comijs, H. C., Heerings, M., Stek, M. L., & van Marwijk, H. (2014) · International Psychogeriatrics · doi:10.1017/s1041610214000581 · Cited by 80
Mehrotra, A., Hendley, R., & Musolesi, M. (2016) · ACM International Joint Conference on Pervasive and Ubiquitous Computing (UbiComp) · doi:10.1145/2968219.2968299 · Cited by 77
The Idiographic / Nomothetic Dichotomy: Tracing Historical Origins of Contemporary Confusions
Robinson, O. C. (2011) · History & Philosophy of Psychology · doi:10.53841/bpshpp.2011.13.2.32 · Cited by 71 · cited 1×
“Although such research has favored idiographic modeling techniques over between-person work [44], this shift as an either idiographic or nomothetic methods as dichotomous decisions is a contrived dichotomy [45].”
BackgroundAssessing Bipolar Episodes Using Speech Cues Derived from Phone Calls
Muaremi, A., Gravenhorst, F., Grünerbl, A., Bert Arnrich, A., & Tröster, G. (2014) · Lecture notes of the Institute for Computer Sciences, Social Informatics and Telecommunications Engineering · doi:10.1007/978-3-319-11564-1_11 · Cited by 62
Arving, C., Glimelius, B. L. G., & Brandberg, Y. (2007) · Quality of Life Research · doi:10.1007/s11136-007-9275-4 · Cited by 62 · cited 1×
“67) between sadness and loneliness [59].”
Multi-view Bi-clustering to Identify Smartphone Sensing Features Indicative of Depression
Farhan, A. A., Lu, J., Bi, J., Russell, A., Wang, B., & Bamis, A. (2016) · 2016 IEEE First International Conference on Connected Health: Applications, Systems and Engineering Technologies (CHASE) · doi:10.1109/chase.2016.27 · Cited by 61 · cited 1×
“7% [12] of the sample met severe depression severity, and 54.”
BackgroundJacobson, N. C., & Newman, M. G. (2015) · Depression and Anxiety · doi:10.1002/da.22402 · Cited by 60
Self-citationBolkhovsky, J., Scully, C. G., & Chon, K. H. (2012) · doi:10.1109/embc.2012.6346253 · Cited by 58
Identification and characterization of greater mood variance in depression
Hall, D. P., Sing, H. C., & Romanoski, A. J. (1991) · American Journal of Psychiatry · doi:10.1176/ajp.148.10.1341 · Cited by 57
Elections Have Consequences for Student Mental Health: An Accidental Daily Diary Study
Roche, M. J., & Jacobson, N. C. (2018) · Psychological Reports · doi:10.1177/0033294118767365 · Cited by 53 · cited 1×
“Additionally, future work should also consider potential digital phenotypes of observed environmental stressors, given their potential for societal impacts on mood [69,70].”
BackgroundSelf-citationCollege Student Adjustment and Coping
Cousins, C. L., Servaty‐Seib, H. L., & Lockman, J. D. (2016) · OMEGA - Journal of Death and Dying · doi:10.1177/0030222815598911 · Cited by 50
Loneliness in Relation to Depression and Self-Esteem
Ouellet, R., & Joshi, P. (1986) · Psychological Reports · doi:10.2466/pr0.1986.58.3.821 · Cited by 49
Detection of behavior change in people with depression
Doryab, A., Min, J. K., Wiese, J., et al. (2018) · KiltHub Repository · doi:10.1184/r1/6469988.v1 · Cited by 46
Detection of behavior change in people with depression
Doryab, A., Min, J. K., Wiese, J., Zimmerman, J., & Hong, J. I. (2018) · KiltHub Repository · doi:10.1184/r1/6469988 · Cited by 45
Large-scale Automatic Depression Screening Using Meta-data from WiFi Infrastructure
Ware, S., Yue, C., Morillo, R., Lü, J., Shang, C., Kamath, J., Bamis, A., Bi, J., Russell, A. C., & Wang, B. (2018) · Proceedings of the ACM on Interactive Mobile Wearable and Ubiquitous Technologies · doi:10.1145/3287073 · Cited by 41
Wardenaar, K. J., Wanders, R. B. K., Jeronimus, B. F., & de Jonge, P. (2017) · Journal of Psychopathology and Behavioral Assessment · doi:10.1007/s10862-017-9626-6 · Cited by 37 · cited 1×
“Discriminant validity has been demonstrated by studies showing that this measure is capable of discriminating depression from other disorders such as panic disorder and generalized anxiety disorder [52], performing best in the mild-moderate severity [53].”
BackgroundAffective models of depression and anxiety: Extension to within-person processes in daily life
Naragon-Gainey, K. (2019) · Journal of Affective Disorders · doi:10.1016/j.jad.2018.09.061 · Cited by 37 · cited 1×
“Secondly, two of the three studies did not examine depressed mood within days, which neglects the substantial mood changes in MDD across a single day [32], rapid mood fluctuations on an hourly basis [33,35,36], and a great deal of variation in depressed mood not being stable across more than several hours [37].”
BackgroundVariability of activity patterns across mood disorders and time of day
Krane‐Gartiser, K., Vaaler, A. E., Fasmer, O. B., Sørensen, K., Morken, G., & Scott, J. L. (2017) · BMC Psychiatry · doi:10.1186/s12888-017-1574-x · Cited by 33
Individualizing Risk Assessment: Balancing Idiographic and Nomothetic Data
DeMatteo, D. S., Batastini, A. B., Foster, E. E., & Hunt, E. D. (2010) · Journal of Forensic Psychology Practice · doi:10.1080/15228932.2010.481244 · Cited by 23 · cited 1×
“In contrast, idiographic and nomothetic models might be balanced by weighting an individual heavily, but still being informed by the general context of others, which has been proposed in prior reviews [46].”
BackgroundJacobson, N. C., & O’Cleirigh, C. M. (2019) · The British Journal of Psychiatry · doi:10.1192/bjp.2019.168 · Cited by 20 · cited 1×
“In particular, anxiety is related to digital biomarkers [63,64] and is highly interrelated to depression across time [65–68].”
BackgroundSelf-citationThe Structure of Depression in Community Based Young Adolescent, Older Adolescent, and Adult Mothers
Reis, J. (1989) · Family Relations · doi:10.2307/583670 · Cited by 15 · cited 8×
“With the promise of current assessments in detecting fine-grained changes in depressed mood across time, digital phenotyping and machine learning may facilitate a new area of time-specific precision medicine to enhance care scalable among those with MDD. Sensors 2020, 20, 3572 13 of 16 Author Contributions: N.C.J. ini…”
BackgroundInfluentialBradley, K. L., Santor, D. A., & Oram, R. (2016) · Canadian Journal of Community Mental Health · doi:10.7870/cjcmh-2015-025 · Cited by 8 · cited 2×
“also associated with lower grade point averages, dropping more courses and missing more classes, exams, and assignments as well as social activities [7].”
BackgroundCollege Student Adjustment and Coping for Bereaved and Nonbereaved College Students
Cousins, C. L., Servaty‐Seib, H. L., & Lockman, J. D. (2014) · PsycEXTRA Dataset · doi:10.1037/e563502014-001 · Cited by 3
Recognition and Treatment of Depression
Swartz, H. A. (2005) · The AMA Journal of Ethic · doi:10.1001/virtualmentor.2005.7.6.cprl1-0506 · Cited by 2
Research works printed but not linked: 1
- Krane-Gartiser, K., Vaaler, A.E., Fasmer, O.B., Sørensen, K., Morken, G., and Scott, J. (2017). Variability of activity patterns across mood disorders and time of day. BMC Psychiat., 17. · DOI
Cited by
Sorted by citations
Ecological momentary interventions for mental health: A scoping review
Balaskas, A., Schueller, S. M., Cox, A. L., & Doherty, G. (2021) · PLOS ONE · doi:10.1371/journal.pone.0248152 · Cited by 235
Wearable, Environmental, and Smartphone-Based Passive Sensing for Mental Health Monitoring
Sheikh, M., Qassem, M., & Kyriacou, P. A. (2021) · Frontiers in Digital Health · doi:10.3389/fdgth.2021.662811 · Cited by 210
Digital Phenotyping for Monitoring Mental Disorders: Systematic Review
Bufano, P., Laurino, M., Said, S., Tognetti, A., & Menicucci, D. (2023) · Journal of Medical Internet Research · doi:10.2196/46778 · Cited by 210
“Jacobson and Chung [25] attempted to predict depressive mood hour-by-hour in a sample of 31 college students with major depressive disorder.”
Monitoring Changes in Depression Severity Using Wearable and Mobile Sensors
Pedrelli, P., Fedor, S., Ghandeharioun, A., Howe, E., Ionescu, D. F., Bhathena, D., Fisher, L. B., Cusin, C., Nyer, M., Yeung, A., et al. (2020) · Frontiers in Psychiatry · doi:10.3389/fpsyt.2020.584711 · Cited by 158
“Previous evaluations of models to estimate depression passively have primarily relied on examining correlations between estimated and observed symptoms (18, 26, 27).”
BackgroundMethodPersonalized machine learning of depressed mood using wearables
Shah, R. V., Grennan, G., Zafar-Khan, M., Alim, F., Dey, S., Ramanathan, D., & Mishra, J. (2021) · Translational Psychiatry · doi:10.1038/s41398-021-01445-0 · Cited by 123
Metadata
- Authors
- Jacobson, N. C., & Chung, Y. J.
- Affiliations
- Dartmouth College (US)
- Corresponding author
- Jacobson, Nicholas C.
- Venue
- Sensors
- Publisher
- MDPI AG
- Published
- 2020-06-24
- Volume
- 20
- Issue
- 12
- Pages
- 3572
- ISSN
- 1424-8220 (ISSN-L)
- PMC
- PMC7349045
- OpenAlex
- W3037651932
- Cited by
- 139
- References
- 69
- Citations by year
- 2026: 23 · 2025: 28 · 2024: 23 · 2023: 18 · 2022: 23 · 2021: 21 · 2020: 3
- FWCI
- 15.72
- Type
- journal article
- Language
- en
- Open access
- gold
- dx.doi.org
- Licence
- Locations
- Sensors (publishedVersion, cc-by)
- PubMed Central (publishedVersion, cc-by)
- PubMed (publishedVersion)
- DOAJ (DOAJ: Directory of Open Access Journals) (submittedVersion, cc-by-sa)
- Funders
- National Institute on Drug Abuse (P30DA029926)
- Topics
- Social Sciences › Psychology › Experimental and Cognitive Psychology › Mental Health Research Topics
- Social Sciences › Psychology › Applied Psychology › Digital Mental Health Interventions
- Physical Sciences › Computer Science › Artificial Intelligence › Emotion and Mood Recognition
- Keywords
- passive sensing, major depressive disorder, smartphone sensor data, ecological momentary assessment, just-in-time adaptive interventions
- MeSH terms
- Smartphone, Affect, Depressive Disorder, Major, Major Depressive Disorder, Humans, Students
About these checks
Registry, retraction, Cites and statistics results are computed, not judged, with one exception: a printed reference that no index lists is read once by a model before it counts as a citation error. Claims are extracted by a model and kept only when their quote appears verbatim in the text; each cited source is then checked, with a model’s help, for whether it says what the claim relies on. Those verdicts can be wrong — read the claim’s quote and the cited source before relying on one.
Statistics and arithmetic are recomputed, not judged.
Confidence bands are shown only for fields calibrated on our annotated test set. None is calibrated yet, so no band is shown.
What counts as a claim ›How we measure confidence ›How we check this ›
Are you an author, or do you see a problem with this page? Request a review
