

Pressure for Pattern-Specific Intertypic Recombination between Sabin Polioviruses: Evolutionary Implications
Open accessThe DOI matches its Crossref record; 55 of the 56 references it cites were found in a registry or an index.
Abstract
Complete genomic sequences of a non-redundant set of 70 recombinants between three serotypes of attenuated Sabin polioviruses as well as location (based on partial sequencing) of crossover sites of 28 additional recombinants were determined and compared with the previously published data. It is demonstrated that the genomes of Sabin viruses contain distinct strain-specific segments that are eliminated by recombination. The presumed low fitness of these segments could be linked to mutations acquired upon derivation of the vaccine strains and/or may have been present in wild-type parents of Sabin viruses. These “weak” segments contribute to the propensity of these viruses to recombine with each other and with other enteroviruses as well as determine the choice of crossover sites. The knowledge of location of such segments opens additional possibilities for the design of more genetically stable and/or more attenuated variants, i.e., candidates for new oral polio vaccines. The results also suggest that the genome of wild polioviruses, and, by generalization, of other RNA viruses, may harbor hidden low-fitness segments that can be readily eliminated only by recombination.
Overview
The claims and statistics of this paper haven’t been checked yet.
Free: it reads the open-access text and checks the first 5 claims that cite a source we can check. Create a free account to check every claim.
Integrity signals
Registry
Cites
Statistics
Figures
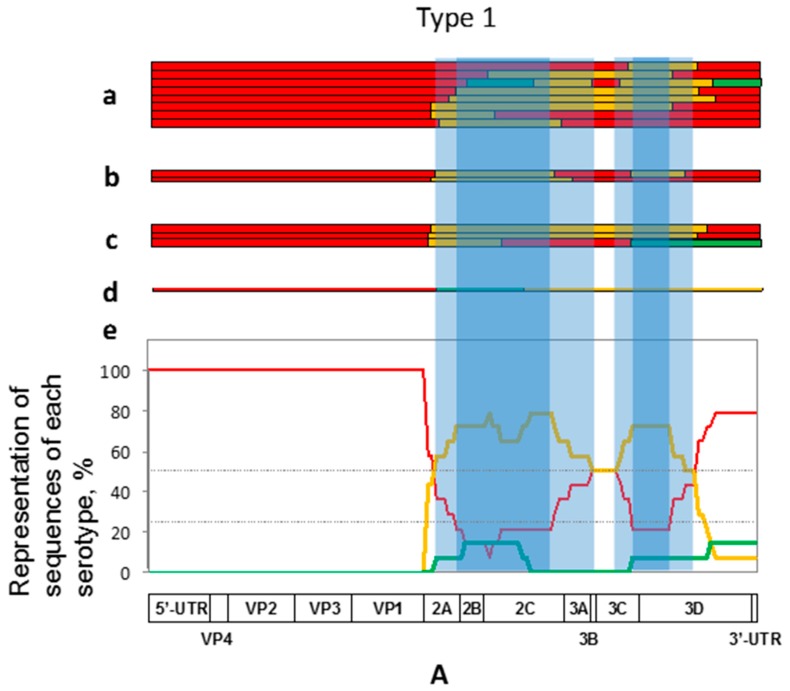
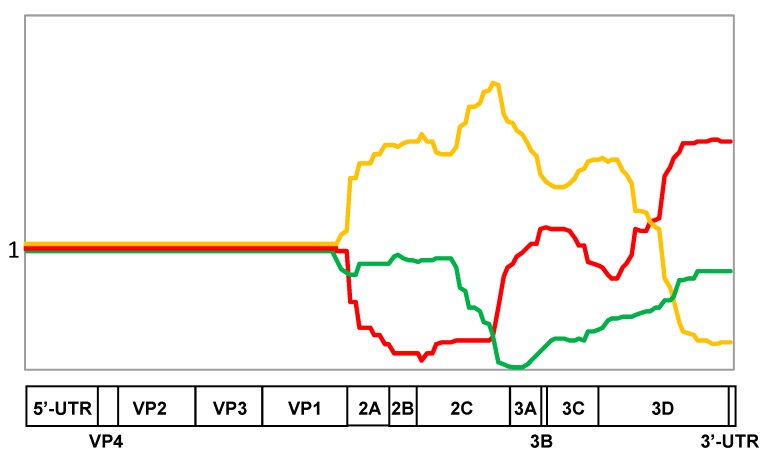
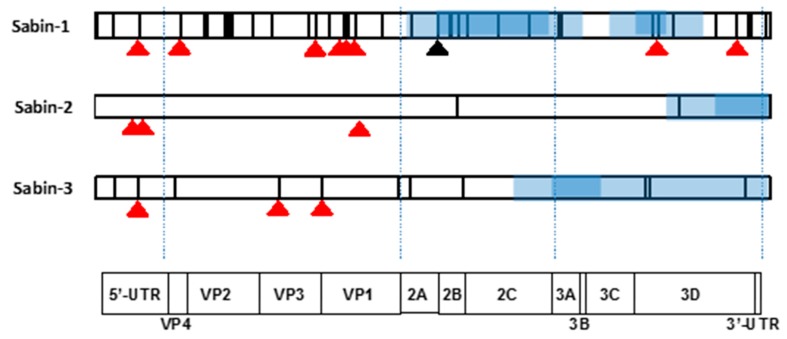

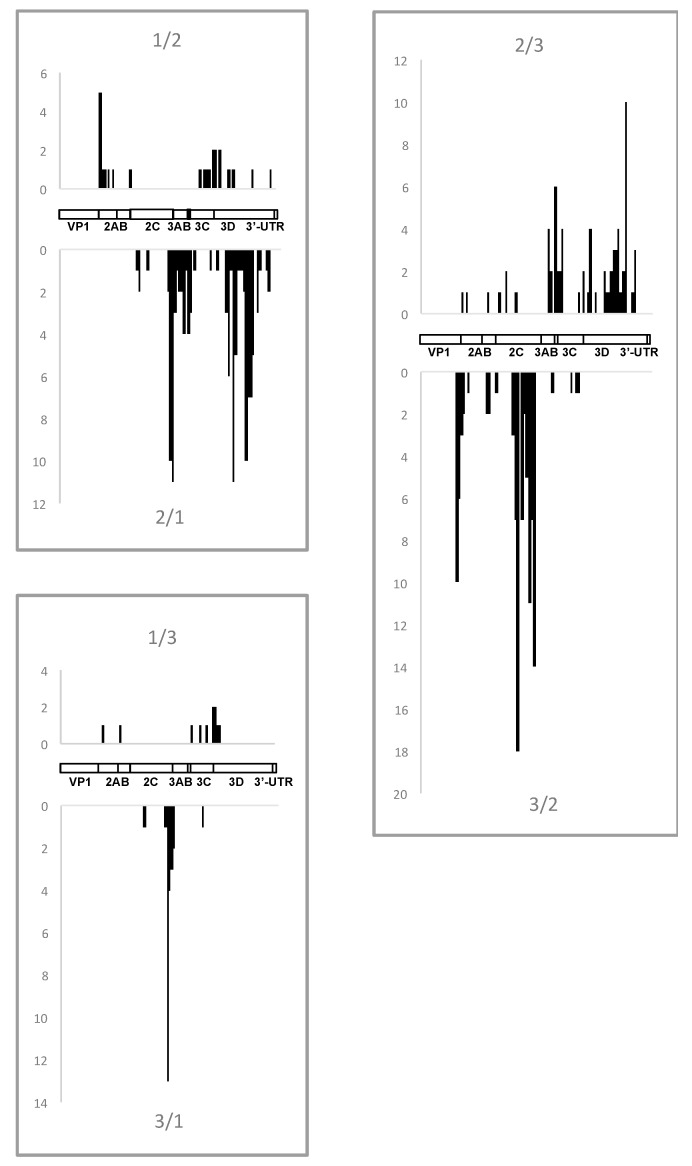
Verification
Claims the paper makes
The claims and statistics of this paper haven’t been checked yet.
Free: it reads the open-access text and checks the first 5 claims that cite a source we can check. Create a free account to check every claim.
Claims other papers make about this one
Each is checked against this paper’s own text: does it say what the citing paper says it does?
The source backs part of the claim, not all of it — or backs it for a different population, condition or comparison.
In the citing paper
“This event is often observed in vivo in vaccinees that receive trivalent OPV (tOPV) (Korotkova et al., 2017, Stern et al., 2017).”
From Engineering the Live-Attenuated Polio Vaccine to Prevent Reversion to Virulence (2020) · cites this paper as Korotkova et al., 2017
Experimental — accuracy not yet measured
Self-check
Percentages, sums and reported differences re-computed from the paper’s own numbers.
The self-check needs the paper’s full text.
Citations
Cites
DNA sequencing with chain-terminating inhibitors
Sanger, F., Nicklen, S., & Coulson, A. R. (1977) · Proceedings of the National Academy of Sciences · doi:10.1073/pnas.74.12.5463 · Cited by 68,572 · cited 1×
“To determine their precise location, the regions suspected to contain crossovers were PCR-amplified by using appropriate primers and sequenced manually [22] or by using ABI Prism 310 genetic analyzer (Applied Biosystems, Carlsbad, CA, USA).”
MethodThompson, J. D., Higgins, D. G., & Gibson, T. J. (1994) · Nucleic Acids Research · doi:10.1093/nar/22.22.4673 · Cited by 64,617
Simon-Loriere, E., & Holmes, E. C. (2011) · Nature Reviews Microbiology · doi:10.1038/nrmicro2614 · Cited by 748
Virus attenuation by genome-scale changes in codon pair bias
Coleman, J. R., Papamichail, D., Skiena, S., Futcher, B., Wimmer, E., & Mueller, S. (2008) · Science · doi:10.1126/science.1155761 · Cited by 715
VACCINE-DERIVED POLIOVIRUSES AND THE ENDGAME STRATEGY FOR GLOBAL POLIO ERADICATION
Kew, O. M., Sutter, R. W., de Gourville, E. M., Dowdle, W. R., & Pallansch, M. A. (2005) · Annual Review of Microbiology · doi:10.1146/annurev.micro.58.030603.123625 · Cited by 703
Kew, O., Morris-Glasgow, V., Landaverde, M., Burns, C., Shaw, J., Garib, Z., André, J., Blackman, E., Freeman, C. J., Jorba, J., et al. (2002) · Science · doi:10.1126/science.1068284 · Cited by 600 · cited 1×
“Thus, for example, such recombinants of type 1, which triggered polio outbreaks in the Dominican Republic and Philippines in 2000–2001, demonstrated a replacement of a significant portion of their P2 region [25,26]; the genomes of type 2 recombinants involved in several outbreaks were deprived of their homotypic 3′-en…”
BackgroundThe mechanism of RNA recombination in poliovirus
Kirkegaard, K., & Baltimore, D. (1986) · Cell · doi:10.1016/0092-8674(86)90600-8 · Cited by 501 · cited 2×
“The widely accepted model of intermolecular recombination between RNA viruses is replicative template switching (”copy-choice”), whereby an incomplete part of the newly-synthesized strand is displaced from the original template and transferred to another one to serve as a primer for the continuation and completion of…”
BackgroundRecombination in viruses: Mechanisms, methods of study, and evolutionary consequences
Pérez-Losada, M., Arenas, M., Galán, J. C., Palero, F., & González-Candelas, F. (2015) · Infection, Genetics and Evolution · doi:10.1016/j.meegid.2014.12.022 · Cited by 450 · cited 1×
“Genetic recombination was demonstrated to occur in practically all viruses investigated in this respect [1], although its frequency in RNA viruses varies markedly, depending on the organization of the replicative machinery [2].”
BackgroundRationalizing the development of live attenuated virus vaccines
Lauring, A. S., Jones, J. O., & Andino, R. (2010) · Nature Biotechnology · doi:10.1038/nbt.1635 · Cited by 328
History of Sabin attenuated poliovirus oral live vaccine strains
Sabin, A. B., & Boulger, L. R. (1973) · Journal of Biological Standardization · doi:10.1016/0092-1157(73)90048-6 · Cited by 319 · cited 1×
“These strains were generated by Albert Sabin by selection from three serotypes of wild-type (wt) polioviruses [3].”
MethodBurns, C. C., Diop, O. M., Sutter, R. W., & Kew, O. M. (2014) · Journal of Infectious Diseases · doi:10.1093/infdis/jiu295 · Cited by 309
Antigenic Structure of Polioviruses of Serotypes 1, 2 and 3
Minor, P. D., Ferguson, M., Evans, D. M. A., Almond, J. W., & Icenogle, J. P. (1986) · Journal of General Virology · doi:10.1099/0022-1317-67-7-1283 · Cited by 305
Engineering attenuated virus vaccines by controlling replication fidelity
Vignuzzi, M., Wendt, E., & Andino, R. (2008) · Nature Medicine · doi:10.1038/nm1726 · Cited by 282 · cited 1×
“To decrease the ability of vaccine strains to recombine it was suggested to introduce certain mutations into the viral RNA-dependent RNA polymerase [46] and to use a common (e.”
BackgroundCirculation of endemic type 2 vaccine-derived poliovirus in Egypt from 1983 to 1993
Yang, C.-F., Naguib, T., Yang, S.-J., Nasr, E., Jorba, J., Ahmed, N., Campagnoli, R., van der Avoort, H., Shimizu, H., Yoneyama, T., et al. (2003) · Journal of Virology · doi:10.1128/jvi.77.15.8366-8377.2003 · Cited by 233
DNA sequencing with chain-terminating inhibitors. 1977.
Sanger, F., Nicklen, S., & Ar, C. (1992) · PubMed · Cited by 190
Balanant, J., Guillot, S., Candrea, A., Delpeyroux, F., & Crainic, R. (1991) · Virology · doi:10.1016/0042-6822(91)90434-d · Cited by 160 · cited 1×
“Approximate positions of the crossover were mapped by using the restriction fragment length polymorphism (RFLP) assay [20,21].”
MethodFurlone, M., Guillot, S., Otelea, D., Balanant, J., Candrea, A., & Crainic, R. (1993) · Virology · doi:10.1006/viro.1993.1468 · Cited by 148
Circulation of type 1 vaccine-derived poliovirus in the philippines in 2001
Shimizu, H., Thorley, B., Paladin, F. J., Brussen, K. A., Stambos, V., Yuen, L., Utama, A., Tano, Y., Arita, M., Yoshida, H., et al. (2004) · Journal of Virology · doi:10.1128/jvi.78.24.13512-13521.2004 · Cited by 146
Pilipenko, E. V., Poperechny, K. V., Maslova, S. V., Melchers, W. J. G., Slot, H. J. B., & Agol, V. I. (1996) · The EMBO Journal · doi:10.1002/j.1460-2075.1996.tb00926.x · Cited by 142 · cited 1×
“The regular absence of the type 2-specific 3′UTR in the investigated recombinants could be due to certain peculiarities of the structure of this replicative cis-element (oriR), which in poliovirus RNA is composed of two hairpins linked to each other by a tertiary (“kissing”) interaction [35].”
BackgroundSelf-citationGavrilin, G. V., Cherkasova, E. A., Lipskaya, G. Y., Kew, O. M., & Agol, V. I. (2000) · Journal of Virology · doi:10.1128/jvi.74.16.7381-7390.2000 · Cited by 138 · cited 1×
“Nevertheless, it may be noted that in addition to the attenuating mutation mentioned above, another Sabin-1-specific mutation (Thr instead of wild type Ser at position 134 of the 2A protein) with the propensity to revert to the wild type residue [33,34] mapped to one of the “weak” regions frequently lost by recombinat…”
BackgroundSelf-citationGenomic Features of Intertypic Recombinant Sabin Poliovirus Strains Excreted by Primary Vaccinees
Cuervo, N. S., Guillot, S., Romanenkova, N., Combiescu, M., Aubert-Combiescu, A., Seghier, M., Caro, V., Crainic, R., & Delpeyroux, F. (2001) · Journal of Virology · doi:10.1128/jvi.75.13.5740-5751.2001 · Cited by 136 · cited 2×
“No effort was made to select particular serotypes; therefore, relative numbers of recombinants of distinct serotypes in this dataset roughly reflects the frequency of their isolation by other authors, with type 2 and 3 recombinants being the most abundant [12,23].”
BackgroundCombelas, N., Holmblat, B., Joffret, M.-L., Colbère-Garapin, F., & Delpeyroux, F. (2011) · Viruses · doi:10.3390/v3081460 · Cited by 135
Romanova, L. I., Blinov, V. M., Tolskaya, E. A., Viktorova, E. G., Kolesnikova, M. S., Guseva, E. A., & Agol, V. I. (1986) · Virology · doi:10.1016/0042-6822(86)90180-7 · Cited by 128 · cited 2×
“The widely accepted model of intermolecular recombination between RNA viruses is replicative template switching (”copy-choice”), whereby an incomplete part of the newly-synthesized strand is displaced from the original template and transferred to another one to serve as a primer for the continuation and completion of…”
BackgroundSelf-citationNonreplicative RNA Recombination in Poliovirus
Gmyl, A. P., Belousov, E. V., Maslova, S. V., Khitrina, E. V., Chetverin, A. B., & Agol, V. I. (1999) · Journal of Virology · doi:10.1128/jvi.73.11.8958-8965.1999 · Cited by 128 · cited 1×
“Another, nonreplicative, mechanism of RNA recombination implies end-to-end joining of independently synthesized RNA fragments without participation of viral RNA-dependent RNA polymerase (RdRP) and does not require any similarity between the partners involved [40,41].”
BackgroundSelf-citationKuge, S., Saito, I., & Nomoto, A. (1986) · Journal of Molecular Biology · doi:10.1016/0022-2836(86)90270-6 · Cited by 111 · cited 1×
“A variant of the replicative RNA recombination was also proposed, which does not require such homology [39].”
BackgroundGeorgescu, M. M., Delpeyroux, F., Tardy-Panit, M., Balanant, J., Combiescu, M., Combiescu, A. A., Guillot, S., & Crainic, R. (1994) · Journal of Virology · doi:10.1128/jvi.68.12.8089-8101.1994 · Cited by 109 · cited 1×
“Approximate positions of the crossover were mapped by using the restriction fragment length polymorphism (RFLP) assay [20,21].”
MethodNonreplicative homologous RNA recombination: Promiscuous joining of RNA pieces?
GMYL, A. P., KORSHENKO, S. A., BELOUSOV, E. V., KHITRINA, E. V., & AGOL, V. I. (2003) · RNA · doi:10.1261/rna.5111803 · Cited by 97 · cited 1×
“Another, nonreplicative, mechanism of RNA recombination implies end-to-end joining of independently synthesized RNA fragments without participation of viral RNA-dependent RNA polymerase (RdRP) and does not require any similarity between the partners involved [40,41].”
BackgroundSelf-citationLipskaya, G. Y., Muzychenko, A. R., Kutitova, O. K., Maslova, S. V., Equestre, M., Drozdov, S. G., Bercoff, R. P., & Agol, V. I. (1991) · Journal of Medical Virology · doi:10.1002/jmv.1890350415 · Cited by 97
Self-citationVaccination against polio should not be stopped
Chumakov, K., Ehrenfeld, E., Wimmer, E., & Agol, V. I. (2007) · Nature Reviews Microbiology · doi:10.1038/nrmicro1769 · Cited by 85 · cited 1×
“Although polio eradication campaign launched by the WHO in 1988 (World Health Assembly, 1988) met with a marked success, with only a handful of poliomyelitis cases caused by wild poliovirus reported globally in 2017 [42], the need for vaccination against the disease will remain for the foreseeable future [43,44].”
BackgroundSelf-citationFidelity Variants and RNA Quasispecies
Bordería, A. V., Rozen-Gagnon, K., & Vignuzzi, M. (2015) · Current topics in microbiology and immunology · doi:10.1007/82_2015_483 · Cited by 79 · cited 1×
“Such low-fitness segments could well arise (and probably indeed are not infrequently arising) upon error-prone RNA replication caused by low fidelity of the RdRP (reviewed in [53,54]) and regular intermolecular recombination [55,56].”
BackgroundSimonyan, V. V., Chumakov, K., Dingerdissen, H., Faison, W. J., Goldweber, S., Golikov, A., Gulzar, N., Karagiannis, K., Lam, P. V. N., Maudru, T., et al. (2016) · Database · doi:10.1093/database/baw022 · Cited by 78 · cited 1×
“Bioinformatic analysis was performed using two in-house software packages: ‘swarm’ program running on MacPro (Apple, Cuppertino, CA, USA) computers in UNIX (Darwin) environment, and cloud-based HIVE (highly-integrated virtual environment) system [17].”
MethodSelf-citationMolecular Mechanisms of Poliovirus Variation and Evolution
Agol, V. I. (2006) · Current Topics in Microbiology and Immunology · doi:10.1007/3-540-26397-7_8 · Cited by 73 · cited 1×
“Such low-fitness segments could well arise (and probably indeed are not infrequently arising) upon error-prone RNA replication caused by low fidelity of the RdRP (reviewed in [53,54]) and regular intermolecular recombination [55,56].”
BackgroundSelf-citationFamulare, M., Chang, S., Iber, J., Zhao, K., Adeniji, J. A., Bukbuk, D., Baba, M., Behrend, M., Burns, C. C., & Oberste, M. S. (2016) · Journal of Virology · doi:10.1128/jvi.01532-15 · Cited by 73
Development of inactivated poliovirus vaccine from Sabin strains: A progress report
Okayasu, H., Sein, C., Hamidi, A., Bakker, W. A. M., & Sutter, R. W. (2016) · Biologicals · doi:10.1016/j.biologicals.2016.08.005 · Cited by 72
Agol, V. I. (2006) · Biologicals · doi:10.1016/j.biologicals.2006.02.007 · Cited by 71
Self-citationIsolation of recombinant type 2 vaccine-derived poliovirus (VDPV) from a Nigerian child
Adu, F., Iber, J. C., Bukbuk, D. N., Gumede, N., Yang, S.-J., Jorba, J. C., Campagnoli, R. P., Sule, W. F., Yang, C.-F., Burns, C. C., et al. (2007) · Virus Research · doi:10.1016/j.virusres.2007.03.009 · Cited by 70 · cited 1×
“Thus, for example, such recombinants of type 1, which triggered polio outbreaks in the Dominican Republic and Philippines in 2000–2001, demonstrated a replacement of a significant portion of their P2 region [25,26]; the genomes of type 2 recombinants involved in several outbreaks were deprived of their homotypic 3′-en…”
BackgroundMolecular Biology of Picornavirus
(2002) · doi:10.1128/9781555817916 · Cited by 70
Mechanisms of genetic variation in polioviruses
Savolainen‐Kopra, C., & Blomqvist, S. (2010) · Reviews in Medical Virology · doi:10.1002/rmv.663 · Cited by 67
A mutation in the RNA polymerase of poliovirus type 1 contributes to attenuation in mice
Tardy-Panit, M., Blondel, B., Martin, A., Tekaia, F., Horaud, F., & Delpeyroux, F. (1993) · Journal of Virology · doi:10.1128/jvi.67.8.4630-4638.1993 · Cited by 64 · cited 1×
“Moreover only a single known Sabin 1-specific attenuating mutation (position 6203 in the 3D-encoding gene [30,31] mapped to a “weak” region.”
BackgroundTripartite genome organization of a natural type 2 vaccine/nonvaccine recombinant poliovirus
Georgescu, M.-M., Delpeyroux, F., & Crainic, R. (1995) · Journal of General Virology · doi:10.1099/0022-1317-76-9-2343 · Cited by 64 · cited 1×
“Moreover only a single known Sabin 1-specific attenuating mutation (position 6203 in the 3D-encoding gene [30,31] mapped to a “weak” region.”
BackgroundVirus population dynamics during infection
Poirier, E. Z., & Vignuzzi, M. (2017) · Current Opinion in Virology · doi:10.1016/j.coviro.2017.03.013 · Cited by 64
Fox, H., Knowlson, S., Minor, P. D., & Macadam, A. J. (2017) · PLOS Pathogens · doi:10.1371/journal.ppat.1006117 · Cited by 60
Molecular Epidemiology of Polioviruses
Kew, O. M., & Nottay, B. K. (1984) · Clinical Infectious Diseases · doi:10.1093/clinids/6.supplement_2.s499 · Cited by 51
Joffret, M.-L., Jégouic, S., Bessaud, M., Balanant, J., Tran, C., Caro, V., Holmblat, B., Razafindratsimandresy, R., Reynes, J.-M., Rakoto-Andrianarivelo, M., et al. (2012) · The Journal of Infectious Diseases · doi:10.1093/infdis/jis204 · Cited by 44 · cited 1×
“Thus, for example, such recombinants of type 1, which triggered polio outbreaks in the Dominican Republic and Philippines in 2000–2001, demonstrated a replacement of a significant portion of their P2 region [25,26]; the genomes of type 2 recombinants involved in several outbreaks were deprived of their homotypic 3′-en…”
BackgroundOdoom, J. K., Yunus, Z., Dunn, G., Minor, P. D., & Martín, J. (2008) · Journal of Virology · doi:10.1128/jvi.00468-08 · Cited by 43 · cited 1×
“Nevertheless, it may be noted that in addition to the attenuating mutation mentioned above, another Sabin-1-specific mutation (Thr instead of wild type Ser at position 134 of the 2A protein) with the propensity to revert to the wild type residue [33,34] mapped to one of the “weak” regions frequently lost by recombinat…”
BackgroundMutations in Sabin 2 Strain of Poliovirus and Stability of Attenuation Phenotype
Rezapkin, G. V., Fan, L., Asher, D. M., Fibi, M. R., Dragunsky, E. M., & Chumakov, K. M. (1999) · Virology · doi:10.1006/viro.1999.9718 · Cited by 40 · cited 1×
“a 2493-U is present in some vaccines [32], therefore this mutation does not necessarily represent reversion during several virus transmission.”
BackgroundSelf-citationfor the POG group, Yaari, R., Kaliner, E., Grotto, I., Katriel, G., Moran‐Gilad, J., Sofer, D., Mendelson, E., Miller, E., Huppert, A., et al. (2016) · BMC Medicine · doi:10.1186/s12916-016-0637-z · Cited by 36 · cited 1×
“OPV strains can evolve into more pathogenic variants and inflict paralytic disease [6–8,14], while IPV does not induce robust intestinal immunity and is unable to interrupt viral transmission [45].”
BackgroundPoliovirus vaccination during the endgame: insights from integrated modeling
Tebbens, R. J. D., & Thompson, K. M. (2017) · Expert Review of Vaccines · doi:10.1080/14760584.2017.1322514 · Cited by 36 · cited 1×
“Although polio eradication campaign launched by the WHO in 1988 (World Health Assembly, 1988) met with a marked success, with only a handful of poliomyelitis cases caused by wild poliovirus reported globally in 2017 [42], the need for vaccination against the disease will remain for the foreseeable future [43,44].”
BackgroundKnowlson, S., Burlison, J., Giles, E., Fox, H., Macadam, A. J., & Minor, P. D. (2015) · PLOS Pathogens · doi:10.1371/journal.ppat.1005316 · Cited by 35 · cited 1×
“, Sabin-3-derived) sequence downstream from the capsid region as a backbone for all serotypes [49].”
BackgroundPoliovirus Vaccines: Molecular Biology and Immune Response
Minor, P. D., & Almond, J. (2014) · Molecular Biology of Picornavirus · doi:10.1128/9781555817916.ch30 · Cited by 33 · cited 1×
“Upon their derivation, they had accumulated various serotype-specific mutations, including those that were shown to be neurovirulence-attenuating [4].”
BackgroundFidelity of Nucleotide Incorporation by the RNA-Dependent RNA Polymerase from Poliovirus
Cameron, C. E., Moustafa, I. M., & Arnold, J. J. (2016) · The Enzymes · doi:10.1016/bs.enz.2016.02.002 · Cited by 28 · cited 1×
“Such low-fitness segments could well arise (and probably indeed are not infrequently arising) upon error-prone RNA replication caused by low fidelity of the RdRP (reviewed in [53,54]) and regular intermolecular recombination [55,56].”
BackgroundComparison of poliovirus recombinants: accumulation of point mutations provides further advantages
Savolainen‐Kopra, C., Samoilovich, E., Kahelin, H., Hiekka, A., Hovi, T., & Roivainen, M. (2009) · Journal of General Virology · doi:10.1099/vir.0.010942-0 · Cited by 23 · cited 1×
“[52] have demonstrated that a Sabin-2/Sabin-1 recombinant outcompeted its serotype-2 parent in tissue culture experiments, but whether such preference is a general rule is unknown.”
Background(2004) · doi:10.1128/isbn978-1-55581-603-2 · Cited by 20
Picornaviruses as a Model for Studying the Nature of RNA Recombination
Agol, V. I. (2014) · ASM Press eBooks · doi:10.1128/9781555816698.ch15 · Cited by 9
Self-citationfor the POG group, Yaari, R., Kaliner, E., Grotto, I., Katriel, G., Moran‐Gilad, J., Sofer, D., Mendelson, E., Miller, E., & Huppert, A. (2016) · BMC Medicine · doi:10.1186/s12916-016-0666-7 · Cited by 7
Cited by
Independent infections of porcine deltacoronavirus among Haitian children
Lednicky, J. A., Tagliamonte, M. S., White, S. K., Elbadry, M. A., Alam, M. M., Stephenson, C. J., Bonny, T. S., Loeb, J. C., Telisma, T., Chavannes, S., et al. (2021) · Nature · doi:10.1038/s41586-021-04111-z · Cited by 487
Engineering the Live-Attenuated Polio Vaccine to Prevent Reversion to Virulence
Yeh, M. T., Bujaki, E., Dolan, P. T., Smith, M., Wahid, R., Konz, J., Weiner, A. J., Bandyopadhyay, A. S., Van Damme, P., De Coster, I., et al. (2020) · Cell Host & Microbe · doi:10.1016/j.chom.2020.04.003 · Cited by 221
Recombination in Enteroviruses, a Multi-Step Modular Evolutionary Process
Muslin, C., Kain, A. M., Bessaud, M., Blondel, B., & Delpeyroux, F. (2019) · Viruses · doi:10.3390/v11090859 · Cited by 142
“By contrast, multiple studies provided evidence of the occurrence of extensive series of recombination events throughout the entire non-structural region, which seemed to be relatively randomly distributed and resulted in complex mosaics of sequences [86, 104, [108] [109] [110] [111] 117] .”
BackgroundResultNikolaidis, M., Mimouli, K., Kyriakopoulou, Z., Tsimpidis, M., Tsakogiannis, D., Markoulatos, P., & Amoutzias, G. D. (2018) · Virology · doi:10.1016/j.virol.2018.10.006 · Cited by 67
Abrantes, J., Droillard, C., Lopes, A. M., Lemaitre, E., Lucas, P., Blanchard, Y., Marchandeau, S., Esteves, P. J., & Gall-Reculé, G. L. (2020) · Scientific Reports · doi:10.1038/s41598-020-71303-4 · Cited by 62
Metadata
- Authors
- Korotkova, E., Laassri, M., Zagorodnyaya, T., Petrovskaya, S., Rodionova, E., Cherkasova, E., Gmyl, A., Ivanova, O., Eremeeva, T., Lipskaya, G., Agol, V., & Chumakov, K.
- Affiliations
- Russian Academy of Sciences (RU)
- United States Food and Drug Administration (US)
- National Institutes of Health (US)
- Lomonosov Moscow State University (RU)
- Corresponding author
- Agol, Vadim
- Chumakov, Konstantin
- ORCID
- Venue
- Viruses
- Publisher
- MDPI AG
- Published
- 2017-11-22
- Volume
- 9
- Issue
- 11
- Pages
- 353
- ISSN
- 1999-4915 (ISSN-L)
- PMC
- PMC5707560
- OpenAlex
- W2769154666
- Cited by
- 23
- References
- 56
- Citations by year
- 2025: 2 · 2023: 3 · 2022: 2 · 2021: 2 · 2020: 6 · 2019: 4 · 2018: 3
- FWCI
- 2.35
- Type
- journal article
- Language
- en
- Open access
- gold
- doi.org
- Licence
- Locations
- Viruses (publishedVersion, cc-by)
- Europe PMC (PubMed Central) (publishedVersion, cc-by)
- PubMed Central (publishedVersion, cc-by)
- PubMed (publishedVersion)
- DOAJ (DOAJ: Directory of Open Access Journals) (submittedVersion, cc-by-sa)
- Topics
- Life Sciences › Biochemistry, Genetics and Molecular Biology › Genetics › Evolution and Genetic Dynamics
- Health Sciences › Medicine › Infectious Diseases › Viral Infections and Immunology Research
- Health Sciences › Medicine › Epidemiology › Virology and Viral Diseases
- Keywords
- intertypic recombination, crossover sites, genome segments, poliovirus evolution, RNA viruses
- MeSH terms
- Enterovirus Infections, Humans, Mutation, Poliomyelitis, Poliovirus Vaccine, Oral, Recombination, Genetic, Virulence, Genome, Viral, Poliovirus, Evolution, Molecular, Drug-Related Side Effects and Adverse Reactions
About these checks
Registry, retraction, Cites and statistics results are computed, not judged, with one exception: a printed reference that no index lists is read once by a model before it counts as a citation error. Claims are extracted by a model and kept only when their quote appears verbatim in the text; each cited source is then checked, with a model’s help, for whether it says what the claim relies on. Those verdicts can be wrong — read the claim’s quote and the cited source before relying on one.
Statistics and arithmetic are recomputed, not judged.
Confidence bands are shown only for fields calibrated on our annotated test set. None is calibrated yet, so no band is shown.
What counts as a claim ›How we measure confidence ›How we check this ›
Are you an author, or do you see a problem with this page? Request a review
Data sources
Bibliographic data: Semantic Scholar, OpenAlex, Crossref.
Contains information from the Semantic Scholar Academic Graph Datasets, made available under the ODC Attribution License (ODC-BY 1.0).
Semantic Scholar’s data is described in: Kinney, R., et al. (2023). The Semantic Scholar Open Data Platform. arXiv:2301.10140.
