Cited by 165Ubiquitin and proteasome pathwaysEnzyme Structure and FunctionProtein Degradation and Inhibitors

The DOI matches its Crossref record; 60 of the 60 references it cites were found in a registry or an index.

Mechanism of ubiquitin ligation and lysine prioritization by a HECT E3

Open access

Abstract

Ubiquitination by HECT E3 enzymes regulates myriad processes, including tumor suppression, transcription, protein trafficking, and degradation. HECT E3s use a two-step mechanism to ligate ubiquitin to target proteins. The first step is guided by interactions between the catalytic HECT domain and the E2∼ubiquitin intermediate, which promote formation of a transient, thioester-bonded HECT∼ubiquitin intermediate. Here we report that the second step of ligation is mediated by a distinct catalytic architecture established by both the HECT E3 and its covalently linked ubiquitin. The structure of a chemically trapped proxy for an E3∼ubiquitin-substrate intermediate reveals three-way interactions between ubiquitin and the bilobal HECT domain orienting the E3∼ubiquitin thioester bond for ligation, and restricting the location of the substrate-binding domain to prioritize target lysines for ubiquitination. The data allow visualization of an E2-to-E3-to-substrate ubiquitin transfer cascade, and show how HECT-specific ubiquitin interactions driving multiple reactions are repurposed by a major E3 conformational change to promote ligation.

Overview

The claims and statistics of this paper haven’t been checked yet.

Run the check — free, no account needed. It reads the open-access text and checks the sources it cites.

A few free checks a day · papers already verified open instantly · results are public

Integrity signals

Registry

Crossref · 10.7554/elife.00828

Cites

60 of 60 references verified0 citation errors · 0 not checkable

Statistics

Figures
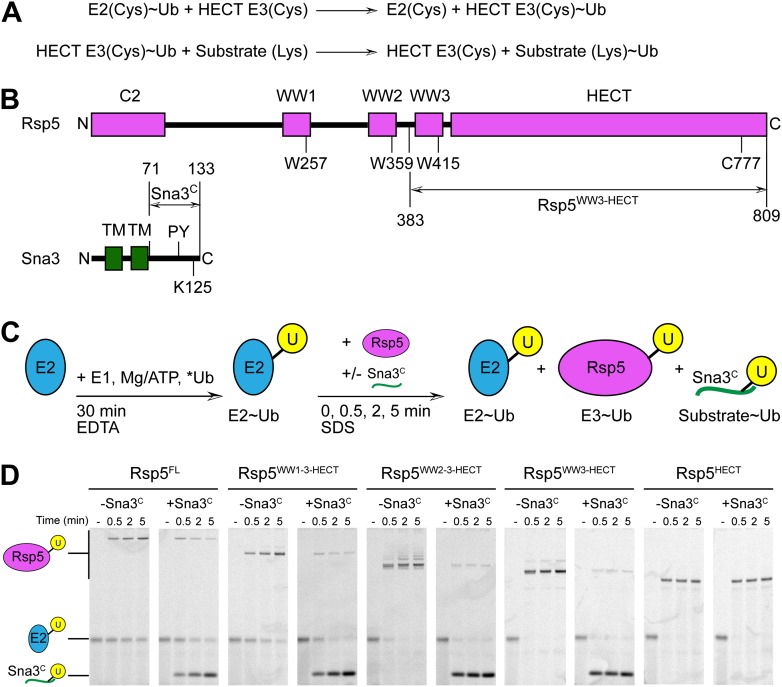
Figure 1. Rsp5WW3-HECT-Sna3C as a minimal model HECT E3-substrate system to study Ub ligation. (A) Schematic view of two-step HECT E3 ubiquitination mechanism. First, Ub is transferred from an E2∼Ub intermediate to the HECT E3 catalytic cysteine (Cys) to form a labile, thioester-linked E3∼Ub intermediate. Second, Ub is transferred from the E3 Cys to a substrate’s primary amino group, which is typically from a lysine side-chain. Ub can also be a substrate for the second reaction during polyubiquitination. (B) Schematic views of Rsp5 and Sna3 sequences. (C) Schematic description of pulse-chase assay. A thioester-bonded E2∼Ub intermediate was enzymatically generated by mixing E1, the E2 UbcH5B, and a fluorescently labeled version of Ub for 30 min. This ‘pulse’ reaction was quenched by addition of EDTA. In the ‘chase’, wild-type or deletion mutant versions of Rsp5 were added alongside a synthetic peptide corresponding to Sna3C. Formation of the Rsp5∼Ub intermediate and the Sna3C∼Ub product were monitored at the indicated time-points. (D) Imaging of nonreducing SDS-PAGE gels monitoring pulse-chase fluorescent Ub transfer from E2 to Rsp5 to substrate for the indicated versions of Rsp5, in the absence or presence of Sna3C. Rsp5WW3-HECT is the minimal version mediating Ub ligation to Sna3C. DOI: http://dx.doi.org/10.7554/eLife.00828.003
Figure 1. Rsp5WW3-HECT-Sna3C as a minimal model HECT E3-substrate system to study Ub ligation. (A) Schematic view of two-step HECT E3 ubiquitination mechanism. First, Ub is transferred from an E2∼Ub intermediate to the HECT E3 catalytic cysteine (Cys) to form a labile, thioester-linked E3∼Ub intermediate. Second, Ub is transferred from the E3 Cys to a substrate’s primary amino group, which is typically from a lysine side-chain. Ub can also be a substrate for the second reaction during polyubiquitination. (B) Schematic views of Rsp5 and Sna3 sequences. (C) Schematic description of pulse-chase assay. A thioester-bonded E2∼Ub intermediate was enzymatically generated by mixing E1, the E2 UbcH5B, and a fluorescently labeled version of Ub for 30 min. This ‘pulse’ reaction was quenched by addition of EDTA. In the ‘chase’, wild-type or deletion mutant versions of Rsp5 were added alongside a synthetic peptide corresponding to Sna3C. Formation of the Rsp5∼Ub intermediate and the Sna3C∼Ub product were monitored at the indicated time-points. (D) Imaging of nonreducing SDS-PAGE gels monitoring pulse-chase fluorescent Ub transfer from E2 to Rsp5 to substrate for the indicated versions of Rsp5, in the absence or presence of Sna3C. Rsp5WW3-HECT is the minimal version mediating Ub ligation to Sna3C. DOI: http://dx.doi.org/10.7554/eLife.00828.003CC BY · PubMed Central
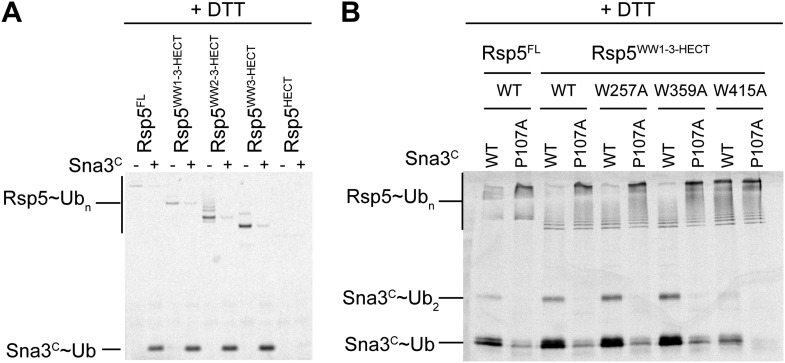
Figure 1—figure supplement 1. Mutational data defining Rsp5WW3-HECT as a minimal E3 mediating Ub ligation to Sna3C and autoubiquitination. (A) DTT-treated controls of the end points of reactions shown in Figure 1B. (B) Fluorescent imaging of reducing SDS-PAGE gels monitoring multiple turnover fluorescent Ub ligation by full-length Rsp5 (Rsp5FL), or a construct containing all three WW domains plus the HECT domain (Rsp5WW1-3-HECT), in the presence of wild-type or a P107A PPXY motif mutant version of Sna3C. DOI: http://dx.doi.org/10.7554/eLife.00828.004
Figure 1—figure supplement 1. Mutational data defining Rsp5WW3-HECT as a minimal E3 mediating Ub ligation to Sna3C and autoubiquitination. (A) DTT-treated controls of the end points of reactions shown in Figure 1B. (B) Fluorescent imaging of reducing SDS-PAGE gels monitoring multiple turnover fluorescent Ub ligation by full-length Rsp5 (Rsp5FL), or a construct containing all three WW domains plus the HECT domain (Rsp5WW1-3-HECT), in the presence of wild-type or a P107A PPXY motif mutant version of Sna3C. DOI: http://dx.doi.org/10.7554/eLife.00828.004CC BY · PubMed Central
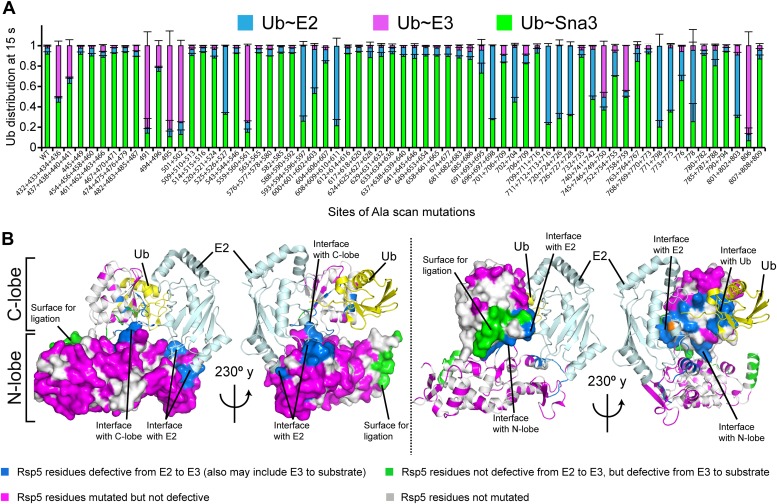
Figure 2. Alanine scanning mutagenesis suggests distinct specific HECT domain architectures to receive and ligate ubiquitin. (A) Summary of effects of indicated HECT domain Ala mutations on pulse-chase fluorescent Ub transfer from E2 to Rsp5WW3-HECT and then from Rsp5WW3-HECT to Sna3C. The assay scheme is shown in Figure 1C, except a 15 s chase was used. Cyan bars—accumulation of thioester-linked E2∼Ub intermediate, reflecting a defect in Ub transfer from E2 to E3. Purple bars—accumulation of thioester-linked E3∼Ub intermediate, reflecting a defect in Ub transfer from E3 to substrate. Green bars—ratio of Sna3C∼Ub product formed. Standard deviations are calculated from three independent replications. (B) Locations of mutations hindering E2-to-Rsp5WW3-HECT (blue) or Rsp5WW3-HECT-to-substrate (green) Ub transfer mapped on prior E2∼Ub-HECT domain structure (Kamadurai et al., 2009). Magenta surfaces represent residues mutated and found not essential for activity. DOI: http://dx.doi.org/10.7554/eLife.00828.005
Figure 2. Alanine scanning mutagenesis suggests distinct specific HECT domain architectures to receive and ligate ubiquitin. (A) Summary of effects of indicated HECT domain Ala mutations on pulse-chase fluorescent Ub transfer from E2 to Rsp5WW3-HECT and then from Rsp5WW3-HECT to Sna3C. The assay scheme is shown in Figure 1C, except a 15 s chase was used. Cyan bars—accumulation of thioester-linked E2∼Ub intermediate, reflecting a defect in Ub transfer from E2 to E3. Purple bars—accumulation of thioester-linked E3∼Ub intermediate, reflecting a defect in Ub transfer from E3 to substrate. Green bars—ratio of Sna3C∼Ub product formed. Standard deviations are calculated from three independent replications. (B) Locations of mutations hindering E2-to-Rsp5WW3-HECT (blue) or Rsp5WW3-HECT-to-substrate (green) Ub transfer mapped on prior E2∼Ub-HECT domain structure (Kamadurai et al., 2009). Magenta surfaces represent residues mutated and found not essential for activity. DOI: http://dx.doi.org/10.7554/eLife.00828.005CC BY · PubMed Central
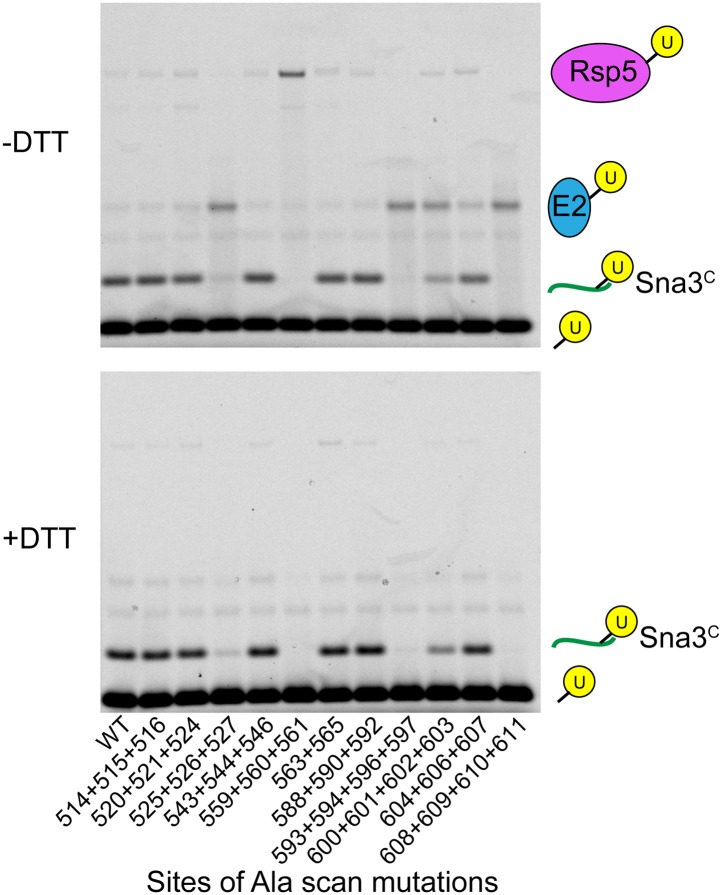
Figure 2—figure supplement 1. Representative raw data from Ala scan. Fluorescent imaging of representative nonreducing (top) and reducing (bottom) gels from assays used for data in Figure 2A, monitoring pulse-chase fluorescent Ub transfer from E2 to the indicated versions of Rsp5WW3-HECT to Sna3C. The chase was 15 s. DOI: http://dx.doi.org/10.7554/eLife.00828.006
Figure 2—figure supplement 1. Representative raw data from Ala scan. Fluorescent imaging of representative nonreducing (top) and reducing (bottom) gels from assays used for data in Figure 2A, monitoring pulse-chase fluorescent Ub transfer from E2 to the indicated versions of Rsp5WW3-HECT to Sna3C. The chase was 15 s. DOI: http://dx.doi.org/10.7554/eLife.00828.006CC BY · PubMed Central
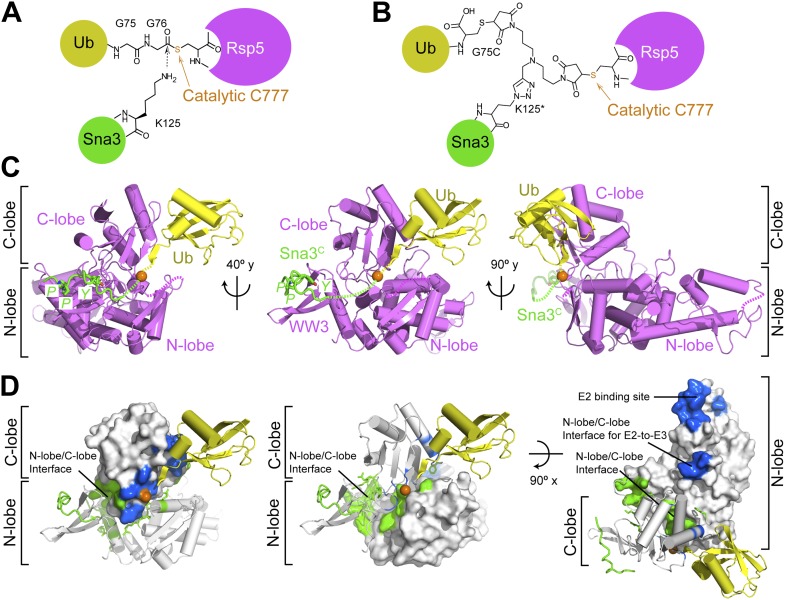
Figure 3. Structure of a trapped proxy for an Rsp5∼Ub-Sna3C intermediate. (A) Chemical representation of substrate lysine attack of an Rsp5∼Ub thioester bond. (B) Chemical representation of the trapped proxy, depicting covalent bonds linking Rsp5 Cys777, a Ub Cys75 (in place of Gly75-Gly76) and Sna3C Cys125 (in place of Lys125) in Rsp5WW3-HECTxUbxSna3C complex. (C) Three views of Rsp5WW3-HECT (violet) xUb (yellow) xSna3C (green), with catalytic Cys shown as orange sphere. Regions not observed in electron density are indicated with dashed lines. (D) Locations of Ala scan mutations hindering E2-to-Rsp5WW3-HECT (blue) or Rsp5WW3-HECT-to-substrate (green) Ub transfer mapped on Rsp5WW3-HECTxUbxSna3C structure. DOI: http://dx.doi.org/10.7554/eLife.00828.007
Figure 3. Structure of a trapped proxy for an Rsp5∼Ub-Sna3C intermediate. (A) Chemical representation of substrate lysine attack of an Rsp5∼Ub thioester bond. (B) Chemical representation of the trapped proxy, depicting covalent bonds linking Rsp5 Cys777, a Ub Cys75 (in place of Gly75-Gly76) and Sna3C Cys125 (in place of Lys125) in Rsp5WW3-HECTxUbxSna3C complex. (C) Three views of Rsp5WW3-HECT (violet) xUb (yellow) xSna3C (green), with catalytic Cys shown as orange sphere. Regions not observed in electron density are indicated with dashed lines. (D) Locations of Ala scan mutations hindering E2-to-Rsp5WW3-HECT (blue) or Rsp5WW3-HECT-to-substrate (green) Ub transfer mapped on Rsp5WW3-HECTxUbxSna3C structure. DOI: http://dx.doi.org/10.7554/eLife.00828.007CC BY · PubMed Central
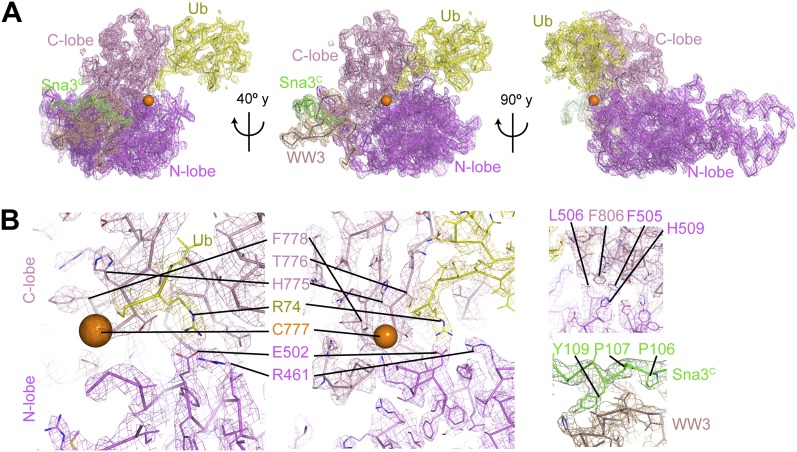
Figure 3—figure supplement 1. Electron density for Rsp5WW3-HECTxUbxSna3C structure. (A) Final 2Fo−Fc electron density and Rsp5WW3-HECTxUbxSna3C crystal structure, colored by domain: WW3 domain—beige, N-lobe—violet, C-lobe—pink, Ub—yellow, Sna3C—green. The maps are displayed at 1σ contour level, the structures as Cα traces for one copy in the asymmetric unit. Overall, the complex is supported by good electron density, except for the crosslinker, associated C-terminal portion of Sna3C, and the N-lobe catalytic loop, which are not visible or too patchy for building. (B) Close-up views highlighting active site region, N-lobe (violet)/C-lobe (pink)/Ub (yellow) interfaces, and PPXY motif (green) from Sna3C (beige) bound to Rsp5′s WW3 domain. DOI: http://dx.doi.org/10.7554/eLife.00828.008
Figure 3—figure supplement 1. Electron density for Rsp5WW3-HECTxUbxSna3C structure. (A) Final 2Fo−Fc electron density and Rsp5WW3-HECTxUbxSna3C crystal structure, colored by domain: WW3 domain—beige, N-lobe—violet, C-lobe—pink, Ub—yellow, Sna3C—green. The maps are displayed at 1σ contour level, the structures as Cα traces for one copy in the asymmetric unit. Overall, the complex is supported by good electron density, except for the crosslinker, associated C-terminal portion of Sna3C, and the N-lobe catalytic loop, which are not visible or too patchy for building. (B) Close-up views highlighting active site region, N-lobe (violet)/C-lobe (pink)/Ub (yellow) interfaces, and PPXY motif (green) from Sna3C (beige) bound to Rsp5′s WW3 domain. DOI: http://dx.doi.org/10.7554/eLife.00828.008CC BY · PubMed Central
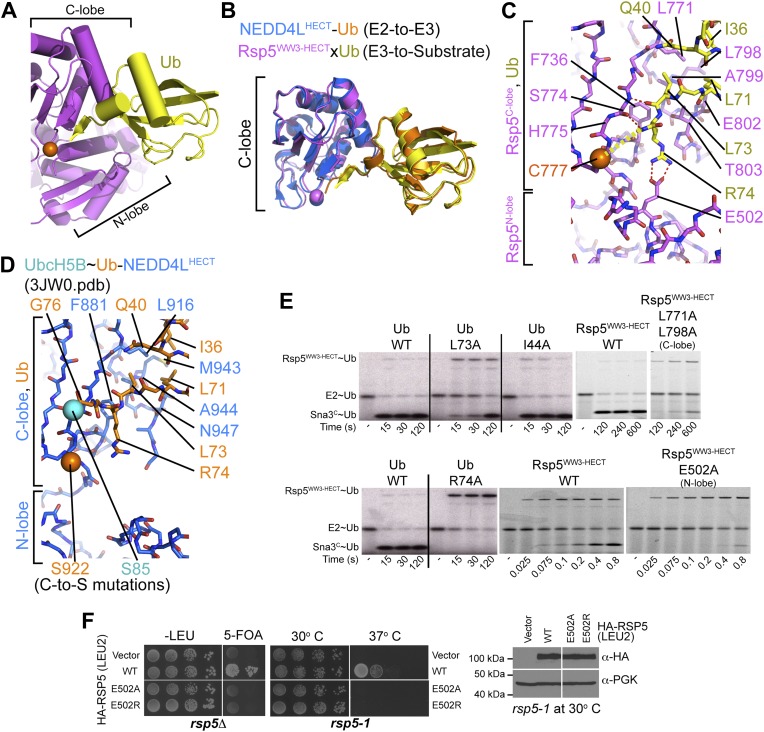
Figure 4. HECT domain–Ub interactions for ligation. (A) Ub’s C-terminal tail and its covalent linkage to the Rsp5 catalytic Cys are shown sandwiched between the Rsp5 N- and C-lobes in the crystal structure of Rsp5WW3-HECT (violet) xUb (yellow) xSna3C (not shown). (B) C-lobe-Ub portions superimposed for Rsp5WW3-HECT (violet) xUb (yellow) xSna3C (not shown) and E2 (not shown)∼Ub (orange)-NEDD4LHECT (blue) (Kamadurai et al., 2009). (C) Close-up view of interactions between Rsp5 C-lobe and the C-terminal tail of covalently linked Ub in the crystal structure of Rsp5WW3-HECT (violet) xUb (yellow) xSna3C (not shown). (D) Close-up view of interactions between NEDD4L C-lobe and the C-terminal tail of the E2-linked Ub in the crystal structure of E2 (only the Cys-to-Ser mutation at the active site is shown) ∼Ub (orange)-NEDD4LHECT (blue) (Kamadurai et al., 2009). (E) Nonreducing gels from pulse-chase E2-to-Rsp5-to-Sna3C Ub transfer assay, using indicated versions of Rsp5WW3-HECT and of fluorescent or radioactive Ub. Bands corresponding to thioester-linked E2∼Ub and Rsp5WW3-HECT∼Ub intermediates and isopeptide-bonded Sna3C∼Ub product are indicated. (F) Yeast complementation assays for the indicated HA-Rsp5 mutants. DOI: http://dx.doi.org/10.7554/eLife.00828.009
Figure 4. HECT domain–Ub interactions for ligation. (A) Ub’s C-terminal tail and its covalent linkage to the Rsp5 catalytic Cys are shown sandwiched between the Rsp5 N- and C-lobes in the crystal structure of Rsp5WW3-HECT (violet) xUb (yellow) xSna3C (not shown). (B) C-lobe-Ub portions superimposed for Rsp5WW3-HECT (violet) xUb (yellow) xSna3C (not shown) and E2 (not shown)∼Ub (orange)-NEDD4LHECT (blue) (Kamadurai et al., 2009). (C) Close-up view of interactions between Rsp5 C-lobe and the C-terminal tail of covalently linked Ub in the crystal structure of Rsp5WW3-HECT (violet) xUb (yellow) xSna3C (not shown). (D) Close-up view of interactions between NEDD4L C-lobe and the C-terminal tail of the E2-linked Ub in the crystal structure of E2 (only the Cys-to-Ser mutation at the active site is shown) ∼Ub (orange)-NEDD4LHECT (blue) (Kamadurai et al., 2009). (E) Nonreducing gels from pulse-chase E2-to-Rsp5-to-Sna3C Ub transfer assay, using indicated versions of Rsp5WW3-HECT and of fluorescent or radioactive Ub. Bands corresponding to thioester-linked E2∼Ub and Rsp5WW3-HECT∼Ub intermediates and isopeptide-bonded Sna3C∼Ub product are indicated. (F) Yeast complementation assays for the indicated HA-Rsp5 mutants. DOI: http://dx.doi.org/10.7554/eLife.00828.009CC BY · PubMed Central
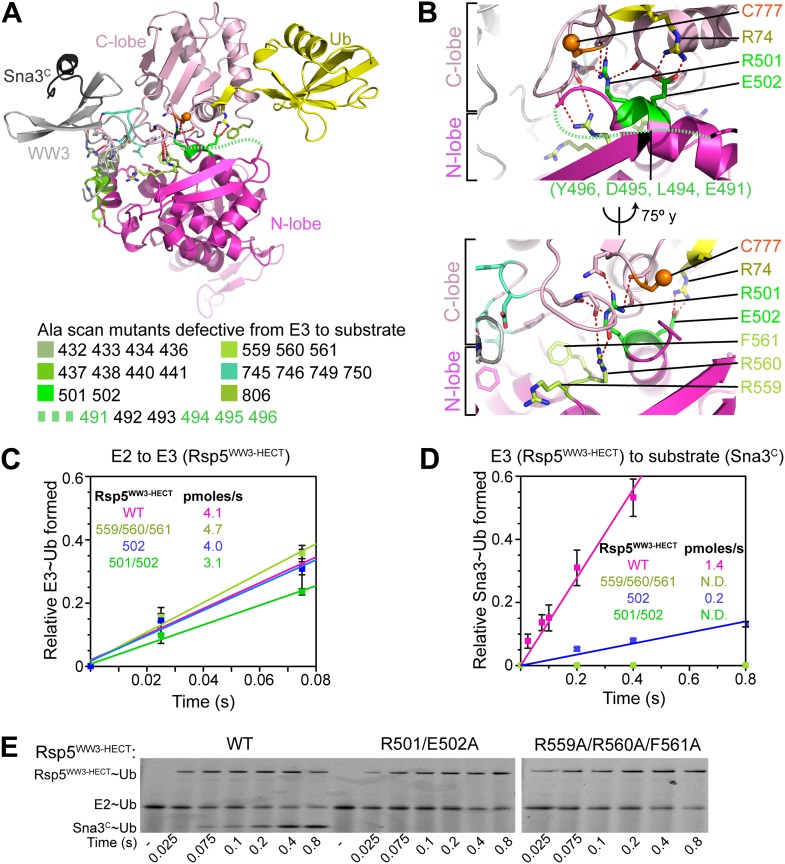
Figure 5. Ala mutations selectively impaired for ligation map to N-lobe/C-lobe interface in Rsp5WW3-HECTxUbxSna3C crystal structure. (A) Rsp5WW3-HECTxUbxSna3C crystal structure highlighting locations of Ala mutants (sticks, colored by mutant as indicated) selectively impaired for ligation. Dotted line indicates approximate locations of mutations in the N-lobe not visible in electron density. (B) Close-up views highlighting N-lobe/C-lobe interface locations of Ala mutants selectively impaired for ligation. Dotted line indicates approximate locations of mutations in the N-lobe not visible in electron density. (C) Initial rates of fluorescent Ub transfer from E2 to the indicated versions of Rsp5WW3-HECT measured in rapid quench-flow pulse-chase assays. (D) Initial rates of fluorescent Ub transfer from the indicated versions of Rsp5WW3-HECT to Sna3C measured in rapid quench-flow pulse-chase assays. (E) Fluorescent images of nonreducing SDS-PAGE gels showing rapid-quench flow pulse-chase fluorescent Ub transfer from E2 to Rsp5WW3-HECT to Sna3C, for the indicated versions of Rsp5WW3-HECT. Bands corresponding to thioester-linked E2∼Ub and Rsp5WW3-HECT∼Ub intermediates and isopeptide-bonded Sna3C∼Ub product are indicated. DOI: http://dx.doi.org/10.7554/eLife.00828.010
Figure 5. Ala mutations selectively impaired for ligation map to N-lobe/C-lobe interface in Rsp5WW3-HECTxUbxSna3C crystal structure. (A) Rsp5WW3-HECTxUbxSna3C crystal structure highlighting locations of Ala mutants (sticks, colored by mutant as indicated) selectively impaired for ligation. Dotted line indicates approximate locations of mutations in the N-lobe not visible in electron density. (B) Close-up views highlighting N-lobe/C-lobe interface locations of Ala mutants selectively impaired for ligation. Dotted line indicates approximate locations of mutations in the N-lobe not visible in electron density. (C) Initial rates of fluorescent Ub transfer from E2 to the indicated versions of Rsp5WW3-HECT measured in rapid quench-flow pulse-chase assays. (D) Initial rates of fluorescent Ub transfer from the indicated versions of Rsp5WW3-HECT to Sna3C measured in rapid quench-flow pulse-chase assays. (E) Fluorescent images of nonreducing SDS-PAGE gels showing rapid-quench flow pulse-chase fluorescent Ub transfer from E2 to Rsp5WW3-HECT to Sna3C, for the indicated versions of Rsp5WW3-HECT. Bands corresponding to thioester-linked E2∼Ub and Rsp5WW3-HECT∼Ub intermediates and isopeptide-bonded Sna3C∼Ub product are indicated. DOI: http://dx.doi.org/10.7554/eLife.00828.010CC BY · PubMed Central
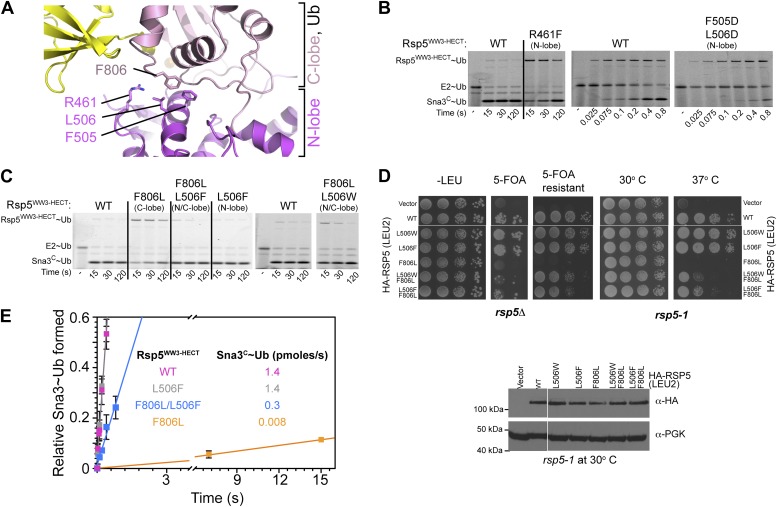
Figure 6. HECT domain C-lobe/N-lobe interactions anchoring architecture for ligation. (A) Close-up view of a portion of the C-lobe/N-lobe interface in Rsp5WW3-HECTxUbxSna3C structure. (B,C) Nonreducing gels from pulse-chase transfer assay of fluorescent Ub from E2-to-Rsp5-to-Sna3C using indicated mutants of Rsp5. Bands corresponding to thioester-linked E2∼Ub and Rsp5WW3-HECT∼Ub intermediates and isopeptide-bonded Sna3C∼Ub product are indicated. (D) Left: HA-tagged WT and mutant rsp5 alleles housed on low copy plasmids were assessed for their ability to complement the essential function of RSP5 in either serially diluted rsp5-1 temperature-sensitive cells grown at restrictive 37°C or in rsp5Δ null cells after eviction of wild-type RSP5 plasmid on 5-FOA. Below: whole cell lysates of rsp5-1 transformants immunoblotted for HA and PGK. (E) Rates of pulse-chase fluorescent Ub ligation from the indicated versions of Rsp5WW3-HECT to Sna3C. DOI: http://dx.doi.org/10.7554/eLife.00828.011
Figure 6. HECT domain C-lobe/N-lobe interactions anchoring architecture for ligation. (A) Close-up view of a portion of the C-lobe/N-lobe interface in Rsp5WW3-HECTxUbxSna3C structure. (B,C) Nonreducing gels from pulse-chase transfer assay of fluorescent Ub from E2-to-Rsp5-to-Sna3C using indicated mutants of Rsp5. Bands corresponding to thioester-linked E2∼Ub and Rsp5WW3-HECT∼Ub intermediates and isopeptide-bonded Sna3C∼Ub product are indicated. (D) Left: HA-tagged WT and mutant rsp5 alleles housed on low copy plasmids were assessed for their ability to complement the essential function of RSP5 in either serially diluted rsp5-1 temperature-sensitive cells grown at restrictive 37°C or in rsp5Δ null cells after eviction of wild-type RSP5 plasmid on 5-FOA. Below: whole cell lysates of rsp5-1 transformants immunoblotted for HA and PGK. (E) Rates of pulse-chase fluorescent Ub ligation from the indicated versions of Rsp5WW3-HECT to Sna3C. DOI: http://dx.doi.org/10.7554/eLife.00828.011CC BY · PubMed Central
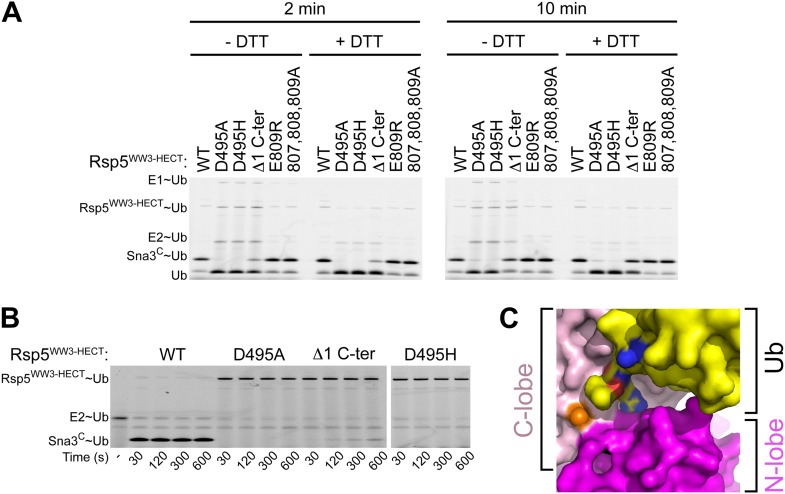
Figure 6—figure supplement 1. A role for HECT domain C-terminus in ligation. (A) Multiple-turnover assays showing ligation of fluorescent methylated Ub to Sna3C for 2 or 10 min, by the indicated versions of Rsp5WW3-HECT. Δ1 C-ter refers to deletion of the C-terminal residue Glu809. Reactions are shown in the absence of DTT (left) to confirm the abilities of mutant proteins to form E2∼Ub and E3∼Ub intermediates, and with DTT (right) to show isopeptide-bonded products. (B) Nonreducing gels from pulse-chase transfer assay of fluorescent Ub from E2-to-Rsp5-to-Sna3C using indicated mutants of Rsp5. Bands corresponding to thioester-linked E2∼Ub and Rsp5WW3-HECT∼Ub intermediates and isopeptide-bonded Sna3C∼Ub product are indicated. (C) Surface view of Rsp5WW3-HECTxUbxSna3C structure, with the HECT domain N-lobe in magenta and C-lobe in pink, and Ub in yellow. Ub's residues 72, 73, and 74 are shown with nitrogens in blue and oxygens in red to highlight exposed basic patches. DOI: http://dx.doi.org/10.7554/eLife.00828.012
Figure 6—figure supplement 1. A role for HECT domain C-terminus in ligation. (A) Multiple-turnover assays showing ligation of fluorescent methylated Ub to Sna3C for 2 or 10 min, by the indicated versions of Rsp5WW3-HECT. Δ1 C-ter refers to deletion of the C-terminal residue Glu809. Reactions are shown in the absence of DTT (left) to confirm the abilities of mutant proteins to form E2∼Ub and E3∼Ub intermediates, and with DTT (right) to show isopeptide-bonded products. (B) Nonreducing gels from pulse-chase transfer assay of fluorescent Ub from E2-to-Rsp5-to-Sna3C using indicated mutants of Rsp5. Bands corresponding to thioester-linked E2∼Ub and Rsp5WW3-HECT∼Ub intermediates and isopeptide-bonded Sna3C∼Ub product are indicated. (C) Surface view of Rsp5WW3-HECTxUbxSna3C structure, with the HECT domain N-lobe in magenta and C-lobe in pink, and Ub in yellow. Ub's residues 72, 73, and 74 are shown with nitrogens in blue and oxygens in red to highlight exposed basic patches. DOI: http://dx.doi.org/10.7554/eLife.00828.012CC BY · PubMed Central
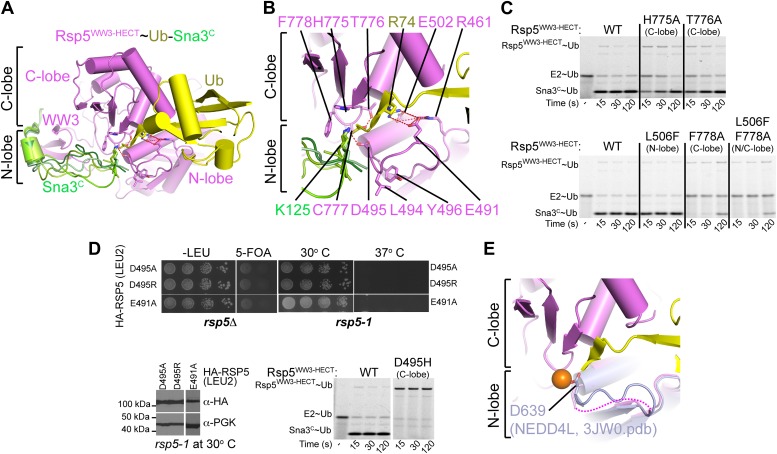
Figure 7. A distinctive active site for HECT E3-mediated ligation. (A) Rosetta-generated models for Sna3C (different models in different shades of green) target lysine approaching Rsp5WW3-HECT (violet) active site Cys777 thioester-linked to Ub (yellow). (B) Model for residues aligning thioester-bound Ub and Sna3C acceptor lysine approaching the active site. (C) Nonreducing gels from pulse-chase assay for transfer of fluorescent Ub from E2-to-Rsp5-to-Sna3C using indicated versions of Rsp5WW3-HECT. Bands corresponding to thioester-linked E2∼Ub and Rsp5WW3-HECT∼Ub intermediates and isopeptide-bonded Sna3C∼Ub product are indicated. (D) Yeast complementation assays for the indicated HA-Rsp5 mutants. (E) Close-up of structural superposition of N-lobes showing catalytic loop from NEDD4LHECT (Kamadurai et al., 2009) not visible in Rsp5WW3-HECT (violet) structure. DOI: http://dx.doi.org/10.7554/eLife.00828.013
Figure 7. A distinctive active site for HECT E3-mediated ligation. (A) Rosetta-generated models for Sna3C (different models in different shades of green) target lysine approaching Rsp5WW3-HECT (violet) active site Cys777 thioester-linked to Ub (yellow). (B) Model for residues aligning thioester-bound Ub and Sna3C acceptor lysine approaching the active site. (C) Nonreducing gels from pulse-chase assay for transfer of fluorescent Ub from E2-to-Rsp5-to-Sna3C using indicated versions of Rsp5WW3-HECT. Bands corresponding to thioester-linked E2∼Ub and Rsp5WW3-HECT∼Ub intermediates and isopeptide-bonded Sna3C∼Ub product are indicated. (D) Yeast complementation assays for the indicated HA-Rsp5 mutants. (E) Close-up of structural superposition of N-lobes showing catalytic loop from NEDD4LHECT (Kamadurai et al., 2009) not visible in Rsp5WW3-HECT (violet) structure. DOI: http://dx.doi.org/10.7554/eLife.00828.013CC BY · PubMed Central
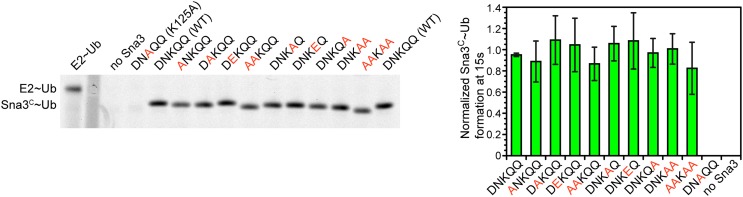
Figure 7—figure supplement 1. Residues proximal to the acceptor lysine in Sna3 play insignificant roles in ubiquitination. The residues around K125 (DNKQQ) are individually or collectively mutated to Ala or Glu and product formation at 15 s in pulse-chase fluorescent Ub transfer assay with Rsp5WW1-3-HECT is shown. Neither the Ala or Glu mutations significantly affect Sna3C ubiquitination. DOI: http://dx.doi.org/10.7554/eLife.00828.014
Figure 7—figure supplement 1. Residues proximal to the acceptor lysine in Sna3 play insignificant roles in ubiquitination. The residues around K125 (DNKQQ) are individually or collectively mutated to Ala or Glu and product formation at 15 s in pulse-chase fluorescent Ub transfer assay with Rsp5WW1-3-HECT is shown. Neither the Ala or Glu mutations significantly affect Sna3C ubiquitination. DOI: http://dx.doi.org/10.7554/eLife.00828.014CC BY · PubMed Central
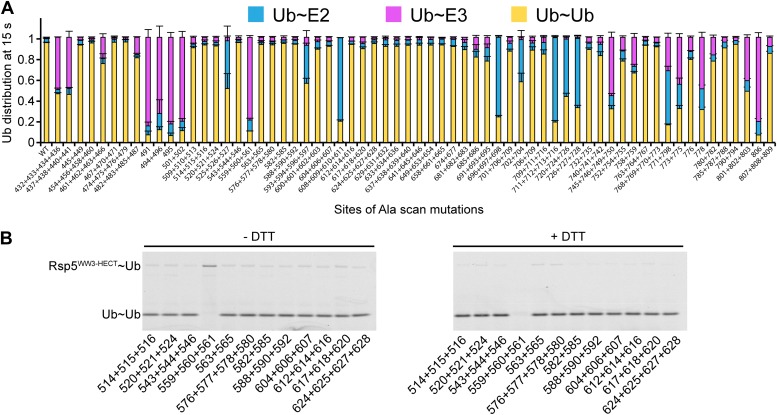
Figure 8. Ala scan for HECT domain surfaces required for di-Ub synthesis. (A) Summary of the effects of indicated Rsp5WW3-HECT HECT domain Ala mutations on pulse-chase fluorescent Ub transfer from E2 to Rsp5WW3-HECT and then to Ub. Total activity within each gel lane was determined by adding all intensities for all three species (E2∼Ub, Rsp5WW3-HECT∼Ub, and Ub∼Ub) and was used to estimate the relative yield of each with respect to wild-type proteins. The error bar shows the standard deviation (SD) for three independent replicates. (B) Fluorescent imaging of representative nonreducing (left) and reducing (right) gels from assays used for data in A, monitoring pulse-chase fluorescent Ub transfer from E2 to the indicated versions of Rsp5WW3-HECT to Ub. The chase was 15 s. DOI: http://dx.doi.org/10.7554/eLife.00828.015
Figure 8. Ala scan for HECT domain surfaces required for di-Ub synthesis. (A) Summary of the effects of indicated Rsp5WW3-HECT HECT domain Ala mutations on pulse-chase fluorescent Ub transfer from E2 to Rsp5WW3-HECT and then to Ub. Total activity within each gel lane was determined by adding all intensities for all three species (E2∼Ub, Rsp5WW3-HECT∼Ub, and Ub∼Ub) and was used to estimate the relative yield of each with respect to wild-type proteins. The error bar shows the standard deviation (SD) for three independent replicates. (B) Fluorescent imaging of representative nonreducing (left) and reducing (right) gels from assays used for data in A, monitoring pulse-chase fluorescent Ub transfer from E2 to the indicated versions of Rsp5WW3-HECT to Ub. The chase was 15 s. DOI: http://dx.doi.org/10.7554/eLife.00828.015CC BY · PubMed Central
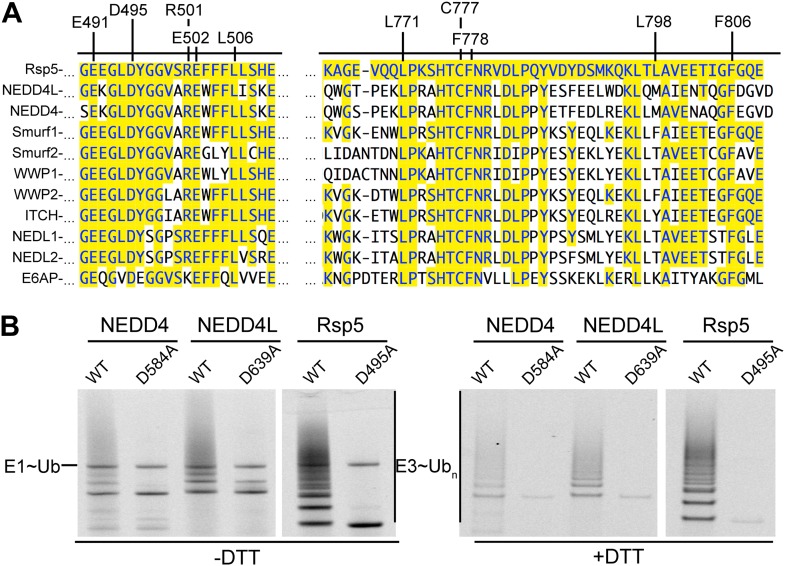
Figure 9. Key residues for ligation are conserved across HECT E3s. (A) Alignment of portions of sequence from Rsp5 with corresponding regions of human NEDD4L, NEDD4, Smurf1, Smurf2, WWP1, WWP2, ITCH, NEDL1, NEDL2, and E6AP showing conservation of key residues establishing the ligation mechanism. Identity to Rsp5 sequence is highlighted in yellow. (B) Fluorescent images of nonreducing (left) and reducing (right) gels of multiple turnover autoubiquitination assays for wild-type and the indicated Asp-to-Ala mutant versions of NEDD4WW1-4-HECT, NEDD4L1-3-4-HECT, and Rsp5WW1-3-HECT. DOI: http://dx.doi.org/10.7554/eLife.00828.016
Figure 9. Key residues for ligation are conserved across HECT E3s. (A) Alignment of portions of sequence from Rsp5 with corresponding regions of human NEDD4L, NEDD4, Smurf1, Smurf2, WWP1, WWP2, ITCH, NEDL1, NEDL2, and E6AP showing conservation of key residues establishing the ligation mechanism. Identity to Rsp5 sequence is highlighted in yellow. (B) Fluorescent images of nonreducing (left) and reducing (right) gels of multiple turnover autoubiquitination assays for wild-type and the indicated Asp-to-Ala mutant versions of NEDD4WW1-4-HECT, NEDD4L1-3-4-HECT, and Rsp5WW1-3-HECT. DOI: http://dx.doi.org/10.7554/eLife.00828.016CC BY · PubMed Central
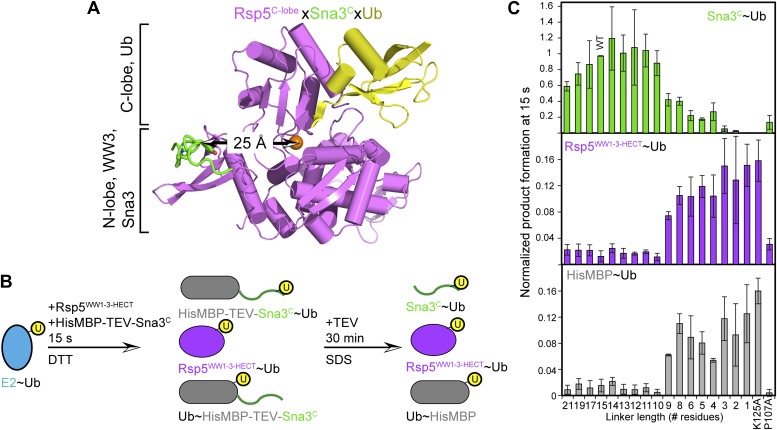
Figure 10. HECT domain architecture for ubiquitin ligation suggests mechanism for substrate lysine prioritization. (A) Structure of Rsp5WW3-HECT (violet) xUb (yellow) xSna3C (green), highlighting 25 Å distance between the alpha carbon of Sna3C Tyr109 in the PPXY motif and the sulfur of Rsp5WW3-HECT Cys777. (B) Schematic view of substrate selection assay. (C) Rsp5WW1-3-HECT selection between substrates with relative distributions of non-reducible Sna3C∼Ub (green bar graph), autoubiquitinated Rsp5WW1-3-HECT∼Ub (violet bar graph), and HisMBP∼Ub (gray bar graph) products of reactions with substrates bearing the indicated number of residues between the Sna3C PPXY motif and lysine. Effects of Ala mutations in place of the Sna3C acceptor Lys125 and the WW3-binding Pro107 are shown as controls. DOI: http://dx.doi.org/10.7554/eLife.00828.017
Figure 10. HECT domain architecture for ubiquitin ligation suggests mechanism for substrate lysine prioritization. (A) Structure of Rsp5WW3-HECT (violet) xUb (yellow) xSna3C (green), highlighting 25 Å distance between the alpha carbon of Sna3C Tyr109 in the PPXY motif and the sulfur of Rsp5WW3-HECT Cys777. (B) Schematic view of substrate selection assay. (C) Rsp5WW1-3-HECT selection between substrates with relative distributions of non-reducible Sna3C∼Ub (green bar graph), autoubiquitinated Rsp5WW1-3-HECT∼Ub (violet bar graph), and HisMBP∼Ub (gray bar graph) products of reactions with substrates bearing the indicated number of residues between the Sna3C PPXY motif and lysine. Effects of Ala mutations in place of the Sna3C acceptor Lys125 and the WW3-binding Pro107 are shown as controls. DOI: http://dx.doi.org/10.7554/eLife.00828.017CC BY · PubMed Central
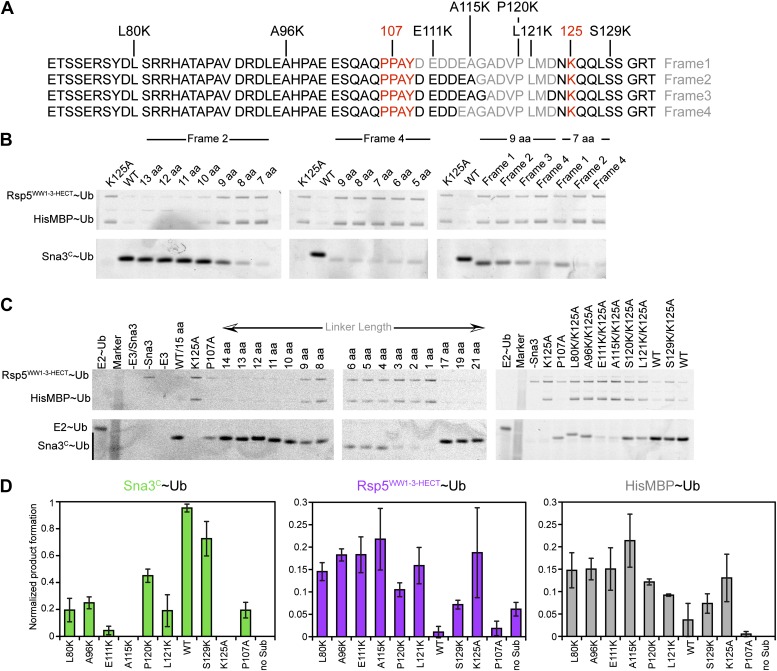
Figure 10—figure supplement 1. Data supporting Rsp5WW3-HECT target Lys prioritization. (A) Wild-type Sna3C has 15 residues between the PPXY motif and acceptor Lys125. Deletion mutants were made starting at different positions after the PPXY motif, referred to as Frame1 for deletions immediately following Tyr109, as Frame2 for deletions immediately following Ala115, as Frame3 for deletions immediately following Gly116, and as Frame4 for deletions immediately following Asp113. The maximum deletion sequence for each frame, including for data shown in B, is represented in gray. Positions of Lys substitution (tested in C) in the K125A background are indicated above the sequences. (B) Pulse-chase assays performed with fluorescent Ub∼E2 added to a mixture of Rsp5WW1-3-HECT and HisMBP-TEV-Sna3C, and the reaction terminated by adding DTT to reduce any remaining intermediates and identify only isopeptide-bonded reaction products. Shown are reaction products for mutants with the indicated number of linker residues after treatment with TEV protease, allowing comparison of the levels of fluorescent Ub-ligated Sna3C, HisMBP, and autoubiquitinated Rsp5WW1-3-HECT (see also Figure 10C). (C) Representative raw data from pulse-chase assays with substrates containing different linker lengths in Frame2 or Lys in different positions in the sequence in the K125A background. All lanes but E2∼Ub alone were treated with DTT to examine ligation products. (D) Plots showing the yield for each species from C for the lysine mutants, normalized with respect to total activity with wild-type proteins. DOI: http://dx.doi.org/10.7554/eLife.00828.018
Figure 10—figure supplement 1. Data supporting Rsp5WW3-HECT target Lys prioritization. (A) Wild-type Sna3C has 15 residues between the PPXY motif and acceptor Lys125. Deletion mutants were made starting at different positions after the PPXY motif, referred to as Frame1 for deletions immediately following Tyr109, as Frame2 for deletions immediately following Ala115, as Frame3 for deletions immediately following Gly116, and as Frame4 for deletions immediately following Asp113. The maximum deletion sequence for each frame, including for data shown in B, is represented in gray. Positions of Lys substitution (tested in C) in the K125A background are indicated above the sequences. (B) Pulse-chase assays performed with fluorescent Ub∼E2 added to a mixture of Rsp5WW1-3-HECT and HisMBP-TEV-Sna3C, and the reaction terminated by adding DTT to reduce any remaining intermediates and identify only isopeptide-bonded reaction products. Shown are reaction products for mutants with the indicated number of linker residues after treatment with TEV protease, allowing comparison of the levels of fluorescent Ub-ligated Sna3C, HisMBP, and autoubiquitinated Rsp5WW1-3-HECT (see also Figure 10C). (C) Representative raw data from pulse-chase assays with substrates containing different linker lengths in Frame2 or Lys in different positions in the sequence in the K125A background. All lanes but E2∼Ub alone were treated with DTT to examine ligation products. (D) Plots showing the yield for each species from C for the lysine mutants, normalized with respect to total activity with wild-type proteins. DOI: http://dx.doi.org/10.7554/eLife.00828.018CC BY · PubMed Central
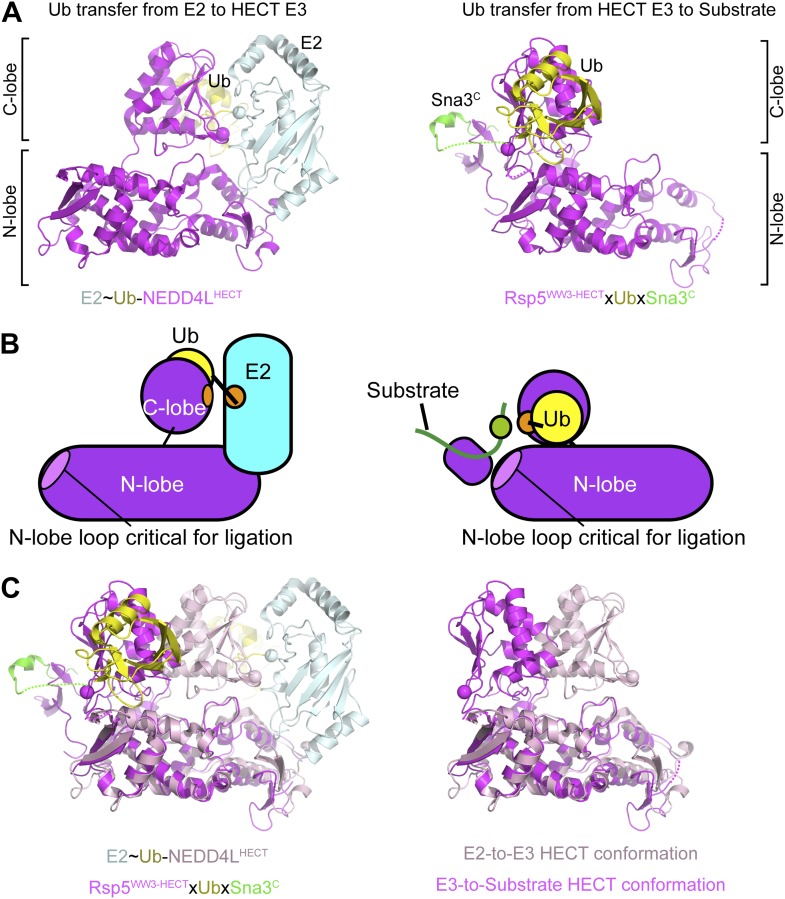
Figure 11. Structural view of the ubiquitin transfer cascade for a HECT E3. (A) Top left: Prior structure of E2 (pale cyan, with active site as sphere)∼Ub (yellow)-NEDD4LHECT (violet, with active site as sphere) (Kamadurai et al., 2009). Right: new structure of Rsp5WW3-HECT (violet, with active site as sphere) xUb (yellow) xSna3C (green) aligned over the N-lobes of the NEDD4L and Rsp5 HECT domains. (B) Schematic views of E2-to-E3 Ub transfer and E3-to-substrate Ub ligation. (C) The different relative orientations of the HECT domain N-lobe with respect to the HECT domain C-lobe∼Ub are highlighted by superimposing the N-lobes of the E2 (pale cyan, with active site as sphere)∼Ub (yellow)-NEDD4LHECT (pink, with active site as sphere) (Kamadurai et al., 2009) and Rsp5WW3-HECT (violet, with active site as sphere) xUb (yellow) xSna3C (green) structures. The HECT domain portions of the two structures are shown on the right. DOI: http://dx.doi.org/10.7554/eLife.00828.019
Figure 11. Structural view of the ubiquitin transfer cascade for a HECT E3. (A) Top left: Prior structure of E2 (pale cyan, with active site as sphere)∼Ub (yellow)-NEDD4LHECT (violet, with active site as sphere) (Kamadurai et al., 2009). Right: new structure of Rsp5WW3-HECT (violet, with active site as sphere) xUb (yellow) xSna3C (green) aligned over the N-lobes of the NEDD4L and Rsp5 HECT domains. (B) Schematic views of E2-to-E3 Ub transfer and E3-to-substrate Ub ligation. (C) The different relative orientations of the HECT domain N-lobe with respect to the HECT domain C-lobe∼Ub are highlighted by superimposing the N-lobes of the E2 (pale cyan, with active site as sphere)∼Ub (yellow)-NEDD4LHECT (pink, with active site as sphere) (Kamadurai et al., 2009) and Rsp5WW3-HECT (violet, with active site as sphere) xUb (yellow) xSna3C (green) structures. The HECT domain portions of the two structures are shown on the right. DOI: http://dx.doi.org/10.7554/eLife.00828.019CC BY · PubMed Central
Image 18
CC BY · PubMed Central
Image 19
CC BY · PubMed Central
Image 20
CC BY · PubMed Central
Image 21
CC BY · PubMed Central
Image 22
CC BY · PubMed Central
Image 23
CC BY · PubMed Central
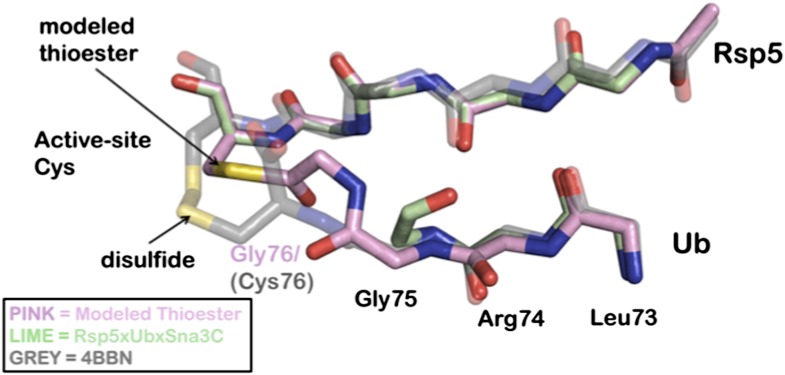
Author response image 1. Overlay of modeled thioester conjugated tail with recently disulfide conjugated Ub to NEDD4 (4BBN). A Rosetta model is depicted in pink, the Rsp5xUbXSna3C structure is green, and the disulfide chemical surrogate is colored grey. The Rosetta model provides near atomic-level accuracy of the thioester conjugated Ub tail. The similarities between the structure and the model strongly support the position of the acceptor lysine.
Author response image 1. Overlay of modeled thioester conjugated tail with recently disulfide conjugated Ub to NEDD4 (4BBN). A Rosetta model is depicted in pink, the Rsp5xUbXSna3C structure is green, and the disulfide chemical surrogate is colored grey. The Rosetta model provides near atomic-level accuracy of the thioester conjugated Ub tail. The similarities between the structure and the model strongly support the position of the acceptor lysine.CC BY · PubMed Central

Verification

Claims the paper makes

The claims and statistics of this paper haven’t been checked yet.

Run the check — free, no account needed. It reads the open-access text and checks the sources it cites.

A few free checks a day · papers already verified open instantly · results are public

Claims other papers make about this one

Each is checked against this paper’s own text: does it say what the citing paper says it does?

Self-check

Percentages, sums and reported differences re-computed from the paper’s own numbers.

The self-check needs the paper’s full text.

Citations

Cites

Show all 60 references

Cited by

Sorted by citations

See all 165

Metadata

Authors
Kamadurai, H. B., Qiu, Y., Deng, A., Harrison, J. S., MacDonald, C., Actis, M., Rodrigues, P., Miller, D. J., Souphron, J., Lewis, S. M., Kurinov, I., Fujii, N., Hammel, M., Piper, R., Kuhlman, B., & Schulman, B. A.
Affiliations
  • St. Jude Children's Research Hospital (US)
  • University of North Carolina at Chapel Hill (US)
  • University of Iowa (US)
  • Centre National de la Recherche Scientifique (FR)
  • Cornell University (US)
  • Lawrence Berkeley National Laboratory (US)
Corresponding author
  • Kamadurai, Hari B
  • Schulman, Brenda A
Venue
eLife
Published
2013-08-08
Volume
2
Pages
e00828-e00828
ISSN
2050-084X (ISSN-L)
OpenAlex
W2037607907
Cited by
165
References
60
Citations by year
2026: 10 · 2025: 10 · 2024: 19 · 2023: 8 · 2022: 8 · 2021: 12 · 2020: 15 · 2019: 7 · 2018: 8 · 2017: 19 · 2016: 17 · 2015: 14 · 2014: 14 · 2013: 4
FWCI
7.31
Type
journal article
Language
en
Open access
Locations
  • eLife (publishedVersion, cc-by)
  • Europe PMC (PubMed Central) (publishedVersion, cc-by)
  • PubMed Central (publishedVersion, cc-by)
  • PubMed (publishedVersion)
  • Carolina Digital Repository (University of North Carolina at Chapel Hill) (submittedVersion)
  • Scholarly Commons (University of the Pacific) (submittedVersion, cc-by)
  • DOAJ (DOAJ: Directory of Open Access Journals) (submittedVersion, cc-by-sa)
  • OSTI OAI (U.S. Department of Energy Office of Scientific and Technical Information) (submittedVersion)
  • UNC Libraries
Funders
  • Howard Hughes Medical Institute (045102)
  • National Institutes of Health (R01GM069530, 5P30CA021765, R01GM073960, 5P41RR015301-10, 8P41 GM103403-10, 5R01 GM058202)
  • ALSAC
  • DOE (DE-AC02-06CH11357)
  • American Heart Association
  • U.S. Department of Energy (DE-AC02-06CH11357)
Topics
  • Life Sciences › Biochemistry, Genetics and Molecular Biology › Molecular Biology › Ubiquitin and proteasome pathways
  • Life Sciences › Biochemistry, Genetics and Molecular Biology › Structural Biology › Enzyme Structure and Function
  • Life Sciences › Biochemistry, Genetics and Molecular Biology › Molecular Biology › Protein Degradation and Inhibitors
Keywords
HECT E3 ubiquitin ligase, ubiquitination, HECT domain, thioester bond, substrate-binding domain, protein degradation, protein structure
MeSH terms
Amino Acid Sequence, Lysine, Molecular Sequence Data, Protein Conformation, Mutagenesis, Sequence Homology, Amino Acid, Catalytic Domain, Ubiquitin, Ubiquitin-Protein Ligases

About these checks

Registry, retraction, Cites and statistics results are computed, not judged, with one exception: a printed reference that no index lists is read once by a model before it counts as a citation error. Claims are extracted by a model and kept only when their quote appears verbatim in the text; each cited source is then checked, with a model’s help, for whether it says what the claim relies on. Those verdicts can be wrong — read the claim’s quote and the cited source before relying on one.

Statistics and arithmetic are recomputed, not judged.

Confidence bands are shown only for fields calibrated on our annotated test set. None is calibrated yet, so no band is shown.

What counts as a claim ›How we measure confidence ›How we check this ›

Are you an author, or do you see a problem with this page? Request a review