

The DOI matches its Crossref record; 93 of the 95 references it cites were found in a registry or an index.
Sex-specific processing of social cues in the medial amygdala
Open accessAbstract
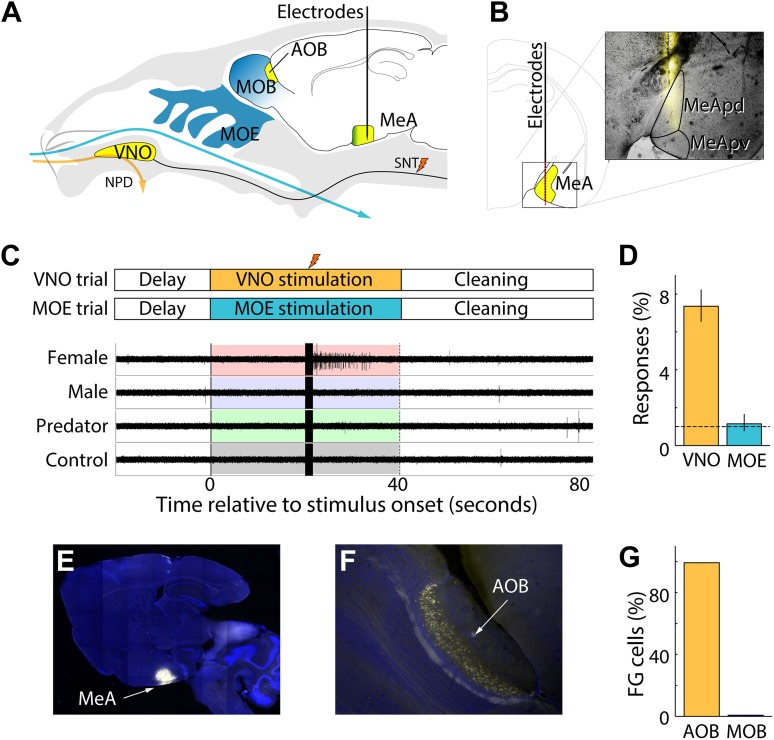
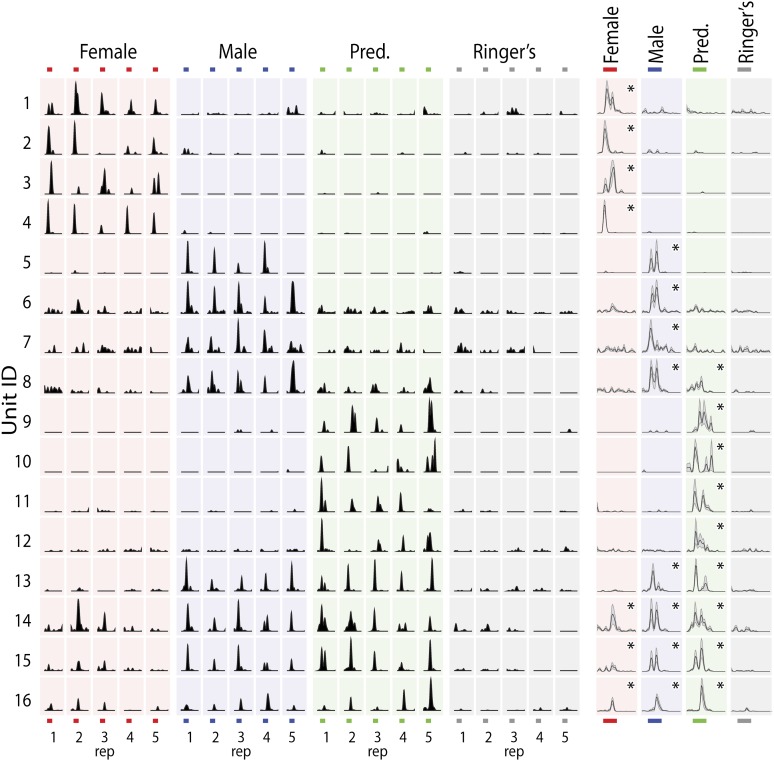
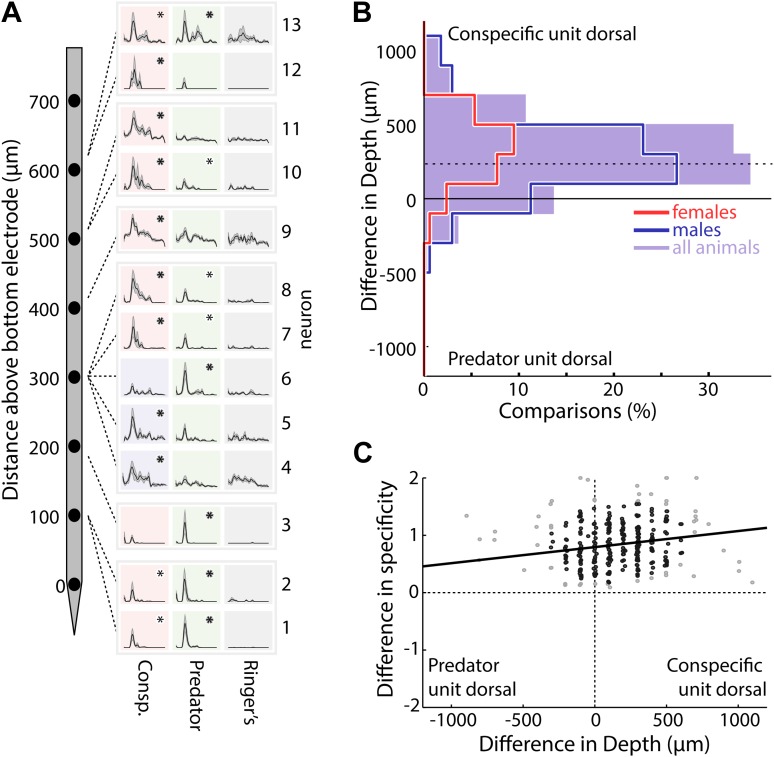
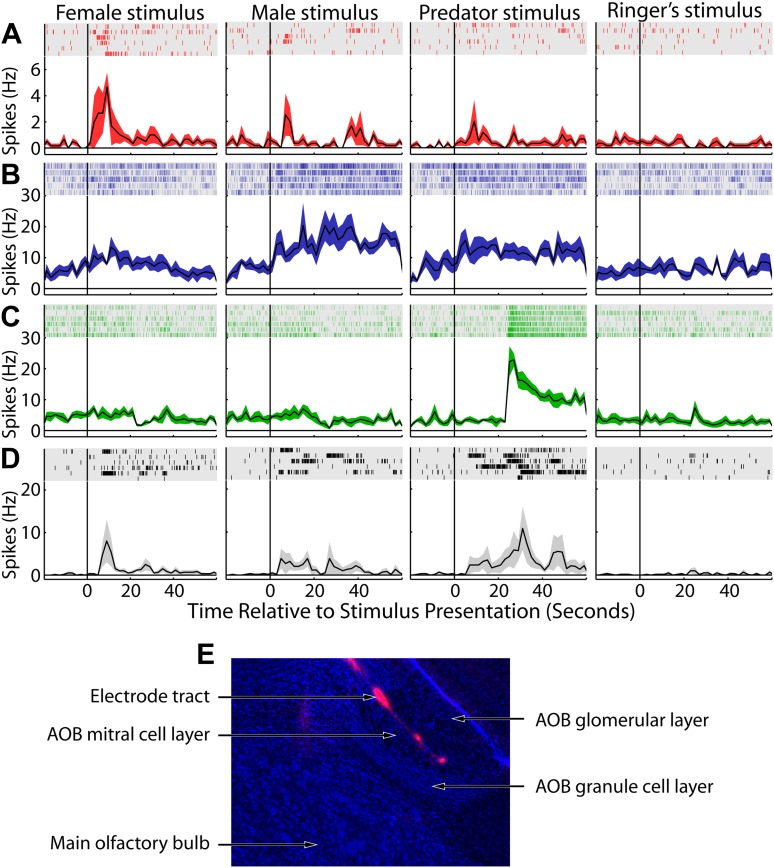
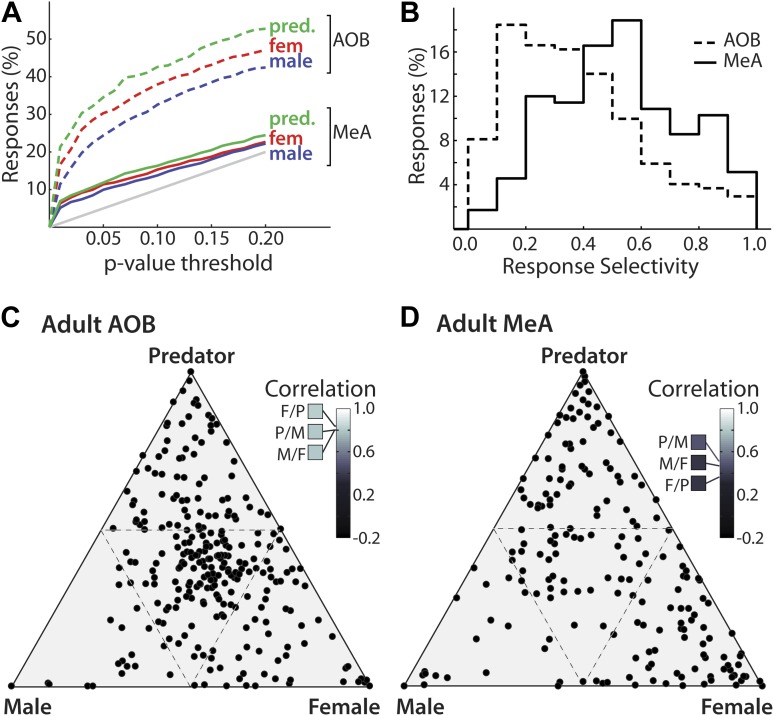
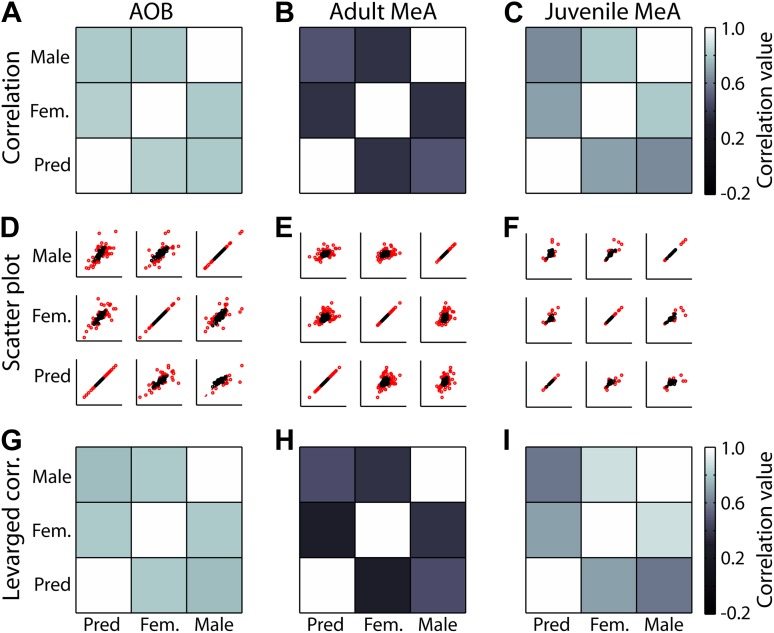
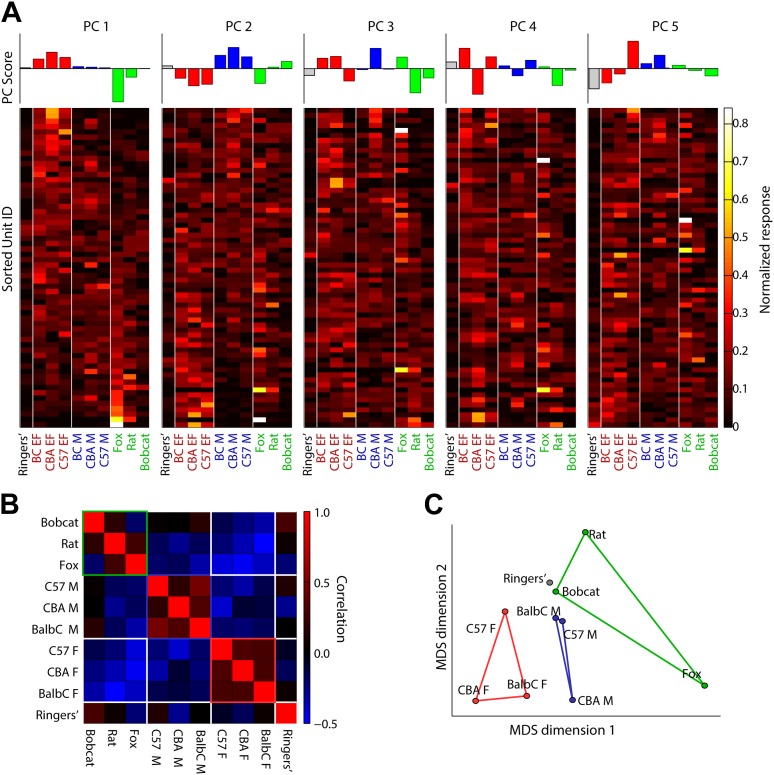
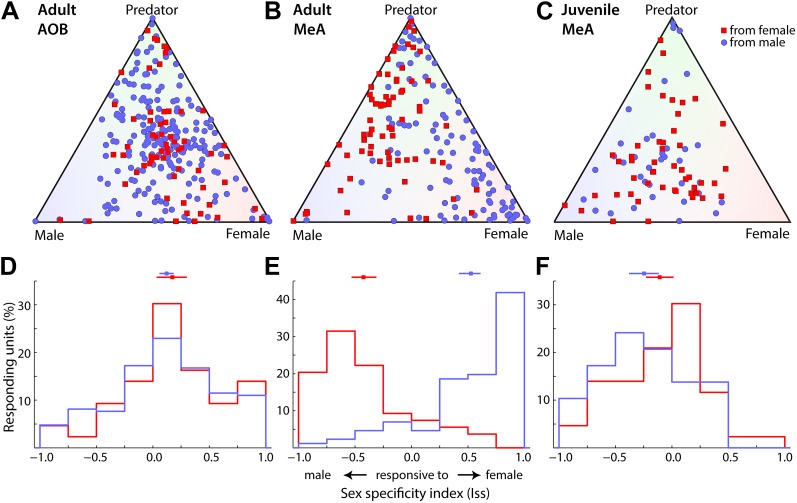
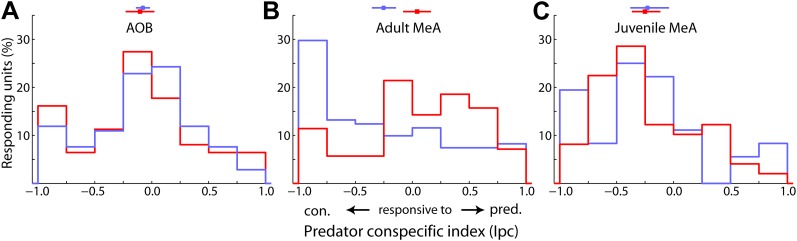
Animal-animal recognition within, and across species, is essential for predator avoidance and social interactions. Despite its essential role in orchestrating responses to animal cues, basic principles of information processing by the vomeronasal system are still unknown. The medial amygdala (MeA) occupies a central position in the vomeronasal pathway, upstream of hypothalamic centers dedicated to defensive and social responses. We have characterized sensory responses in the mouse MeA and uncovered emergent properties that shed new light onto the transformation of vomeronasal information into sex- and species-specific responses. In particular, we show that the MeA displays a degree of stimulus selectivity and a striking sexually dimorphic sensory representation that are not observed in the upstream relay of the accessory olfactory bulb (AOB). Furthermore, our results demonstrate that the development of sexually dimorphic circuits in the MeA requires steroid signaling near the time of puberty to organize the functional representation of sensory stimuli.DOI: http://dx.doi.org/10.7554/eLife.02743.001.
Overview
The claims and statistics of this paper haven’t been checked yet.
Run the check — free, no account needed. It reads the open-access text and checks the sources it cites.
Integrity signals
Registry
Cites
Statistics
Figures
Verification
Claims the paper makes
The claims and statistics of this paper haven’t been checked yet.
Run the check — free, no account needed. It reads the open-access text and checks the sources it cites.
Claims other papers make about this one
Each is checked against this paper’s own text: does it say what the citing paper says it does?
The cited source says what the claim attributes to it.
In the citing paper
“The MeA is a region responsible for processing social information in a sex-specific manner (Bergan et al., 2014; Lischinsky et al., 2017), and has long been implicated as necessary for the sex differences in social play.”
From Developmental origins of sex differences in the neural circuitry of play (2020) · cites this paper as Bergan et al., 2014
In the citing paper
“Electrical recordings in the MeApd of anesthetized mice have revealed sex-dependent differences in the neural responses to social cues (Bergan et al., 2014), while Fos induction following social interactions showed widely dispersed response patterns (Carvalho et al., 2015; Choi et al., 2005).”
From Neuronal Representation of Social Information in the Medial Amygdala of Awake Behaving Mice (2017) · cites this paper as Bergan et al., 2014
Self-check
Percentages, sums and reported differences re-computed from the paper’s own numbers.
The self-check needs the paper’s full text.
Citations
Cites
An Introduction to the Bootstrap
Efron, B., & Tibshirani, R. J. (1994) · doi:10.1201/9780429246593 · Cited by 40,500
An Introduction to the Bootstrap
Efron, B., & Tibshirani, R. J. (1993) · doi:10.1007/978-1-4899-4541-9 · Cited by 21,230
The mouse brain in stereotaxic coordinates
Konsman, J. (2003) · Psychoneuroendocrinology · doi:10.1016/s0306-4530(03)00088-x · Cited by 16,796
The Mouse Brain in Stereotaxic Coordinates
Paxinos, G. (2001) · Cited by 12,859
Emergence of simple-cell receptive field properties by learning a sparse code for natural images
Olshausen, B. A., & Field, D. J. (1996) · Nature · doi:10.1038/381607a0 · Cited by 5,694
Rowan, W., & Tinbergen, N. (1952) · Bird-Banding · doi:10.2307/4510368 · Cited by 2,706
Critical period plasticity in local cortical circuits
Hensch, T. K. (2005) · Nature Reviews Neuroscience · doi:10.1038/nrn1787 · Cited by 2,323
Invariant visual representation by single neurons in the human brain
Quiroga, R. Q., Reddy, L., Kreiman, G., Koch, C., & Fried, I. (2005) · Nature · doi:10.1038/nature03687 · Cited by 1,988
PHOENIX, C. H., GOY, R. W., GERALL, A. A., & YOUNG, W. C. (1959) · Endocrinology · doi:10.1210/endo-65-3-369 · Cited by 1,934
Sexual Differentiation of the Central Nervous System
MacLusky, N. J., & Naftolin, F. (1981) · Science · doi:10.1126/science.6163211 · Cited by 1,469
Cited by
Sorted by citations
Ventromedial hypothalamic neurons control a defensive emotion state
Kunwar, P. S., Zelikowsky, M., Remedios, R., Cai, H., Balban, M. Y., Meister, M., & Anderson, D. J. (2015) · eLife · doi:10.7554/elife.06633 · Cited by 1,130
Neural circuit mechanisms of social behavior
Chen, P., & Hong, W. (2018) · Neuron · doi:10.1016/j.neuron.2018.02.026 · Cited by 527
Functional circuit architecture underlying parental behaviour
Kohl, J., Babayan, B. M., Rubinstein, N. D., Autry, A. E., Marin-Rodriguez, B., Kapoor, V., Miyamichi, K., Zweifel, L. S., Luo, L., Uchida, N., et al. (2018) · Nature · doi:10.1038/s41586-018-0027-0 · Cited by 470
Self-citationDetecting Activated Cell Populations Using Single-Cell RNA-Seq
Wu, Y. E., Pan, L., Zuo, Y., Li, X., & Hong, W. (2017) · Neuron · doi:10.1016/j.neuron.2017.09.026 · Cited by 438
Hong, W., Kim, D.-W., & Anderson, D. J. (2014) · Cell · doi:10.1016/j.cell.2014.07.049 · Cited by 405
Combined Social and Spatial Coding in a Descending Projection from the Prefrontal Cortex
Murugan, M., Jang, H. J., Park, M., Miller, E. M., Cox, J., Taliaferro, J. P., Parker, N. F., Bhave, V., Hur, H., Liang, Y., et al. (2017) · Cell · doi:10.1016/j.cell.2017.11.002 · Cited by 311
Neuronal Representation of Social Information in the Medial Amygdala of Awake Behaving Mice
Li, Y., Mathis, A., Grewe, B. F., Osterhout, J. A., Ahanonu, B., Schnitzer, M. J., Murthy, V. N., & Dulac, C. (2017) · Cell · doi:10.1016/j.cell.2017.10.015 · Cited by 291
Self-citationVanRyzin, J. W., Marquardt, A. E., Argue, K. J., Vecchiarelli, H. A., Ashton, S. E., Arambula, S. E., Hill, M. N., & McCarthy, M. M. (2019) · Neuron · doi:10.1016/j.neuron.2019.02.006 · Cited by 272
Medial amygdalar aromatase neurons regulate aggression in both sexes
Unger, E. K., Burke, K. J., Yang, C. F., Bender, K. J., Fuller, P. M., & Shah, N. M. (2015) · Cell Reports · doi:10.1016/j.celrep.2014.12.040 · Cited by 275
Hypothalamic control of male aggression-seeking behavior
Falkner, A. L., Grosenick, L., Davidson, T. J., Deisseroth, K. A., & Lin, D. (2016) · Nature Neuroscience · doi:10.1038/nn.4264 · Cited by 241
Prefrontal–amygdala circuits in social decision-making
Gangopadhyay, P., Chawla, M., Monte, O. D., & Chang, S. W. C. (2020) · Nature Neuroscience · doi:10.1038/s41593-020-00738-9 · Cited by 266
Aversion and Attraction through Olfaction
Li, Q., & Liberles, S. D. (2015) · Current Biology · doi:10.1016/j.cub.2014.11.044 · Cited by 210
A labeled-line neural circuit for pheromone-mediated sexual behaviors in mice
Ishii, K. K., Osakada, T., Mori, H., Miyasaka, N., Yoshihara, Y., Miyamichi, K., & Touhara, K. (2017) · Neuron · doi:10.1016/j.neuron.2017.05.038 · Cited by 185
Sakurai, K., Zhao, S., Takatoh, J., Rodriguez, E., Lu, J., Leavitt, A. D., Fu, M., Han, B.-X., & Wang, F. (2016) · Neuron · doi:10.1016/j.neuron.2016.10.015 · Cited by 180
An amygdala-to-hypothalamus circuit for social reward
Hu, R. K., Zuo, Y., Ly, T., Wang, J., Meera, P., Wu, Y. E., & Hong, W. (2021) · Nature Neuroscience · doi:10.1038/s41593-021-00828-2 · Cited by 174
The neural circuits of mating and fighting in male mice
Hashikawa, K., Hashikawa, Y., Falkner, A. L., & Lin, D. (2016) · Current Opinion in Neurobiology · doi:10.1016/j.conb.2016.01.006 · Cited by 165
Oxytocin signaling in the medial amygdala is required for sex discrimination of social cues
Yao, S., Bergan, J., Lanjuin, A., & Dulac, C. (2017) · eLife · doi:10.7554/elife.31373 · Cited by 151
Self-citationCorrelated Neural Activity across the Brains of Socially Interacting Bats
Zhang, W., & Yartsev, M. M. (2019) · Cell · doi:10.1016/j.cell.2019.05.023 · Cited by 143
Neural and Hormonal Control of Sexual Behavior
Jennings, K. J., & de Lecea, L. (2020) · Endocrinology · doi:10.1210/endocr/bqaa150 · Cited by 162
Estrogen involvement in social behavior in rodents: Rapid and long-term actions
Ervin, K. S. J., Lymer, J., Matta, R., Clipperton‐Allen, A. E., Kavaliers, M., & Choleris, E. (2015) · Hormones and Behavior · doi:10.1016/j.yhbeh.2015.05.023 · Cited by 147
Organization of neural circuits underlying social behavior: A consideration of the medial amygdala
Raam, T., & Hong, W. (2021) · Current Opinion in Neurobiology · doi:10.1016/j.conb.2021.02.008 · Cited by 134
Dynamics of social representation in the mouse prefrontal cortex
Levy, D. R., Tamir, T., Kaufman, M., Parabucki, A., Weissbrod, A., Schneidman, E., & Yizhar, O. (2019) · Nature Neuroscience · doi:10.1038/s41593-019-0531-z · Cited by 135
Divergent medial amygdala projections regulate approach–avoidance conflict behavior
Miller, S. M., Marcotulli, D., Shen, A., & Zweifel, L. S. (2019) · Nature Neuroscience · doi:10.1038/s41593-019-0337-z · Cited by 119
Signal Detection and Coding in the Accessory Olfactory System
Mohrhardt, J., Nagel, M., Fleck, D., Ben‐Shaul, Y., & Spehr, M. (2018) · Chemical Senses · doi:10.1093/chemse/bjy061 · Cited by 121
Self-citationPopulation Coding in an Innately Relevant Olfactory Area
Iurilli, G., & Datta, S. R. (2017) · Neuron · doi:10.1016/j.neuron.2017.02.010 · Cited by 107
Detection, processing and reinforcement of social cues: regulation by the oxytocin system
Menon, R., & Neumann, I. D. (2023) · Nature Reviews Neuroscience · doi:10.1038/s41583-023-00759-w · Cited by 100
Posterior amygdala regulates sexual and aggressive behaviors in male mice
Yamaguchi, T., Wei, D., Song, S. C., Lim, B. K., Tritsch, N. X., & Lin, D. (2020) · Nature Neuroscience · doi:10.1038/s41593-020-0675-x · Cited by 99
Corre, C., Friedel, M., Vousden, D. A., Metcalf, A., Spring, S., Qiu, L. R., Lerch, J. P., & Palmert, M. R. (2016) · Brain Structure and Function · doi:10.1007/s00429-014-0952-0 · Cited by 98
Transformations of neural representations in a social behaviour network
Yang, B., Karigo, T., & Anderson, D. J. (2022) · Nature · doi:10.1038/s41586-022-05057-6 · Cited by 93
The Neural Mechanisms of Sexually Dimorphic Aggressive Behaviors
Hashikawa, K., Hashikawa, Y., Lischinsky, J. E., & Lin, D. (2018) · Trends in Genetics · doi:10.1016/j.tig.2018.07.001 · Cited by 92
Cádiz‐Moretti, B., Otero‐García, M., Martínez‐Garciá, F., & Lanuza, E. (2014) · Brain Structure and Function · doi:10.1007/s00429-014-0954-y · Cited by 93
Adekunbi, D. A., Li, X. F., Lass, G., Shetty, K., Adegoke, O., Yeo, S. ‐., Colledge, W. H., Lightman, S. L., & O'Byrne, K. T. (2018) · Journal of Neuroendocrinology · doi:10.1111/jne.12572 · Cited by 89
Signatures of sex: Sex differences in gene expression in the vertebrate brain
Gegenhuber, B., & Tollkühn, J. (2019) · Wiley Interdisciplinary Reviews Developmental Biology · doi:10.1002/wdev.348 · Cited by 89
Differential Encoding of Predator Fear in the Ventromedial Hypothalamus and Periaqueductal Grey
Masferrer, M. E., Silva, B. A., Nomoto, K., Lima, S. Q., & Gross, C. T. (2020) · Journal of Neuroscience · doi:10.1523/jneurosci.0761-18.2020 · Cited by 83
Hypothalamic control of innate social behaviors
Mei, L., Osakada, T., & Lin, D. (2023) · Science · doi:10.1126/science.adh8489 · Cited by 94
Nucleus Accumbens Dopamine Signaling Regulates Sexual Preference for Females in Male Mice
Beny, Y., Zilkha, N., Lavi‐Avnon, Y., Bezalel, N., Rogachev, I., Brandis, A. S., Dayan, M., & Kimchi, T. (2017) · Cell Reports · doi:10.1016/j.celrep.2017.11.062 · Cited by 85
Functions of medial hypothalamic and mesolimbic dopamine circuitries in aggression
Yamaguchi, T., & Lin, D. (2018) · Current Opinion in Behavioral Sciences · doi:10.1016/j.cobeha.2018.06.011 · Cited by 77
Neural coding of sex-specific social information in the mouse brain
Li, Y., & Dulac, C. G. (2018) · Current Opinion in Neurobiology · doi:10.1016/j.conb.2018.07.005 · Cited by 76
Self-citationDendritic Organization of Olfactory Inputs to Medial Amygdala Neurons
Keshavarzi, S., Power, J., Albers, E. H., Sullivan, R., & Sah, P. (2015) · Journal of Neuroscience · doi:10.1523/jneurosci.0627-15.2015 · Cited by 78
State-dependent responses to sex pheromones in mouse
Stowers, L., & Liberles, S. D. (2016) · Current Opinion in Neurobiology · doi:10.1016/j.conb.2016.04.001 · Cited by 81
In the mood for sex: neural circuits for reproduction
Lenschow, C., & Lima, S. Q. (2019) · Current Opinion in Neurobiology · doi:10.1016/j.conb.2019.12.001 · Cited by 71
Genetic dissection of neural circuits underlying sexually dimorphic social behaviours
Bayless, D. W., & Shah, N. M. (2016) · Philosophical Transactions of the Royal Society B Biological Sciences · doi:10.1098/rstb.2015.0109 · Cited by 73
A social chemosignaling function for human handshaking
Frumin, I., Perl, O., Endevelt–Shapira, Y., Eisen, A., Eshel, N., Heller, I., Shemesh, M., Ravia, A., Sela, L., Arzi, A., et al. (2015) · eLife · doi:10.7554/elife.05154 · Cited by 70
Is there anybody out there? Neural circuits of threat detection in vertebrates
Pereira, A., & Moita, M. A. P. (2016) · Current Opinion in Neurobiology · doi:10.1016/j.conb.2016.09.011 · Cited by 73
Chen, A.-X., Yan, J., Zhang, W., Wang, L. A., Yu, Z., Ding, X., Wang, D., Zhang, M., Zhang, Y., Song, N., et al. (2020) · Neuron · doi:10.1016/j.neuron.2020.08.025 · Cited by 66
Neural systems that facilitate the representation of social rank
Dwortz, M. F., Curley, J. P., Tye, K. M., & Padilla-Coreano, N. (2022) · Philosophical Transactions of the Royal Society B · doi:10.1098/rstb.2020.0444 · Cited by 64
Experience-Dependent Plasticity Drives Individual Differences in Pheromone-Sensing Neurons
Xu, P. S., Lee, D., & Holy, T. E. (2016) · Neuron · doi:10.1016/j.neuron.2016.07.034 · Cited by 65
Molecular and neural control of sexually dimorphic social behaviors
Yang, T., & Shah, N. M. (2016) · Current Opinion in Neurobiology · doi:10.1016/j.conb.2016.04.015 · Cited by 61
Dynamic influences on the neural encoding of social valence
Padilla-Coreano, N., Tye, K. M., & Zelikowsky, M. (2022) · Nature reviews. Neuroscience · doi:10.1038/s41583-022-00609-1 · Cited by 59
Anxious to see you: Neuroendocrine mechanisms of social vigilance and anxiety during adolescence
Wright, E. C., Hostinar, C. E., & Trainor, B. C. (2020) · European Journal of Neuroscience · doi:10.1111/ejn.14628 · Cited by 55
Li, L., Yuan, W., He, Z., Wang, L., Jing, X.-Y., Zhang, J., Yang, Y., Guo, Q., Zhang, X., Cai, W., et al. (2018) · Psychoneuroendocrinology · doi:10.1016/j.psyneuen.2018.12.238 · Cited by 57
Wu, M. V., & Tollkühn, J. (2017) · Hormones and Behavior · doi:10.1016/j.yhbeh.2017.07.001 · Cited by 61
The ventromedial hypothalamus mediates predator fear memory
Silva, B. A., Mattucci, C., Krzywkowski, P., Cuozzo, R., Carbonari, L., & Gross, C. T. (2016) · European Journal of Neuroscience · doi:10.1111/ejn.13239 · Cited by 53
Zilkha, N., Sofer, Y., Beny, Y., & Kimchi, T. (2016) · Current Opinion in Neurobiology · doi:10.1016/j.conb.2016.04.014 · Cited by 52
Bentzur, A., Shmueli, A., Omesi, L., Ryvkin, J., Knapp, J.-M., Parnas, M., Davis, F. P., & Shohat-Ophir, G. (2018) · PLoS Genetics · doi:10.1371/journal.pgen.1007328 · Cited by 55
Neural circuits regulating sexual behaviors via the olfactory system in mice
Ishii, K. K., & Touhara, K. (2018) · Neuroscience Research · doi:10.1016/j.neures.2018.10.009 · Cited by 55
Zhang, C., Chua, B. E., Yang, A., Shabanpoor, F., Hossain, M. A., Wade, J. D., Rosengren, K. J., Smith, C. M., & Gundlach, A. L. (2015) · Behavioural Brain Research · doi:10.1016/j.bbr.2015.06.010 · Cited by 52
Innate and learned aspects of pheromone-mediated social behaviours
Beny, Y., & Kimchi, T. (2014) · Animal Behaviour · doi:10.1016/j.anbehav.2014.09.014 · Cited by 55
Lischinsky, J. E., Sokolowski, K., Li, P., Esumi, S., Kamal, Y., Goodrich, M., Oboti, L., Hammond, T. R., Krishnamoorthy, M., Feldman, D., et al. (2017) · eLife · doi:10.7554/elife.21012 · Cited by 48
Transcriptionally defined amygdala subpopulations play distinct roles in innate social behaviors
Lischinsky, J. E., Yin, L., Shi, C., Prakash, N., Burke, J., Shekaran, G., Grba, M., Corbin, J. G., & Lin, D. (2023) · Nature Neuroscience · doi:10.1038/s41593-023-01475-5 · Cited by 48
PACAP-PAC1R modulates fear extinction via the ventromedial hypothalamus
Velasco, E. R., Florido, A., Flores, Á., Senabre, E., Gomez‐Gómez, À., Torres, A., Roca, A., Norrholm, S. D., Newman, E. L., Das, P., et al. (2022) · Nature Communications · doi:10.1038/s41467-022-31442-w · Cited by 44
Sexually dimorphic control of affective state processing and empathic behaviors
Fang, S., Luo, Z.-Y., Wei, Z., Qin, Y., Zheng, J., Zhang, H., Jin, J., Li, J., Miao, C., Yang, S., et al. (2024) · Neuron · doi:10.1016/j.neuron.2024.02.001 · Cited by 48
Kuntová, B., Stopková, R., & Stopka, P. (2018) · Frontiers in Genetics · doi:10.3389/fgene.2018.00026 · Cited by 47
Dumais, K. M., Alonso, A. G., Bredewold, R., & Veenema, A. H. (2016) · Neuroscience · doi:10.1016/j.neuroscience.2016.05.036 · Cited by 42
Ishii, K., Wohl, M. P., DeSouza, A., & Asahina, K. (2020) · eLife · doi:10.7554/elife.52701 · Cited by 36
Noto, T., Zhou, G., Yang, Q., Lane, G., & Zelano, C. (2021) · Frontiers in Systems Neuroscience · doi:10.3389/fnsys.2021.752320 · Cited by 44
Neural circuit control of innate behaviors
Wei, X., Jiao, Z., Senol, E., Yao, J., Zhao, M., Zhao, Z., Chen, X., Cao, P., Fu, Y., Gao, Z., et al. (2021) · Science China Life Sciences · doi:10.1007/s11427-021-2043-2 · Cited by 40
The Accessory Olfactory System: Innately Specialized or Microcosm of Mammalian Circuitry?
Holy, T. E. (2018) · Annual Review of Neuroscience · doi:10.1146/annurev-neuro-080317-061916 · Cited by 37
Zilkha, N., Sofer, Y., Kashash, Y., & Kimchi, T. (2021) · Current Opinion in Neurobiology · doi:10.1016/j.conb.2021.03.005 · Cited by 41
Neural Control of Sexually Dimorphic Social Behavior: Connecting Development to Adulthood
McCarthy, M. M. (2023) · Annual Review of Neuroscience · doi:10.1146/annurev-neuro-121522-110856 · Cited by 40
Vahaba, D. M., & Remage‐Healey, L. (2018) · Hormones and Behavior · doi:10.1016/j.yhbeh.2018.03.007 · Cited by 37
Sex differences in main olfactory system pathways involved in psychosexual function
Cherry, J. A., & Baum, M. J. (2019) · Genes Brain & Behavior · doi:10.1111/gbb.12618 · Cited by 35
Fetter-Pruneda, I., Hart, T., Ulrich, Y., Gal, A., Oxley, P. R., Olivos-Cisneros, L., Ebert, M. S., Kazmi, M. A., Garrison, J. L., Bargmann, C. I., et al. (2021) · PLoS Biology · doi:10.1371/journal.pbio.3001305 · Cited by 36
Neural and behavioral plasticity across the female reproductive cycle
Gutiérrez‐Castellanos, N., Husain, B. F. A., Dias, I. C., & Lima, S. Q. (2022) · Trends in Endocrinology and Metabolism · doi:10.1016/j.tem.2022.09.001 · Cited by 36
Developmental origins of sex differences in the neural circuitry of play
VanRyzin, J. W., Marquardt, A. E., & McCarthy, M. M. (2020) · International Journal of Play · doi:10.1080/21594937.2020.1723370 · Cited by 34
A unified circuit for social behavior
Modi, M. E., & Şahin, M. (2018) · Neurobiology of Learning and Memory · doi:10.1016/j.nlm.2018.08.010 · Cited by 36
Krentzel, A. A., Macêdo-Lima, M., Ikeda, M. Z., & Remage‐Healey, L. (2018) · Endocrinology · doi:10.1210/en.2017-03102 · Cited by 32
Kahan, A., & Ben‐Shaul, Y. (2016) · PLoS Computational Biology · doi:10.1371/journal.pcbi.1004798 · Cited by 31
Self-citationSex-dependent control of pheromones on social organization within groups of wild house mice
Zilkha, N., Chuartzman, S. G., Sofer, Y., Pen, Y., Cum, M., Mayo, A., Alon, U. S., & Kimchi, T. (2023) · Current Biology · doi:10.1016/j.cub.2023.02.039 · Cited by 32
Brain Computation Is Organized via Power-of-Two-Based Permutation Logic
Xie, K., Fox, G. E., Liu, J., Lyu, C., Lee, J. C., Kuang, H., Jacobs, S., Li, M., Liu, T., Song, S., et al. (2016) · Frontiers in Systems Neuroscience · doi:10.3389/fnsys.2016.00095 · Cited by 30
Representation of Olfactory Information in Organized Active Neural Ensembles in the Hypothalamus
Carvalho, V. M. D. A., Nakahara, T. S., Souza, M. A. D. A., Cardozo, L. M., Trintinalia, G. Z., Pissinato, L. G., Venancio, J. O., Stowers, L., & Papes, F. (2020) · Cell Reports · doi:10.1016/j.celrep.2020.108061 · Cited by 31
McCarthy, E. A., Maqsudlu, A., Bass, M., Georghiou, S., Cherry, J. A., & Baum, M. J. (2017) · European Journal of Neuroscience · doi:10.1111/ejn.13636 · Cited by 29
Neural Circuits Underlying Rodent Sociality: A Comparative Approach
Lee, N. S., & Beery, A. K. (2019) · Current topics in behavioral neurosciences · doi:10.1007/7854_2018_77 · Cited by 31
Baran, N. M., Sklar, N. C., & Adkins–Regan, E. (2015) · Hormones and Behavior · doi:10.1016/j.yhbeh.2015.10.005 · Cited by 29
Adams, T., & Rosenkranz, J. A. (2015) · Neuropsychopharmacology · doi:10.1038/npp.2015.364 · Cited by 28
Shi, W., Meisner, O. C., Blackmore, S., Jadi, M. P., Nandy, A. S., & Chang, S. W. C. (2023) · Neurobiology of Learning and Memory · doi:10.1016/j.nlm.2023.107793 · Cited by 31
Neural mechanisms of persistent aggression
Guthman, E. M., & Falkner, A. L. (2022) · Current Opinion in Neurobiology · doi:10.1016/j.conb.2022.102526 · Cited by 31
Neural activation associated with outgroup helping in adolescent rats
Breton, J., Eisner, J. S., Gandhi, V. S., Musick, N., Zhang, A., Long, K. L. P., Perloff, O. S., Hu, K. Y., Pham, C. M., Lalchandani, P., et al. (2022) · iScience · doi:10.1016/j.isci.2022.104412 · Cited by 26
Frankiensztajn, L. M., Gur-Pollack, R., & Wagner, S. (2018) · Psychoneuroendocrinology · doi:10.1016/j.psyneuen.2018.04.006 · Cited by 28
Carvalho, V. M. A., Nakahara, T. S., Cardozo, L. M., Souza, M. A. A., Camargo, A. P., Trintinalia, G. Z., Ferraz, E., & Papes, F. (2015) · Frontiers in Neuroscience · doi:10.3389/fnins.2015.00283 · Cited by 25
Synaptic Connections of Aromatase Circuits in the Medial Amygdala Are Sex Specific
Billing, A., Correia, M. H., Kelly, D. A., Li, G., & Bergan, J. F. (2020) · eNeuro · doi:10.1523/eneuro.0489-19.2020 · Cited by 28
Self-citationPardo‐Bellver, C., Martínez‐Bellver, S., Martínez‐Garciá, F., Lanuza, E., & Teruel‐Martí, V. (2017) · Scientific Reports · doi:10.1038/s41598-017-10089-4 · Cited by 28
Interconnected neural circuits mediating social reward
Isaac, J., & Murugan, M. (2024) · Trends in Neurosciences · doi:10.1016/j.tins.2024.10.004 · Cited by 26
Independent inhibitory control mechanisms for aggressive motivation and action
Minakuchi, T., Guthman, E. M., Acharya, P., Hinson, J., Fleming, W., Witten, I. B., Oline, S. N., & Falkner, A. L. (2024) · Nature Neuroscience · doi:10.1038/s41593-023-01563-6 · Cited by 25
A neural circuit perspective on brain aromatase
Spool, J. A., Bergan, J. F., & Remage‐Healey, L. (2021) · Frontiers in Neuroendocrinology · doi:10.1016/j.yfrne.2021.100973 · Cited by 28
Self-citationThe Everted Amygdala of Ray-Finned Fish: Zebrafish Makes a Case
Mueller, T. (2022) · Brain Behavior and Evolution · doi:10.1159/000525669 · Cited by 23
Neural circuit mechanisms that govern inter-male attack in mice
Zha, X., & Xu, X. (2021) · Cellular and Molecular Life Sciences · doi:10.1007/s00018-021-03956-x · Cited by 24
Representation of sex-specific social memory in ventral CA1 neurons
Watarai, A., Tao, K., & Okuyama, T. (2025) · Science · doi:10.1126/science.adp3814 · Cited by 25
Development and function of the medial amygdala
Prakash, N., Irqeba, A. A., & Corbin, J. G. (2024) · Trends in Neurosciences · doi:10.1016/j.tins.2024.11.004 · Cited by 22
The microbiome as a modulator of neurological health across the maternal-offspring interface
Orchanian, S. B., & Hsiao, E. Y. (2025) · Journal of Clinical Investigation · doi:10.1172/jci184314 · Cited by 23
Metadata
- Authors
- Bergan, J. F., Ben-Shaul, Y., & Dulac, C.
- Affiliations
- Howard Hughes Medical Institute (US)
- School of Medicine, Department of Medical Neurobiology, The Hebrew University of Jerusalem, Jerusalem, Israel
- Corresponding author
- Dulac, Catherine
- Venue
- eLife
- Publisher
- eLife Sciences Publications, Ltd
- Published
- 2014-06-03
- Volume
- 3
- Pages
- e02743-e02743
- ISSN
- 2050-084X (ISSN-L)
- PMC
- PMC4038839
- OpenAlex
- W2125255891
- Cited by
- 237
- References
- 95
- Citations by year
- 2026: 11 · 2025: 23 · 2024: 16 · 2023: 17 · 2022: 25 · 2021: 33 · 2020: 18 · 2019: 12 · 2018: 24 · 2017: 19 · 2016: 20 · 2015: 15 · 2014: 4
- FWCI
- 11.91
- Type
- journal article
- Language
- en
- Open access
- gold
- doi.org
- Licence
- Locations
- eLife (publishedVersion, cc-by)
- Europe PMC (PubMed Central) (publishedVersion, cc-by)
- PubMed Central (publishedVersion, cc-by)
- PubMed (publishedVersion)
- Digital Access to Scholarship at Harvard (DASH) (Harvard University) (submittedVersion, cc-by)
- DOAJ (DOAJ: Directory of Open Access Journals) (submittedVersion, cc-by-sa)
- Funders
- National Institutes of Health (R01DC009019, R01DC013087, F32 DC10089)
- Howard Hughes Medical Institute (NA)
- Topics
- Life Sciences › Neuroscience › Sensory Systems › Olfactory and Sensory Function Studies
- Life Sciences › Neuroscience › Endocrine and Autonomic Systems › Neuroendocrine regulation and behavior
- Life Sciences › Neuroscience › Cognitive Neuroscience › Memory and Neural Mechanisms
- Keywords
- medial amygdala, vomeronasal system, accessory olfactory bulb, sex differences, social cue processing, species recognition, predator avoidance, steroid hormone signaling, puberty, olfactory processing, mice
- MeSH terms
- Amygdala, Animals, Cues, Female, Hormones, Male, Mice, Inbred BALB C, Neurons, Odorants, Olfactory Bulb, Olfactory Mucosa, Sexual Behavior, Animal, Sex Factors, Vomeronasal Organ, Mice
About these checks
Registry, retraction, Cites and statistics results are computed, not judged, with one exception: a printed reference that no index lists is read once by a model before it counts as a citation error. Claims are extracted by a model and kept only when their quote appears verbatim in the text; each cited source is then checked, with a model’s help, for whether it says what the claim relies on. Those verdicts can be wrong — read the claim’s quote and the cited source before relying on one.
Statistics and arithmetic are recomputed, not judged.
Confidence bands are shown only for fields calibrated on our annotated test set. None is calibrated yet, so no band is shown.
What counts as a claim ›How we measure confidence ›How we check this ›
Are you an author, or do you see a problem with this page? Request a review
