Cited by 183

The DOI matches its Crossref record; 16 of the 16 references it cites were found in a registry or an index.

Control of TSC2-Rheb signaling axis by arginine regulates mTORC1 activity

Carroll, Bernadette, Maetzel, Dorothea, Maddocks, Oliver DK, Otten, Gisela, Ratcliff, Matthew, Smith, Graham R, Dunlop, Elaine A, Passos, João F, Davies, Owen R, Jaenisch, Rudolf, Tee, Andrew R, Sarkar, Sovan, Korolchuk, Viktor I·2016·eLife

Abstract

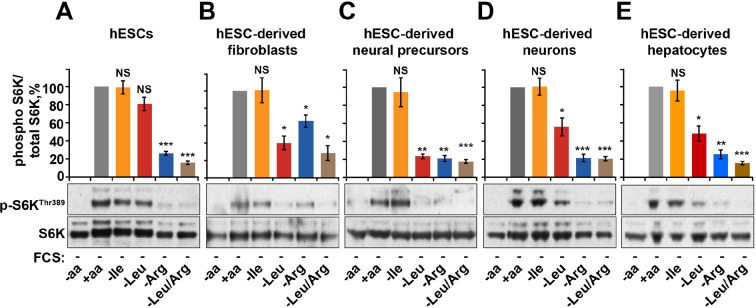
The mammalian target of rapamycin complex 1 (mTORC1) is the key signaling hub that regulates cellular protein homeostasis, growth, and proliferation in health and disease. As a prerequisite for activation of mTORC1 by hormones and mitogens, there first has to be an available pool of intracellular amino acids. Arginine, an amino acid essential during mammalian embryogenesis and early development is one of the key activators of mTORC1. Herein, we demonstrate that arginine acts independently of its metabolism to allow maximal activation of mTORC1 by growth factors via a mechanism that does not involve regulation of mTORC1 localization to lysosomes. Instead, arginine specifically suppresses lysosomal localization of the TSC complex and interaction with its target small GTPase protein, Rheb. By interfering with TSC-Rheb complex, arginine relieves allosteric inhibition of Rheb by TSC. Arginine cooperates with growth factor signaling which further promotes dissociation of TSC2 from lysosomes and activation of mTORC1. Arginine is the main amino acid sensed by the mTORC1 pathway in several cell types including human embryonic stem cells (hESCs). Dependence on arginine is maintained once hESCs are differentiated to fibroblasts, neurons, and hepatocytes, highlighting the fundamental importance of arginine-sensing to mTORC1 signaling. Together, our data provide evidence that different growth promoting cues cooperate to a greater extent than previously recognized to achieve tight spatial and temporal regulation of mTORC1 signaling.

Overview

The claims and statistics of this paper haven’t been checked yet.

Run the check — free, no account needed. It reads the open-access text and checks the sources it cites.

A few free checks a day · papers already verified open instantly · results are public

Integrity signals

Registry

Crossref · 10.7554/elife.11058

Cites

16 of 16 references verified0 citation errors · 0 not checkable

Statistics

Figures

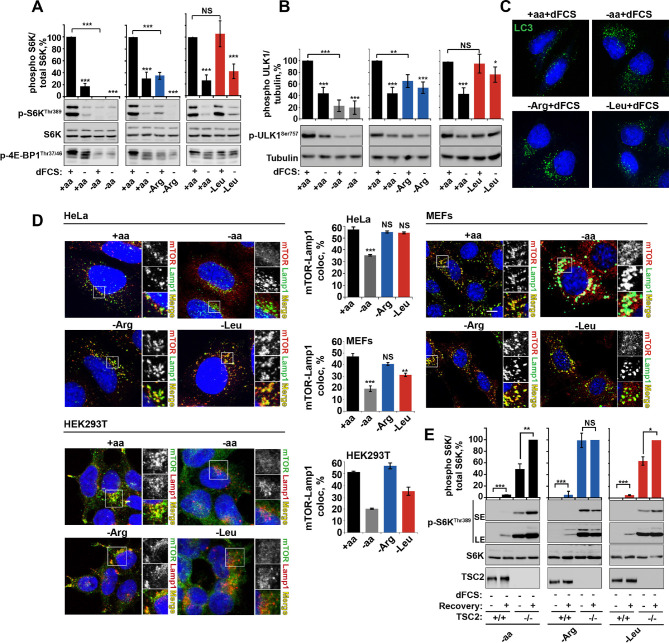
Figure 1. Arginine is a permissive factor for growth factor-dependent mTORC1 activity and acts via TSC2-Rheb axis. (A) Deprivation of arginine perturbs growth factor-mediated activation of mTORC1. HeLa cells were incubated with different amino acid mixtures in the presence/absence of dialyzed fetal calf serum (dFCS) as indicated. Lysates were subjected to immunoblotting for phosphorylation of S6K or 4E-BP1. (B, C) Arginine starvation activates autophagy. HeLa cells were treated as in A (for C also in the presence of chloroquine for 4 hr to block degradation of autophagosomes). Cells were immunoblotted for phosphorylation of ULK1 (B) or fixed and immunostained with antibodies against LC3 to detect autophagosomes (C). Scale bars: 10 μm. Nuclei are visualized in images with TO-PRO-3 iodide. (D) Arginine deprivation inhibits mTORC1 without causing its redistribution from lysosomal membranes to the cytoplasm. HeLa cells, MEFs, and HEK293T cells were incubated in the presence of amino acid mixtures as indicated. Cells were immunostained with antibodies against mTOR and Lysosomal-associated membrane protein 1 (Lamp1). Percentage co-localization between Lamp1 and mTOR was determined. (E) Loss of TSC2 renders mTORC1 insensitive to arginine deprivation. TSC2+/+ and TSC2-/- MEFs were subjected to amino acid, arginine or leucine starvation. Where indicated, recovery was carried out by the re-addition of amino acids, arginine or leucine. Lysates were assessed for phosphorylation of S6K by immunoblotting. SE: short exposure; LE: long exposure. All graphs represent an average of at least three independent experiments (except mTOR localization in HEK293T cells which was carried out twice) and, where necessary, normalized to control treatment. Error bars represent s.e.m. *p<0.05, **p<0.01, ***p<0.005. NS, not significant; Arg, arginine; Leu, leucine; aa, amino acids (complete set); dFCS, dialyzed FCS; MEF: mouse embryonic fibroblast.
Figure 1. Arginine is a permissive factor for growth factor-dependent mTORC1 activity and acts via TSC2-Rheb axis. (A) Deprivation of arginine perturbs growth factor-mediated activation of mTORC1. HeLa cells were incubated with different amino acid mixtures in the presence/absence of dialyzed fetal calf serum (dFCS) as indicated. Lysates were subjected to immunoblotting for phosphorylation of S6K or 4E-BP1. (B, C) Arginine starvation activates autophagy. HeLa cells were treated as in A (for C also in the presence of chloroquine for 4 hr to block degradation of autophagosomes). Cells were immunoblotted for phosphorylation of ULK1 (B) or fixed and immunostained with antibodies against LC3 to detect autophagosomes (C). Scale bars: 10 μm. Nuclei are visualized in images with TO-PRO-3 iodide. (D) Arginine deprivation inhibits mTORC1 without causing its redistribution from lysosomal membranes to the cytoplasm. HeLa cells, MEFs, and HEK293T cells were incubated in the presence of amino acid mixtures as indicated. Cells were immunostained with antibodies against mTOR and Lysosomal-associated membrane protein 1 (Lamp1). Percentage co-localization between Lamp1 and mTOR was determined. (E) Loss of TSC2 renders mTORC1 insensitive to arginine deprivation. TSC2+/+ and TSC2-/- MEFs were subjected to amino acid, arginine or leucine starvation. Where indicated, recovery was carried out by the re-addition of amino acids, arginine or leucine. Lysates were assessed for phosphorylation of S6K by immunoblotting. SE: short exposure; LE: long exposure. All graphs represent an average of at least three independent experiments (except mTOR localization in HEK293T cells which was carried out twice) and, where necessary, normalized to control treatment. Error bars represent s.e.m. *p<0.05, **p<0.01, ***p<0.005. NS, not significant; Arg, arginine; Leu, leucine; aa, amino acids (complete set); dFCS, dialyzed FCS; MEF: mouse embryonic fibroblast.CC BY · PubMed Central
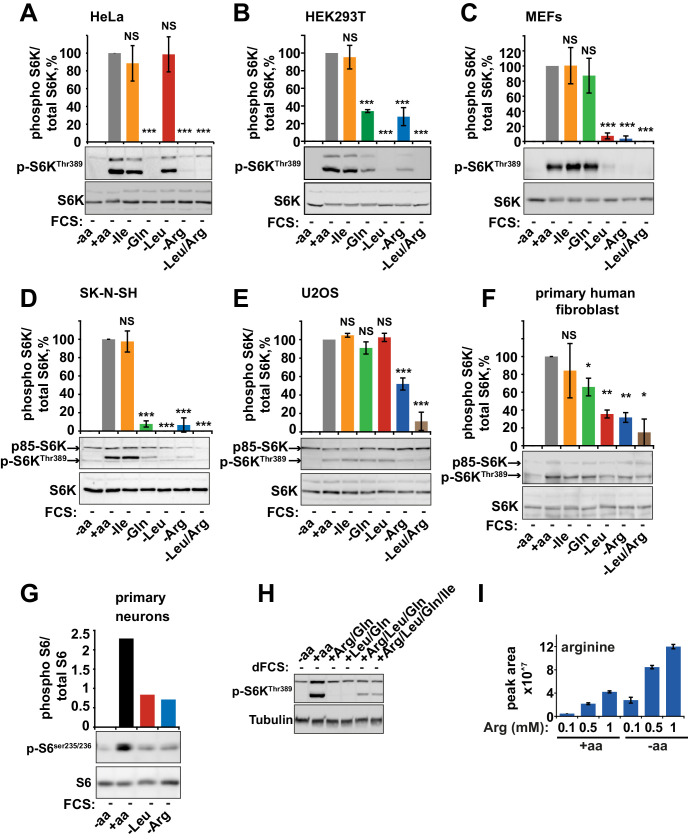
Figure 1—figure supplement 1. Arginine and leucine are important mediators of mTORC1 activity in a wide range of cells. HeLa (A), HEK293T (B), MEFs (C), SK-N-SH (D), U20S (E), primary human fibroblasts (MRC5, F), and primary mouse neurons (G) were starved of individual amino acids as indicated. Cell lysates were analyzed for phosphorylation of S6K and/or S6. (H) HeLa cells were incubated with amino acid mixtures as indicated. Cells lysates were analyzed by western blot for phosphorylation of S6K. (I) HeLa cells were cultured with the indicated concentrations of arginine either in the presence or absence of a complete set of amino acids. Cells were harvested and subjected to LC-MS to measure intracellular levels of arginine. All graphs with statistics represent an average of at least three independent experiments and error bars represent s.e.m. Graphs not displaying error bars are an average of at least two technical repeats. *p<0.05, **p<0.01, ***p<0.005. MEFs, mouse embryonic fibroblasts.
Figure 1—figure supplement 1. Arginine and leucine are important mediators of mTORC1 activity in a wide range of cells. HeLa (A), HEK293T (B), MEFs (C), SK-N-SH (D), U20S (E), primary human fibroblasts (MRC5, F), and primary mouse neurons (G) were starved of individual amino acids as indicated. Cell lysates were analyzed for phosphorylation of S6K and/or S6. (H) HeLa cells were incubated with amino acid mixtures as indicated. Cells lysates were analyzed by western blot for phosphorylation of S6K. (I) HeLa cells were cultured with the indicated concentrations of arginine either in the presence or absence of a complete set of amino acids. Cells were harvested and subjected to LC-MS to measure intracellular levels of arginine. All graphs with statistics represent an average of at least three independent experiments and error bars represent s.e.m. Graphs not displaying error bars are an average of at least two technical repeats. *p<0.05, **p<0.01, ***p<0.005. MEFs, mouse embryonic fibroblasts.CC BY · PubMed Central
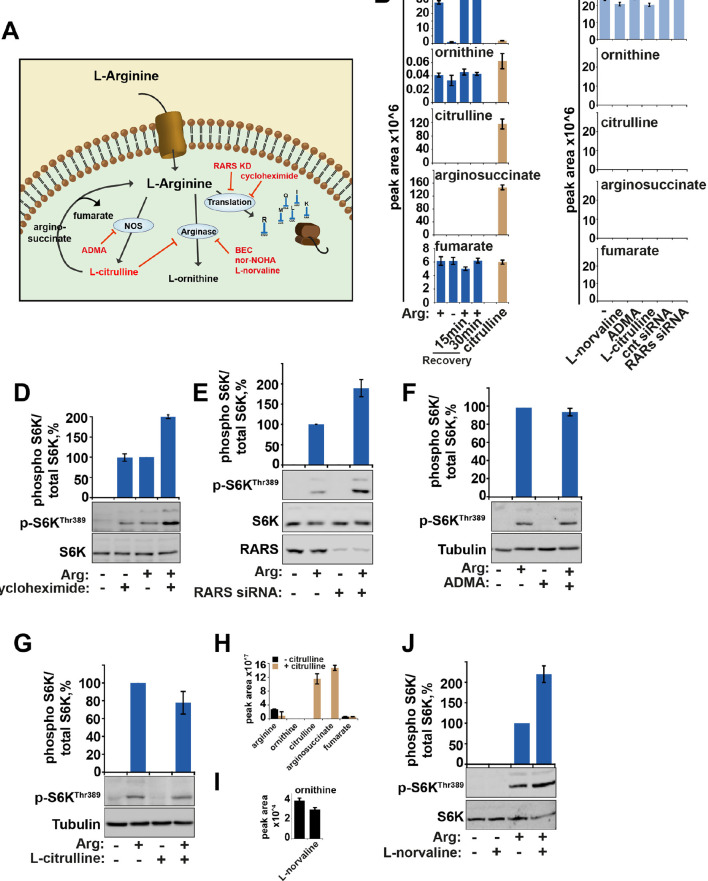
Figure 1—figure supplement 2. The metabolism of arginine does not contribute to the activation of mTORC1. (A) Diagram showing the key pathways via which arginine is metabolized. (B) HeLa cells were subjected to arginine starvation followed by re-addition of arginine as indicated. Cells were lysed and subject to LC-MS to analyze the intracellular levels of arginine and its metabolites, ornithine, citrulline, arginosuccinate and fumarate. No metabolites were significantly affected by starvation and recovery of arginine. (C) HeLa cells were incubated with labeled arginine (13C6, 15N4) for 2 hr either in the presence or absence of compounds as indicated (L-norvaline, ADMA ,and L-citrulline). Cells were treated with siRNA against arginyl-tRNA synthetase for 96 hr prior to incubation with labeled arginine. Graphs indicate that negligible amounts of arginine are converted to these metabolites during the 2-hr period studied here suggesting that metabolism of arginine in these cells is slow. (D) HeLa cells were starved of arginine in the presence or absence of cycloheximide for 2 hr. Cell lysates were immunoblotted for phosphorylation of S6K. (E) HeLa cells transfected with control or arginyl-tRNA synthetase (RARS) siRNA for 96 hr were starved of arginine as indicated. Cell lysates were immunoblotted for phosphorylation of S6K. Note that both knockdown of RARS which would increase concentrations of free arginine and cycloheximide treatment which would increase concentration of intracellular amino acids by preventing their incorporation into newly synthesized proteins, increased mTOR activity, suggesting that preventing the use of arginine during protein translation promotes activation of mTORC1. (F) Inhibition of nitric oxide synthase (NOS) by ADMA did not impair the ability of arginine to rescue starvation-induced mTOR inactivation suggesting this pathway is not required for arginine-dependent regulation of mTORC1 activity. (G–J) Treatment with arginase inhibitors (L-citrulline (G) and L-norvaline (J)) (El-Bassossy et al., 2013; Hunter and Downs, 1945) for 2 hr did not suppress activation of mTORC1 by arginine suggesting that metabolism of arginine to L-ornithine is not required for its effect on mTORC1 pathway. Note that exogenous L-citrulline, supplemented to the cells can be efficiently metabolised into arginosuccinate (H) and that in the presence of L-norvaline, intracellular levels of ornithine are decreased (I). Moreover, L-norvaline increased mTORC1 signaling, supporting the idea that by preventing arginine metabolism and increasing its levels one can enhance activity of mTORC1. These data together suggest that arginine molecules themselves participate in mTORC1 regulation as treatments that cause an increase in intracellular arginine concentration (e.g. by suppression of protein translation and inhibition of arginase) lead to increased mTORC1 activity, while arginine metabolism is not required for mTORC1. Graphs represent average of two independent experiments and error bars represent standard deviation.
Figure 1—figure supplement 2. The metabolism of arginine does not contribute to the activation of mTORC1. (A) Diagram showing the key pathways via which arginine is metabolized. (B) HeLa cells were subjected to arginine starvation followed by re-addition of arginine as indicated. Cells were lysed and subject to LC-MS to analyze the intracellular levels of arginine and its metabolites, ornithine, citrulline, arginosuccinate and fumarate. No metabolites were significantly affected by starvation and recovery of arginine. (C) HeLa cells were incubated with labeled arginine (13C6, 15N4) for 2 hr either in the presence or absence of compounds as indicated (L-norvaline, ADMA ,and L-citrulline). Cells were treated with siRNA against arginyl-tRNA synthetase for 96 hr prior to incubation with labeled arginine. Graphs indicate that negligible amounts of arginine are converted to these metabolites during the 2-hr period studied here suggesting that metabolism of arginine in these cells is slow. (D) HeLa cells were starved of arginine in the presence or absence of cycloheximide for 2 hr. Cell lysates were immunoblotted for phosphorylation of S6K. (E) HeLa cells transfected with control or arginyl-tRNA synthetase (RARS) siRNA for 96 hr were starved of arginine as indicated. Cell lysates were immunoblotted for phosphorylation of S6K. Note that both knockdown of RARS which would increase concentrations of free arginine and cycloheximide treatment which would increase concentration of intracellular amino acids by preventing their incorporation into newly synthesized proteins, increased mTOR activity, suggesting that preventing the use of arginine during protein translation promotes activation of mTORC1. (F) Inhibition of nitric oxide synthase (NOS) by ADMA did not impair the ability of arginine to rescue starvation-induced mTOR inactivation suggesting this pathway is not required for arginine-dependent regulation of mTORC1 activity. (G–J) Treatment with arginase inhibitors (L-citrulline (G) and L-norvaline (J)) (El-Bassossy et al., 2013; Hunter and Downs, 1945) for 2 hr did not suppress activation of mTORC1 by arginine suggesting that metabolism of arginine to L-ornithine is not required for its effect on mTORC1 pathway. Note that exogenous L-citrulline, supplemented to the cells can be efficiently metabolised into arginosuccinate (H) and that in the presence of L-norvaline, intracellular levels of ornithine are decreased (I). Moreover, L-norvaline increased mTORC1 signaling, supporting the idea that by preventing arginine metabolism and increasing its levels one can enhance activity of mTORC1. These data together suggest that arginine molecules themselves participate in mTORC1 regulation as treatments that cause an increase in intracellular arginine concentration (e.g. by suppression of protein translation and inhibition of arginase) lead to increased mTORC1 activity, while arginine metabolism is not required for mTORC1. Graphs represent average of two independent experiments and error bars represent standard deviation.CC BY · PubMed Central
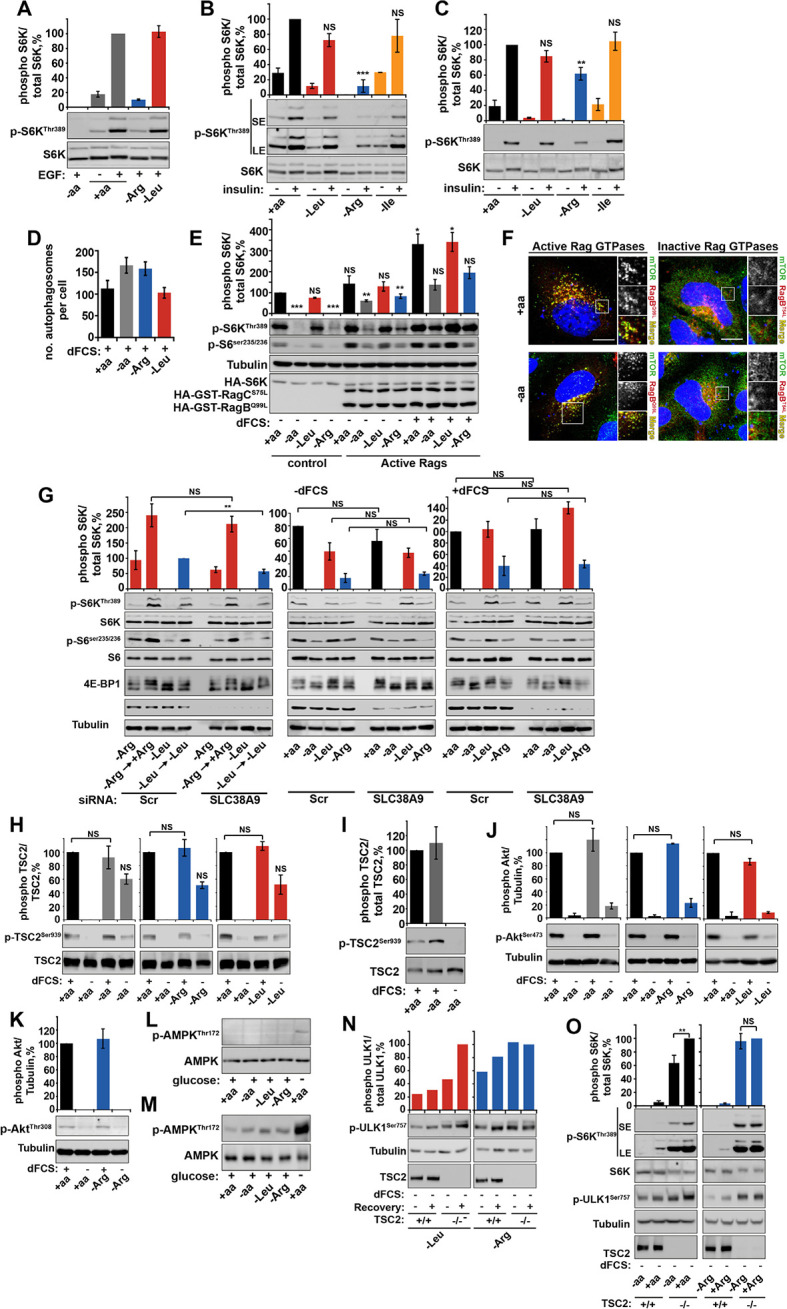
Figure 1—figure supplement 3. Arginine contributes to mTORC1 activity via TSC2/Rheb signaling axis. (A–C) Arginine deprivation specifically perturbs growth factor-mediated mTORC1 activity. HeLa cells (A, B) and wild-type MEFs (C) were incubated with either a complete amino acid mixture or starved of individual amino acids as indicated, in the presence or absence of EGF (100 ng/ml) (A) or insulin (10 μg/ml) (B, C). Lysates were subjected to immunoblotting for phosphorylation of S6K. (D) Arginine starvation activates autophagy. HeLa cells were pre-treated with chloroquine for 3 hr prior to being starved of the indicated amino acid (in the presence of dFCS) for 1 hr. Cells were fixed and stained with antibodies against LC3. The number of autophagosomes per cell was quantified. (E–G) Perturbation of growth factor signaling by arginine starvation is not dependent on SLC38A9/Rag GTPase protein complexes. HeLa cells were transfected with constitutive active heterodimer of RagB (Q99L), RagC (S75L), and HA-tagged S6K and deprived of amino acids as indicated, either in the presence or in the absence of dFCS. Lysates were analyzed by immunoblot for phosphorylation of S6K (E). (F) HeLa cells were transfected with active or inactive Rag GTPases and incubated in the presence or absence of amino acids. Cells were fixed and stained with antibodies against mTOR and V5 or HA-tagged Rag GTPases to confirm their localization and effect on mTOR localization. (G) HeLa cells were subjected to siRNA against SLC38A9 (100 nM) or scramble control (Scr) for 96 hr. Cells were then analyzed for mTORC1 activity in cells; first, cells were starved and recovered with either arginine or leucine or starved either in the presence or absence of dFCS. Cell lysates were analyzed for phospho-S6K, phospho-S6 and 4E-BP1 and SLC38A9. HeLa cells (H) and wild-type MEFs (I) were incubated with amino acid and dFCS mixtures as indicated. Lysates were analyzed for phosphorylation of TSC2 at serine 939. Of note, there is some increased phosphorylation in cells completely starved of amino acids, arginine and leucine. It has been noted previously that amino acid deprivation can contribute to feed-back mechanisms that involve IRS1 and re-activation of Akt (see review [Manning, 2004]). As there was no specificity to arginine starvation, this observation was not explored further. HeLa cells (J, K) were incubated with amino acid and dFCS mixtures as indicated. Lysates were analyzed for phosphorylation of Akt at serine 473 (J) or threonine 308 (K). HeLa cells (L) and wild-type MEFs (M) were incubated with amino acid and dFCS mixtures as indicated. Lysates were analyzed for phosphorylation of AMPK. As a positive control, cells were starved of glucose. (N, O) Loss of TSC2 renders mTORC1 insensitive to arginine deprivation. TSC2+/+ and TSC2-/- MEFs were subjected to leucine or arginine starvation. Where indicated, recovery was carried out by the re-addition of arginine or leucine. Lysates were assessed for phosphorylation of ULK1 by immunoblotting (N). Alternatively, TSC2+/+ and TSC2-/- MEFs were subjected to amino acid or arginine starvation. Lysates were analyzed for phosphorylation of S6K and ULK1 (O). Scale bars: 10 μm. Nuclei are visualized in merge images with TO-PRO-3 iodide. All graphs with statistics represent an average of at least three independent experiments and error bars represent s.e.m. Graphs not displaying statistics represent an average of two independent experiments and error bars represent standard deviation. *p<0.05, **p<0.01, ***p<0.005. SE: short exposure; LE: long exposure; NS: not significant.
Figure 1—figure supplement 3. Arginine contributes to mTORC1 activity via TSC2/Rheb signaling axis. (A–C) Arginine deprivation specifically perturbs growth factor-mediated mTORC1 activity. HeLa cells (A, B) and wild-type MEFs (C) were incubated with either a complete amino acid mixture or starved of individual amino acids as indicated, in the presence or absence of EGF (100 ng/ml) (A) or insulin (10 μg/ml) (B, C). Lysates were subjected to immunoblotting for phosphorylation of S6K. (D) Arginine starvation activates autophagy. HeLa cells were pre-treated with chloroquine for 3 hr prior to being starved of the indicated amino acid (in the presence of dFCS) for 1 hr. Cells were fixed and stained with antibodies against LC3. The number of autophagosomes per cell was quantified. (E–G) Perturbation of growth factor signaling by arginine starvation is not dependent on SLC38A9/Rag GTPase protein complexes. HeLa cells were transfected with constitutive active heterodimer of RagB (Q99L), RagC (S75L), and HA-tagged S6K and deprived of amino acids as indicated, either in the presence or in the absence of dFCS. Lysates were analyzed by immunoblot for phosphorylation of S6K (E). (F) HeLa cells were transfected with active or inactive Rag GTPases and incubated in the presence or absence of amino acids. Cells were fixed and stained with antibodies against mTOR and V5 or HA-tagged Rag GTPases to confirm their localization and effect on mTOR localization. (G) HeLa cells were subjected to siRNA against SLC38A9 (100 nM) or scramble control (Scr) for 96 hr. Cells were then analyzed for mTORC1 activity in cells; first, cells were starved and recovered with either arginine or leucine or starved either in the presence or absence of dFCS. Cell lysates were analyzed for phospho-S6K, phospho-S6 and 4E-BP1 and SLC38A9. HeLa cells (H) and wild-type MEFs (I) were incubated with amino acid and dFCS mixtures as indicated. Lysates were analyzed for phosphorylation of TSC2 at serine 939. Of note, there is some increased phosphorylation in cells completely starved of amino acids, arginine and leucine. It has been noted previously that amino acid deprivation can contribute to feed-back mechanisms that involve IRS1 and re-activation of Akt (see review [Manning, 2004]). As there was no specificity to arginine starvation, this observation was not explored further. HeLa cells (J, K) were incubated with amino acid and dFCS mixtures as indicated. Lysates were analyzed for phosphorylation of Akt at serine 473 (J) or threonine 308 (K). HeLa cells (L) and wild-type MEFs (M) were incubated with amino acid and dFCS mixtures as indicated. Lysates were analyzed for phosphorylation of AMPK. As a positive control, cells were starved of glucose. (N, O) Loss of TSC2 renders mTORC1 insensitive to arginine deprivation. TSC2+/+ and TSC2-/- MEFs were subjected to leucine or arginine starvation. Where indicated, recovery was carried out by the re-addition of arginine or leucine. Lysates were assessed for phosphorylation of ULK1 by immunoblotting (N). Alternatively, TSC2+/+ and TSC2-/- MEFs were subjected to amino acid or arginine starvation. Lysates were analyzed for phosphorylation of S6K and ULK1 (O). Scale bars: 10 μm. Nuclei are visualized in merge images with TO-PRO-3 iodide. All graphs with statistics represent an average of at least three independent experiments and error bars represent s.e.m. Graphs not displaying statistics represent an average of two independent experiments and error bars represent standard deviation. *p<0.05, **p<0.01, ***p<0.005. SE: short exposure; LE: long exposure; NS: not significant.CC BY · PubMed Central
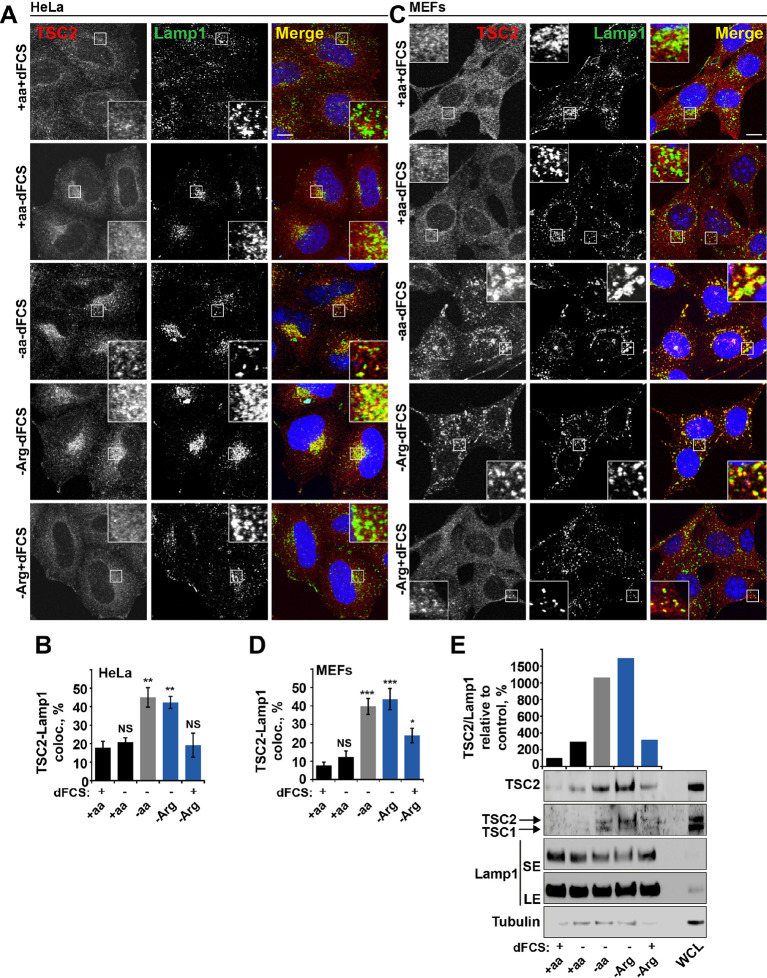
Figure 2. Arginine regulates TSC2 localization to the lysosome. (A–E) Starvation of arginine and growth factors cooperate to promote recruitment of TSC2 to lysosomes. HeLa cells (A, B) and MEFs (C, D) were subjected to different starvation protocols; full nutrient medium (+aa+dFCS), serum starvation (+aa-dFCS), arginine starvation (-Arg+dFCS), or starvation of serum and arginine (-Arg-dFCS). Cells were immunostained with antibodies against TSC2 and Lamp1 (A, C) and percentage co-localization between Lamp1 and TSC2 was determined (B, D). Scale bars: 10 μm. Nuclei are visualized in images with TO-PRO-3 iodide. (E) HeLa cells were subjected to different starvation protocols as indicated for 1 hr prior to harvesting. Lysosomes were isolated and equal amounts of protein in whole cell lysates (WCL) and lysosomal fractions were analyzed by immunoblotting for TSC2, TSC1, Lamp1 and Tubulin. SE: short exposure; LE: long exposure. All graphs represent an average of at least three independent experiments and error bars represent s.e.m. *p<0.05, **p<0.01, ***p<0.005.
Figure 2. Arginine regulates TSC2 localization to the lysosome. (A–E) Starvation of arginine and growth factors cooperate to promote recruitment of TSC2 to lysosomes. HeLa cells (A, B) and MEFs (C, D) were subjected to different starvation protocols; full nutrient medium (+aa+dFCS), serum starvation (+aa-dFCS), arginine starvation (-Arg+dFCS), or starvation of serum and arginine (-Arg-dFCS). Cells were immunostained with antibodies against TSC2 and Lamp1 (A, C) and percentage co-localization between Lamp1 and TSC2 was determined (B, D). Scale bars: 10 μm. Nuclei are visualized in images with TO-PRO-3 iodide. (E) HeLa cells were subjected to different starvation protocols as indicated for 1 hr prior to harvesting. Lysosomes were isolated and equal amounts of protein in whole cell lysates (WCL) and lysosomal fractions were analyzed by immunoblotting for TSC2, TSC1, Lamp1 and Tubulin. SE: short exposure; LE: long exposure. All graphs represent an average of at least three independent experiments and error bars represent s.e.m. *p<0.05, **p<0.01, ***p<0.005.CC BY · PubMed Central
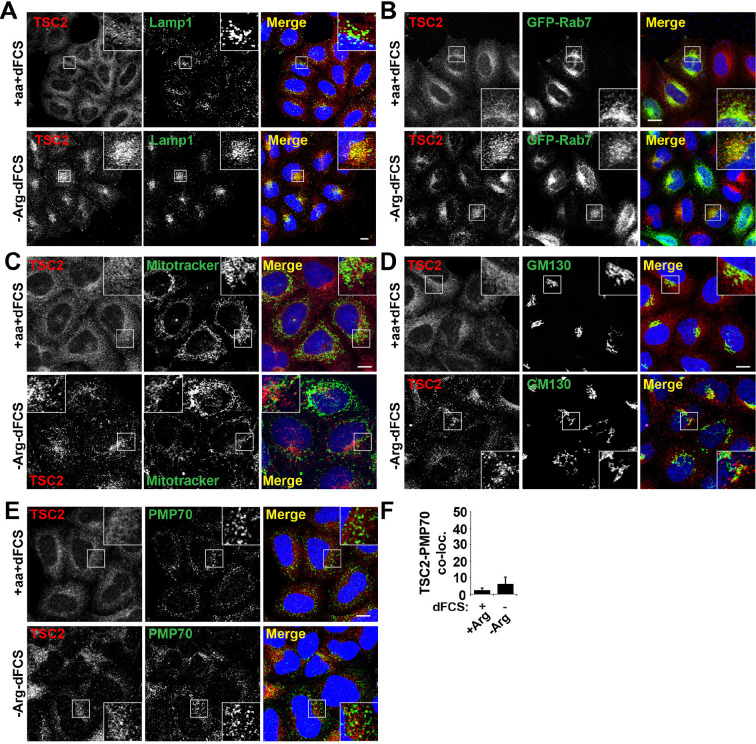
Figure 2—figure supplement 1. TSC2 specifically localizes to late endosomal/lysosomal compartments during starvation. (A) HeLa cells were maintained in full nutrient medium (+aa+dFCS) or subjected to serum and arginine starvation (-Arg-dFCS). Cells were fixed and immunostained with antibodies against TSC2 and Lamp1. Images were collected at a lower magnification than those in Figure 2. (B) HeLa cells were transfected with GFP-Rab7 overnight to visualize late endosomal compartments. Cells were treated as in (A) and immunostained with an antibody against TSC2. (C) HeLa cells were incubated with MitoTracker green overnight followed by treatment as in (A). Cells were fixed and stained with antibodies against TSC2. (D–E) HeLa cells were treated as in (A), fixed and immunostained with antibodies against the Golgi marker, GM130 (D) and the peroxisome marker, PMP70 (E) and TSC2. Co-localization of PMP70 and TSC2 was quantified (F) Scale bars: 10 μm. Nuclei are visualized in merge images with TO-PRO-3 iodide.
Figure 2—figure supplement 1. TSC2 specifically localizes to late endosomal/lysosomal compartments during starvation. (A) HeLa cells were maintained in full nutrient medium (+aa+dFCS) or subjected to serum and arginine starvation (-Arg-dFCS). Cells were fixed and immunostained with antibodies against TSC2 and Lamp1. Images were collected at a lower magnification than those in Figure 2. (B) HeLa cells were transfected with GFP-Rab7 overnight to visualize late endosomal compartments. Cells were treated as in (A) and immunostained with an antibody against TSC2. (C) HeLa cells were incubated with MitoTracker green overnight followed by treatment as in (A). Cells were fixed and stained with antibodies against TSC2. (D–E) HeLa cells were treated as in (A), fixed and immunostained with antibodies against the Golgi marker, GM130 (D) and the peroxisome marker, PMP70 (E) and TSC2. Co-localization of PMP70 and TSC2 was quantified (F) Scale bars: 10 μm. Nuclei are visualized in merge images with TO-PRO-3 iodide.CC BY · PubMed Central
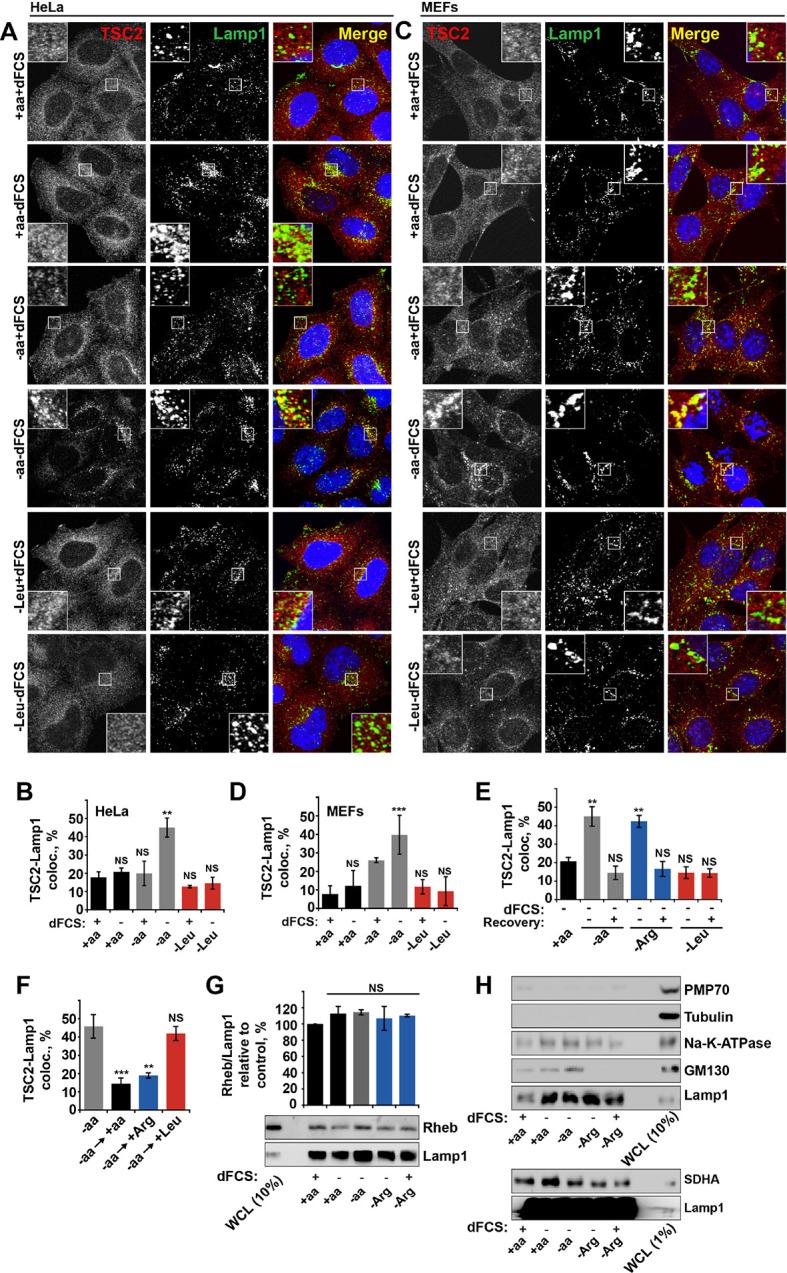
Figure 2—figure supplement 2. Arginine specifically regulates TSC2 localization to the lysosome. HeLa (A, B) and MEF (C, D) cells were starved of all amino acids or leucine in the presence or absence of dialyzed serum (dFCS) where indicated. Cells were fixed and immunostained with antibodies against TSC2 and Lamp1 (A, C). The percentage of co-localization between TSC2 and Lamp1 was quantified (B, D). (E) HeLa cells were starved of serum and all amino acids, arginine or leucine, followed, where stated, by recovery of amino acids. Cells were immunostained for TSC2 and Lamp1 and the percentage co-localization was determined. (F) HeLa cells were completely starved of amino acids followed by recovery with individual amino acids as indicated. Cells were fixed and stained for TSC2 and Lamp1 and the percentage ofTSC2-Lamp1 co-localization was quantified. (G–H) Rheb is a constitutive component of lysosomal membranes. HeLa cells were subjected to different starvation protocols as indicated prior to harvesting. Lysosomes were isolated and equal amounts of protein were analyzed by immunoblotting. Rheb detected in lysosomal preps was normalized to Lamp1 content (G). To check efficiency of lysosomal enrichment, immunoblotting was carried out for PMP70 (peroxisome marker), tubulin (cytoplasmic protein), GM130 (Golgi marker), SDHA (mitochondrial marker), and N+-K+-ATPase (as a marker for the plasma membrane) (H). Scale bars: 10 μm. Nuclei are visualized in merge images with TO-PRO-3 iodide. All graphs with statistics represent an average of at least three independent experiments and error bars represent s.e.m except D where error bars represent s.d. *p<0.05, **p<0.01, ***p<0.005. NS: not significant.; WCL: whole-cell lysate.
Figure 2—figure supplement 2. Arginine specifically regulates TSC2 localization to the lysosome. HeLa (A, B) and MEF (C, D) cells were starved of all amino acids or leucine in the presence or absence of dialyzed serum (dFCS) where indicated. Cells were fixed and immunostained with antibodies against TSC2 and Lamp1 (A, C). The percentage of co-localization between TSC2 and Lamp1 was quantified (B, D). (E) HeLa cells were starved of serum and all amino acids, arginine or leucine, followed, where stated, by recovery of amino acids. Cells were immunostained for TSC2 and Lamp1 and the percentage co-localization was determined. (F) HeLa cells were completely starved of amino acids followed by recovery with individual amino acids as indicated. Cells were fixed and stained for TSC2 and Lamp1 and the percentage ofTSC2-Lamp1 co-localization was quantified. (G–H) Rheb is a constitutive component of lysosomal membranes. HeLa cells were subjected to different starvation protocols as indicated prior to harvesting. Lysosomes were isolated and equal amounts of protein were analyzed by immunoblotting. Rheb detected in lysosomal preps was normalized to Lamp1 content (G). To check efficiency of lysosomal enrichment, immunoblotting was carried out for PMP70 (peroxisome marker), tubulin (cytoplasmic protein), GM130 (Golgi marker), SDHA (mitochondrial marker), and N+-K+-ATPase (as a marker for the plasma membrane) (H). Scale bars: 10 μm. Nuclei are visualized in merge images with TO-PRO-3 iodide. All graphs with statistics represent an average of at least three independent experiments and error bars represent s.e.m except D where error bars represent s.d. *p<0.05, **p<0.01, ***p<0.005. NS: not significant.; WCL: whole-cell lysate.CC BY · PubMed Central
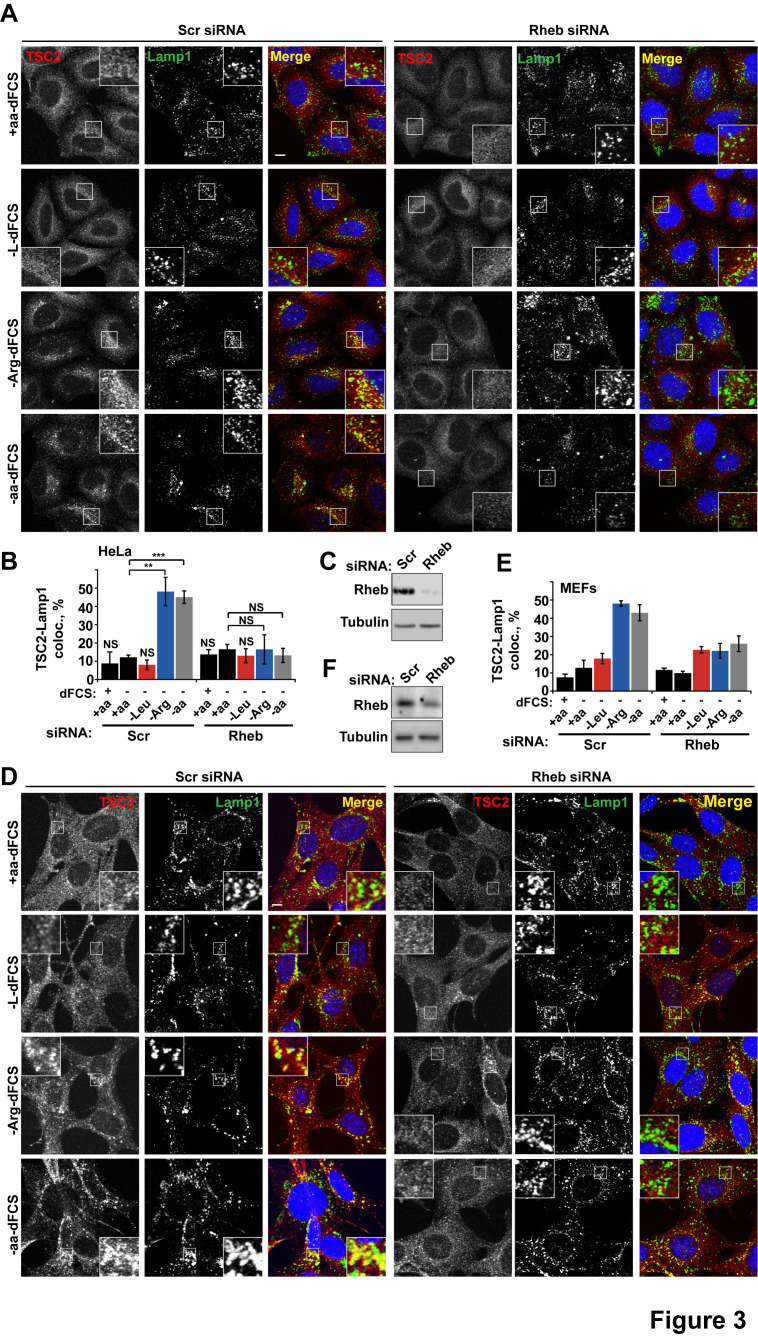
Figure 3. Rheb is required for the amino acid-dependent recruitment of TSC2 to lysosomal membranes. HeLa cells (A–C) and MEFs (D–F) were treated with scramble (Scr) or Rheb siRNA for 96 hr and subjected to different starvation protocols as indicated. Cells were fixed and immunostained with antibodies against TSC2 and Lamp1 (A, D). The percentage co-localization between Lamp1 and TSC2 was determined (B, E) and Rheb protein knock-down was assessed by immunoblot (C, F). Scale bars: 10 μm. Nuclei are visualized in merge images with TO-PRO-3 iodide. Graph represents an average of at least three independent experiments (B) or two independent experiments (E) and error bars represent s.e.m and s.d., respectively. *p<0.05, **p<0.01, ***p<0.005.
Figure 3. Rheb is required for the amino acid-dependent recruitment of TSC2 to lysosomal membranes. HeLa cells (A–C) and MEFs (D–F) were treated with scramble (Scr) or Rheb siRNA for 96 hr and subjected to different starvation protocols as indicated. Cells were fixed and immunostained with antibodies against TSC2 and Lamp1 (A, D). The percentage co-localization between Lamp1 and TSC2 was determined (B, E) and Rheb protein knock-down was assessed by immunoblot (C, F). Scale bars: 10 μm. Nuclei are visualized in merge images with TO-PRO-3 iodide. Graph represents an average of at least three independent experiments (B) or two independent experiments (E) and error bars represent s.e.m and s.d., respectively. *p<0.05, **p<0.01, ***p<0.005.CC BY · PubMed Central
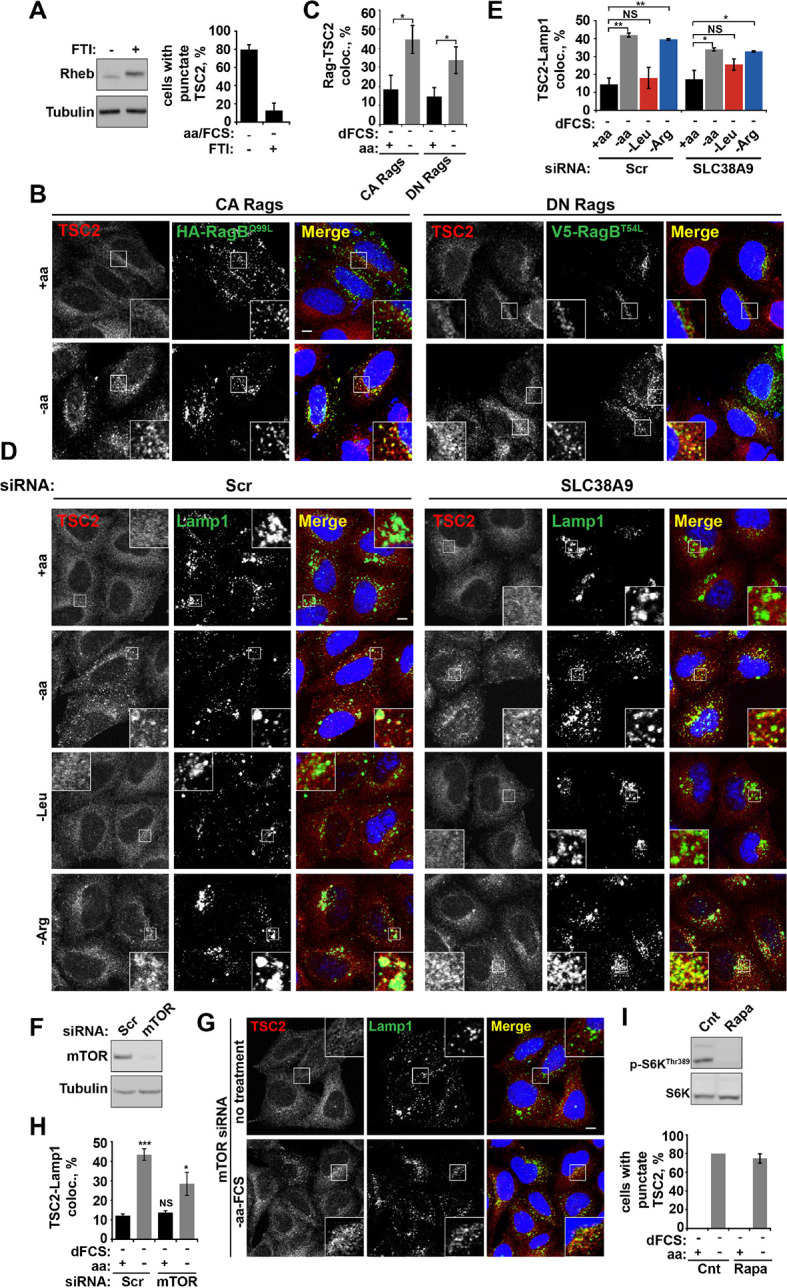
Figure 3—figure supplement 1. Rheb localization at lysosomes participates in TSC2 recruitment to lysosomal membranes during amino acid starvation. (A) Membrane localization of Rheb is required for TSC2 recruitment to lysosomes. HeLa cells were treated with 1 μM FTI (lonafarnib) or DMSO control overnight. Cells were starved of amino acids and FCS in the presence of FTI. Cells were fixed, stained for TSC2 and Lamp1 and the percentage of cells with punctate TSC2 quantified. Alternatively, cells were lysed and immunoblotted for Rheb. Note the characteristic shift in mobility of Rheb treated with FTI. (B–H) Rag GTPases and mTOR partially regulate TSC2 recruitment to lysosomes during starvation. (B, C) HeLa cells were transfected with constitutively active or dominant negative RagB and RagC and incubated in the presence or absence of amino acids. Cells were stained for HA-tagged Rags and TSC2 (B). Co-localization between the lysosomally localized Rag GTPases and TSC2 was quantified (C). HeLa cells were treated with siRNA against SLC38A9 (100 nM) for 96 hr. Cells were starved of serum and amino acids prior to being fixed and immunostained for antibodies against TSC2 and Lamp1 (D) and images were collected and analyzed for the percentage of colocalization between the two proteins (E). (F) HeLa cells were subjected to siRNA of mTOR (100 nM) for 96 hr. Cells were incubated in the presence or absence of amino acids, cells were fixed and immunostained for TSC2 and Lamp1 (G). The percentage of co-localization was quantified (H). (I) mTOR activity is not required for TSC2 recruitment to lysosomes during starvation. HeLa cells were treated in the presence or absence of amino acids and rapamycin (100 nM) as indicated. Cells were fixed and immunostained with antibodies against TSC2 and Lamp1. The percentage of cells with punctate TSC2 was quantified. Scale bars: 10 μm. Nuclei are visualized in merge images with TO-PRO-3 iodide. All graphs with statistics represent an average of at least three independent experiments and error bars represent s.e.m. Graphs not displaying statistics represent an average of two independent experiments and error bars represent s.d. NS: not significant. *p<0.05, **p<0.01, ***p<0.005.
Figure 3—figure supplement 1. Rheb localization at lysosomes participates in TSC2 recruitment to lysosomal membranes during amino acid starvation. (A) Membrane localization of Rheb is required for TSC2 recruitment to lysosomes. HeLa cells were treated with 1 μM FTI (lonafarnib) or DMSO control overnight. Cells were starved of amino acids and FCS in the presence of FTI. Cells were fixed, stained for TSC2 and Lamp1 and the percentage of cells with punctate TSC2 quantified. Alternatively, cells were lysed and immunoblotted for Rheb. Note the characteristic shift in mobility of Rheb treated with FTI. (B–H) Rag GTPases and mTOR partially regulate TSC2 recruitment to lysosomes during starvation. (B, C) HeLa cells were transfected with constitutively active or dominant negative RagB and RagC and incubated in the presence or absence of amino acids. Cells were stained for HA-tagged Rags and TSC2 (B). Co-localization between the lysosomally localized Rag GTPases and TSC2 was quantified (C). HeLa cells were treated with siRNA against SLC38A9 (100 nM) for 96 hr. Cells were starved of serum and amino acids prior to being fixed and immunostained for antibodies against TSC2 and Lamp1 (D) and images were collected and analyzed for the percentage of colocalization between the two proteins (E). (F) HeLa cells were subjected to siRNA of mTOR (100 nM) for 96 hr. Cells were incubated in the presence or absence of amino acids, cells were fixed and immunostained for TSC2 and Lamp1 (G). The percentage of co-localization was quantified (H). (I) mTOR activity is not required for TSC2 recruitment to lysosomes during starvation. HeLa cells were treated in the presence or absence of amino acids and rapamycin (100 nM) as indicated. Cells were fixed and immunostained with antibodies against TSC2 and Lamp1. The percentage of cells with punctate TSC2 was quantified. Scale bars: 10 μm. Nuclei are visualized in merge images with TO-PRO-3 iodide. All graphs with statistics represent an average of at least three independent experiments and error bars represent s.e.m. Graphs not displaying statistics represent an average of two independent experiments and error bars represent s.d. NS: not significant. *p<0.05, **p<0.01, ***p<0.005.CC BY · PubMed Central
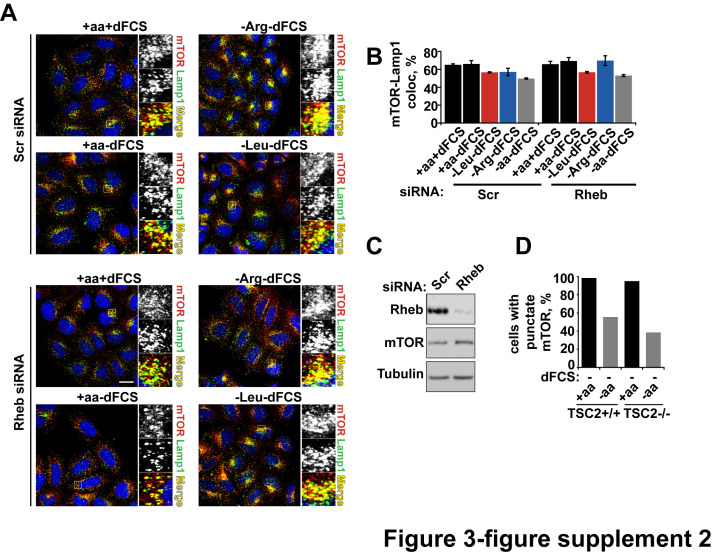
Figure 3—figure supplement 2. Rheb knock-down or hyperactivation does not affect mTOR localization. HeLa cells were treated with scramble control or Rheb siRNA (100 nM) for 96 hr. Cells were subjected to starvation protocols as indicated and fixed. Cells were immunostained with antibodies against mTOR and Lamp1 (A). Co-localization between mTOR and Lamp1 was quantified (B), and immunoblot was used to analyze mTOR protein levels in siRNA-treated cells (C). TSC2+/+ and TSC2-/- MEFs were incubated in the presence or absence of amino acids and the% cells with punctate mTOR was quantified (D).
Figure 3—figure supplement 2. Rheb knock-down or hyperactivation does not affect mTOR localization. HeLa cells were treated with scramble control or Rheb siRNA (100 nM) for 96 hr. Cells were subjected to starvation protocols as indicated and fixed. Cells were immunostained with antibodies against mTOR and Lamp1 (A). Co-localization between mTOR and Lamp1 was quantified (B), and immunoblot was used to analyze mTOR protein levels in siRNA-treated cells (C). TSC2+/+ and TSC2-/- MEFs were incubated in the presence or absence of amino acids and the% cells with punctate mTOR was quantified (D).CC BY · PubMed Central
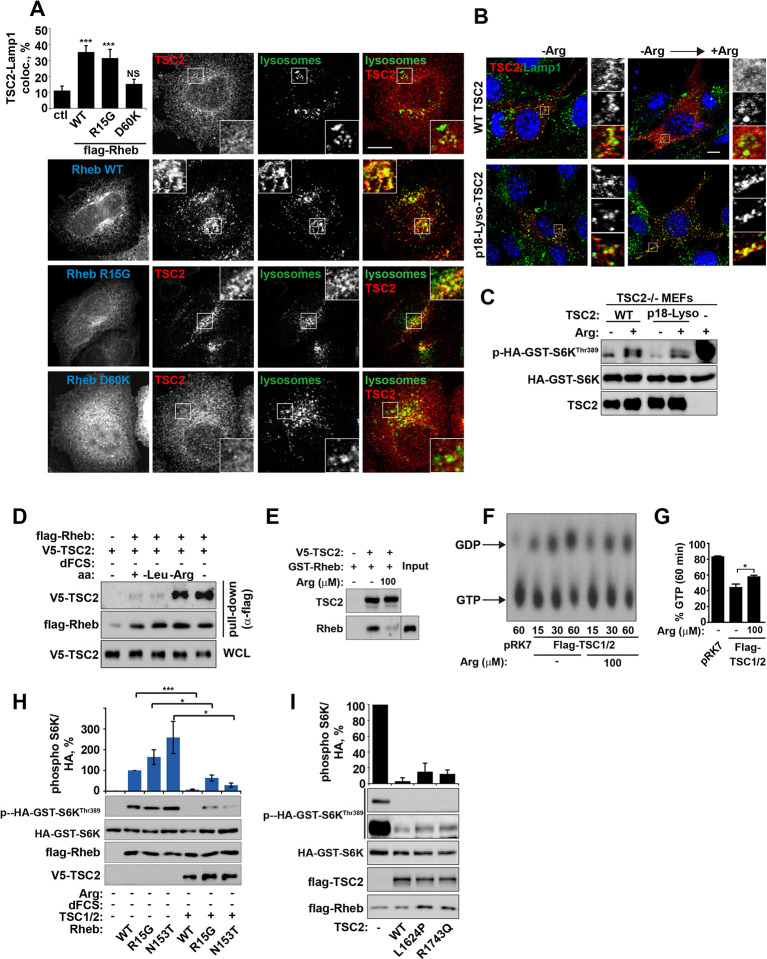
Figure 4. Arginine regulates the ability of TSC2 to bind and inhibit GTP-loaded Rheb independent of its ability to promote GTPase activity. (A) TSC2 recruitment to lysosomes is regulated by nucleotide-loading state of Rheb. HeLa cells were transfected with wild-type (WT), active Rheb (R15G), or inactive Rheb (D60K) overnight in the presence of GFP-lysosome BacMam. Cells were maintained in full nutrient medium, fixed and immunostained with antibodies against TSC2 and Flag-tag. The percentage of cells with lysosomal TSC2 was quantified. (B, C) Arginine suppresses activity of both wild-type and constitutively targeted to lysosomal membrane TSC2. TSC2-/- MEFs were transfected with either WT or p18-TSC2 (and HA-S6K (C)) overnight. Cells were deprived and replenished with arginine and either fixed and immunostained for Lamp1 and TSC2 (B) or subjected to immunoblot analysis of S6K phosphorylation (C). (D) Amino acids, specifically arginine regulate the interaction between Rheb and TSC2. HeLa cells were transfected with wild-type Flag-Rheb overnight, lysed and loaded onto anti-Flag beads. HeLa cells transfected with V5-TSC2 were subject to starvation protocols as indicated prior to lysis. Lysates were incubated with Rheb-loaded beads at 4°C for 1 hr. Samples were analyzed by immunoblotting to detect interaction of TSC2 with Rheb. (E) HEK293 cells were transfected with equal amounts of TSC1 and V5-tagged TSC2. TSC complexes were isolated by immunoprecipation with V5 agarose. Immunoprecipitates were incubated with recombinant GTP-loaded GST-Rheb in the presence or absence of 100 μM arginine. TSC2-Rheb binding was analyzed by immunoblot. (F, G) TSC complexes and Rheb were isolated from HEK293 lysates. GTP-loaded Rheb was incubated with TSC complexes in the presence or absence of 100 μM arginine. GTP/GDP loading of Rheb was assessed as described in the methods. (H) The TSC complex inhibits Rheb-mediated mTORC1 activity independent of GAP activity. Cells were transfected with Flag-wild-type Rheb, Flag-Rheb R15G or Flag-Rheb N153T with V5-TSC2 and HA-GST-tagged S6K overnight. Cells were subjected to arginine and serum starvation prior to lysis and immunoblotted for phosphorylation of S6K. (I) HeLa cells were transfected overnight with wild-type or GAP-deficient TSC2, Flag-Rheb and HA-GST-tagged S6K. Cells were lysed and immunoblotted for phosphorylation of S6K. Scale bars: 10 μm. All graphs represent an average of at least three independent experiments and error bars represent s.e.m., except for (E), which represents two repeats and error bars represent s.d. *p<0.05, **p<0.01, ***p<0.005.
Figure 4. Arginine regulates the ability of TSC2 to bind and inhibit GTP-loaded Rheb independent of its ability to promote GTPase activity. (A) TSC2 recruitment to lysosomes is regulated by nucleotide-loading state of Rheb. HeLa cells were transfected with wild-type (WT), active Rheb (R15G), or inactive Rheb (D60K) overnight in the presence of GFP-lysosome BacMam. Cells were maintained in full nutrient medium, fixed and immunostained with antibodies against TSC2 and Flag-tag. The percentage of cells with lysosomal TSC2 was quantified. (B, C) Arginine suppresses activity of both wild-type and constitutively targeted to lysosomal membrane TSC2. TSC2-/- MEFs were transfected with either WT or p18-TSC2 (and HA-S6K (C)) overnight. Cells were deprived and replenished with arginine and either fixed and immunostained for Lamp1 and TSC2 (B) or subjected to immunoblot analysis of S6K phosphorylation (C). (D) Amino acids, specifically arginine regulate the interaction between Rheb and TSC2. HeLa cells were transfected with wild-type Flag-Rheb overnight, lysed and loaded onto anti-Flag beads. HeLa cells transfected with V5-TSC2 were subject to starvation protocols as indicated prior to lysis. Lysates were incubated with Rheb-loaded beads at 4°C for 1 hr. Samples were analyzed by immunoblotting to detect interaction of TSC2 with Rheb. (E) HEK293 cells were transfected with equal amounts of TSC1 and V5-tagged TSC2. TSC complexes were isolated by immunoprecipation with V5 agarose. Immunoprecipitates were incubated with recombinant GTP-loaded GST-Rheb in the presence or absence of 100 μM arginine. TSC2-Rheb binding was analyzed by immunoblot. (F, G) TSC complexes and Rheb were isolated from HEK293 lysates. GTP-loaded Rheb was incubated with TSC complexes in the presence or absence of 100 μM arginine. GTP/GDP loading of Rheb was assessed as described in the methods. (H) The TSC complex inhibits Rheb-mediated mTORC1 activity independent of GAP activity. Cells were transfected with Flag-wild-type Rheb, Flag-Rheb R15G or Flag-Rheb N153T with V5-TSC2 and HA-GST-tagged S6K overnight. Cells were subjected to arginine and serum starvation prior to lysis and immunoblotted for phosphorylation of S6K. (I) HeLa cells were transfected overnight with wild-type or GAP-deficient TSC2, Flag-Rheb and HA-GST-tagged S6K. Cells were lysed and immunoblotted for phosphorylation of S6K. Scale bars: 10 μm. All graphs represent an average of at least three independent experiments and error bars represent s.e.m., except for (E), which represents two repeats and error bars represent s.d. *p<0.05, **p<0.01, ***p<0.005.CC BY · PubMed Central
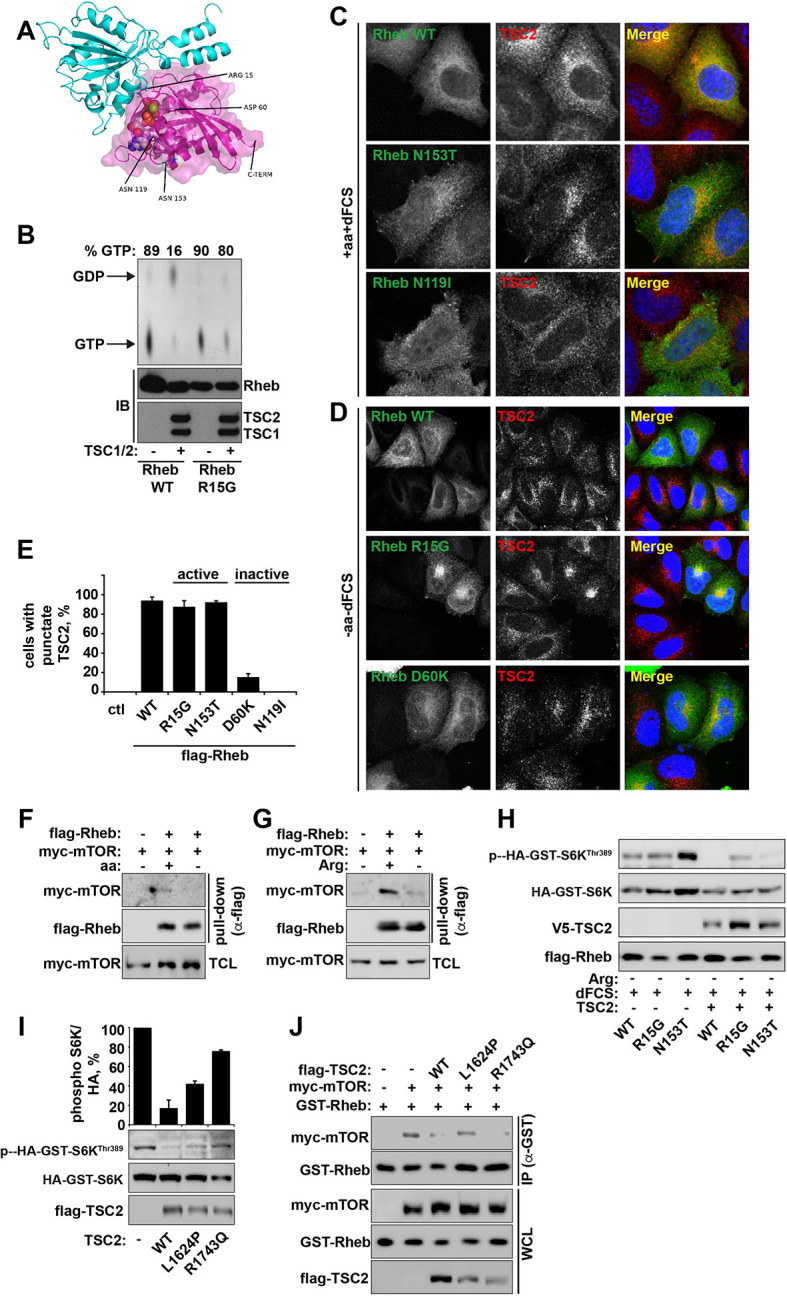
Figure 4—figure supplement 1. Arginine contributes to the regulation of Rheb activity by TSC2. (A) Model of the Rheb-TSC2 GAP domain complex, built using the human Rap1-Rap1GAP complex (pdb:3BRW) as a template. The TSC2 is in cyan cartoon representation, the Rheb is in magenta cartoon representation with a transparent molecular surface shown. The bound GTP is shown in spacefilling representation and the four key mutated Rheb residues, aspartic acid (Asp) 60, glutamine (Gln) 64, asparagine (Asn) 119, and asparagine (Asn) 153, are shown in stick representation. Note that these residues are not likely to perturb the interaction between Rheb and TSC2 directly. In addition, the location of the C-terminal membrane anchor of Rheb is shown. The figure was generated with PyMOL (Schrodinger, LLC). (B) Rheb R15G mutant is GTP-bound and largely insensitive to TSC2-dependent hydrolysis. Rheb wild-type and Rheb R15G were loaded with radiolabeled GTP prior to incubation with TSC2 for 60 min. GTP and GDP were eluted from Rheb and analyzed by thin-layer chromatography. Immunoblot (IB) samples demonstrate protein loading controls for Rheb, TSC1 and TSC2. (C) HeLa cells were transfected with Flag-tagged wild-type Rheb, active Rheb N153T, or inactive Rheb N119I for 24 hr. Cells (in full nutrient conditions) were fixed and immunostained with antibodies against TSC2 and Flag-tagged Rheb. (D) HeLa cells were transfected with Flag-tagged wild-type Rheb, active Rheb R15G, or inactive Rheb D60K for 24 hr. Cells were starved of amino acids and serum prior to fixation. Cells were immunostained with antibodies against TSC2 and Flag-tagged Rheb. (E) HeLa cells were transfected with active and inactive constructs described in C and D. The percentage of cells with punctate TSC2 was quantified in cells expressing Rheb mutants maintained in full nutrient conditions. (F, G) Amino acids, specifically arginine regulate the interaction between Rheb and mTOR. HeLa cells were transfected with Flag-wild-type Rheb overnight, lysed and loaded onto anti-Flag beads. HeLa cells transfected with myc-mTOR were subject to starvation protocols as indicated prior to lysis. Lysates were incubated with Rheb-loaded beads at 4°C. Samples were analyzed by immunoblotting to detect interaction of mTOR with Rheb. (H) TSC complex can inhibit Rheb-mediated mTORC1 activity independent of GAP activity. Cells were transfected with Flag-wild-type Rheb, Flag-Rheb R15G or Flag-Rheb N153T with Flag-TSC2 and HA-GST-tagged S6K overnight as in Figure 4H. Cells were subjected to arginine starvation in the presence of dFCS, prior to lysis and immunoblotted for phosphorylation of S6K. (I) HeLa cells were transfected overnight with wild-type or GAP-deficient TSC2 and HA-GST-tagged S6K. Cells were lysed and immunoblotted for phosphorylation of S6K. (J) HeLa cells were transfected with GST-Rheb either in the presence of mTOR and TSC2 constructs as indicated. Lysates were subjected to pull-down with glutathione Sepharose beads and interaction between Rheb and mTOR was analyzed by immunoblot. All graphs represent an average of at least two independent experiments and error bars represent standard deviation. Scale bars: 10 μm.
Figure 4—figure supplement 1. Arginine contributes to the regulation of Rheb activity by TSC2. (A) Model of the Rheb-TSC2 GAP domain complex, built using the human Rap1-Rap1GAP complex (pdb:3BRW) as a template. The TSC2 is in cyan cartoon representation, the Rheb is in magenta cartoon representation with a transparent molecular surface shown. The bound GTP is shown in spacefilling representation and the four key mutated Rheb residues, aspartic acid (Asp) 60, glutamine (Gln) 64, asparagine (Asn) 119, and asparagine (Asn) 153, are shown in stick representation. Note that these residues are not likely to perturb the interaction between Rheb and TSC2 directly. In addition, the location of the C-terminal membrane anchor of Rheb is shown. The figure was generated with PyMOL (Schrodinger, LLC). (B) Rheb R15G mutant is GTP-bound and largely insensitive to TSC2-dependent hydrolysis. Rheb wild-type and Rheb R15G were loaded with radiolabeled GTP prior to incubation with TSC2 for 60 min. GTP and GDP were eluted from Rheb and analyzed by thin-layer chromatography. Immunoblot (IB) samples demonstrate protein loading controls for Rheb, TSC1 and TSC2. (C) HeLa cells were transfected with Flag-tagged wild-type Rheb, active Rheb N153T, or inactive Rheb N119I for 24 hr. Cells (in full nutrient conditions) were fixed and immunostained with antibodies against TSC2 and Flag-tagged Rheb. (D) HeLa cells were transfected with Flag-tagged wild-type Rheb, active Rheb R15G, or inactive Rheb D60K for 24 hr. Cells were starved of amino acids and serum prior to fixation. Cells were immunostained with antibodies against TSC2 and Flag-tagged Rheb. (E) HeLa cells were transfected with active and inactive constructs described in C and D. The percentage of cells with punctate TSC2 was quantified in cells expressing Rheb mutants maintained in full nutrient conditions. (F, G) Amino acids, specifically arginine regulate the interaction between Rheb and mTOR. HeLa cells were transfected with Flag-wild-type Rheb overnight, lysed and loaded onto anti-Flag beads. HeLa cells transfected with myc-mTOR were subject to starvation protocols as indicated prior to lysis. Lysates were incubated with Rheb-loaded beads at 4°C. Samples were analyzed by immunoblotting to detect interaction of mTOR with Rheb. (H) TSC complex can inhibit Rheb-mediated mTORC1 activity independent of GAP activity. Cells were transfected with Flag-wild-type Rheb, Flag-Rheb R15G or Flag-Rheb N153T with Flag-TSC2 and HA-GST-tagged S6K overnight as in Figure 4H. Cells were subjected to arginine starvation in the presence of dFCS, prior to lysis and immunoblotted for phosphorylation of S6K. (I) HeLa cells were transfected overnight with wild-type or GAP-deficient TSC2 and HA-GST-tagged S6K. Cells were lysed and immunoblotted for phosphorylation of S6K. (J) HeLa cells were transfected with GST-Rheb either in the presence of mTOR and TSC2 constructs as indicated. Lysates were subjected to pull-down with glutathione Sepharose beads and interaction between Rheb and mTOR was analyzed by immunoblot. All graphs represent an average of at least two independent experiments and error bars represent standard deviation. Scale bars: 10 μm.CC BY · PubMed Central
Figure 5. Arginine, but not leucine is essential for mTORC1 activity in embryonic stem cells. Human embryonic stem cells (hESCs) were maintained (A) or differentiated to fibroblasts (B), neural precursors (C), neurons (D), or hepatocytes (E). hESCs and the derived lineages were starved of serum and indicated amino acids (isoleucine (Ile), leucine (Leu), arginine (Arg), or both leucine and arginine (Leu/Arg)). Lysates were subjected to immunoblotting for phosphorylation of S6K. All graphs represent an average of at least three independent experiments and error bars represent s.e.m. *p<0.05, **p<0.01, ***p<0.005.
Figure 5. Arginine, but not leucine is essential for mTORC1 activity in embryonic stem cells. Human embryonic stem cells (hESCs) were maintained (A) or differentiated to fibroblasts (B), neural precursors (C), neurons (D), or hepatocytes (E). hESCs and the derived lineages were starved of serum and indicated amino acids (isoleucine (Ile), leucine (Leu), arginine (Arg), or both leucine and arginine (Leu/Arg)). Lysates were subjected to immunoblotting for phosphorylation of S6K. All graphs represent an average of at least three independent experiments and error bars represent s.e.m. *p<0.05, **p<0.01, ***p<0.005.CC BY · PubMed Central
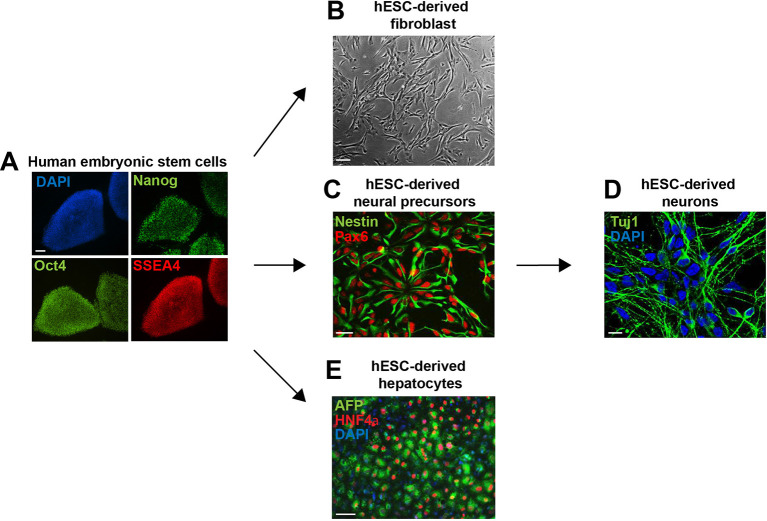
Figure 5—figure supplement 1. Embryonic stem cell differentiation. Human embryonic stem cells (hESCs) were maintained (A) or differentiated to fibroblasts (B), neural precursors (C) (and subsequently to neurons (D)), and hepatocytes (E). Cells were fixed and immunostained for antibodies as indicated. Scale bar: 100 μm, except for neurons, where scale bar: 10 μm.
Figure 5—figure supplement 1. Embryonic stem cell differentiation. Human embryonic stem cells (hESCs) were maintained (A) or differentiated to fibroblasts (B), neural precursors (C) (and subsequently to neurons (D)), and hepatocytes (E). Cells were fixed and immunostained for antibodies as indicated. Scale bar: 100 μm, except for neurons, where scale bar: 10 μm.CC BY · PubMed Central
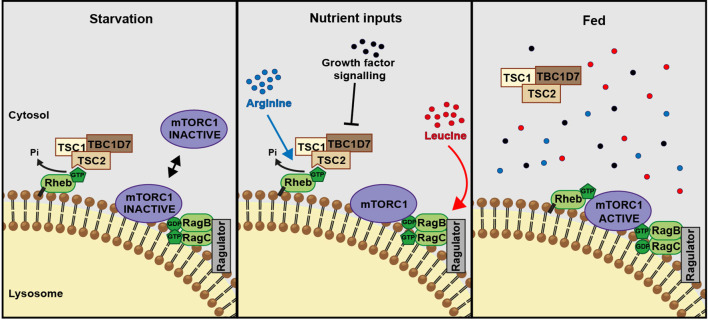
Figure 6. A model of amino acid-dependent mTORC1 regulation. Amino acids, most notably leucine activates mTORC1 via Rag GTPases and recruitment of mTOR to lysosomes. Arginine cooperates with growth factors to prevent interaction between TSC and Rheb on lysosomes which allows interaction between Rheb and mTORC1. See text for further details.
Figure 6. A model of amino acid-dependent mTORC1 regulation. Amino acids, most notably leucine activates mTORC1 via Rag GTPases and recruitment of mTOR to lysosomes. Arginine cooperates with growth factors to prevent interaction between TSC and Rheb on lysosomes which allows interaction between Rheb and mTORC1. See text for further details.CC BY · PubMed Central

Verification

Claims the paper makes

The claims and statistics of this paper haven’t been checked yet.

Run the check — free, no account needed. It reads the open-access text and checks the sources it cites.

A few free checks a day · papers already verified open instantly · results are public

Claims other papers make about this one

Each is checked against this paper’s own text: does it say what the citing paper says it does?

Self-check

Percentages, sums and reported differences re-computed from the paper’s own numbers.

The self-check needs the paper’s full text.

Citations

Cites

Show all 16 references

Research works printed but not linked: 53

  1. Arnold, 2006, The SWISS-MODEL workspace: a web-based environment for protein structure homology modelling, Bioinformatics, 22, 195, 10.1093/bioinformatics/bti770 · DOI
  2. Avruch, 2009, Activation of mTORC1 in two steps: rheb-GTP activation of catalytic function and increased binding of substrates to raptor1, Biochemical Society Transactions, 37, 223, 10.1042/BST0370223 · DOI
  3. Bairoch, 2005, The universal protein resource (uniProt), Nucleic Acids Research, 33, D154, 10.1093/nar/gki070 · DOI · Paper page
  4. Ban, 2004, Arginine and leucine regulate p70 S6 kinase and 4E-BP1 in intestinal epithelial cells, International Journal of Molecular Medicine, 13, 537, 10.3892/ijmm.13.4.537 · DOI
  5. Buerger, 2006, Localization of rheb to the endomembrane is critical for its signaling function, Biochemical and Biophysical Research Communications, 344, 869, 10.1016/j.bbrc.2006.03.220 · DOI
  6. Cai, 2006, Activity of TSC2 is inhibited by AKT-mediated phosphorylation and membrane partitioning, The Journal of Cell Biology, 173, 279, 10.1083/jcb.200507119 · DOI · Paper page
  7. Carroll, 2015, Amino acids and autophagy: cross-talk and co-operation to control cellular homeostasis, Amino Acids, 47, 10.1007/s00726-014-1775-2 · DOI
  8. Corradetti, 2004, Regulation of the TSC pathway by LKB1: evidence of a molecular link between tuberous sclerosis complex and peutz-jeghers syndrome, Genes & Development, 18, 1533, 10.1101/gad.1199104 · DOI
  9. Demetriades, 2014, Regulation of TORC1 in response to amino acid starvation via lysosomal recruitment of TSC2, Cell, 156, 786, 10.1016/j.cell.2014.01.024 · DOI
  10. Dibble, 2012, TBC1D7 is a third subunit of the TSC1-TSC2 complex upstream of mTORC1, Molecular Cell, 47, 535, 10.1016/j.molcel.2012.06.009 · DOI · Paper page
  11. Dunlop, 2011, Determining the pathogenicity of patient-derived TSC2 mutations by functional characterization and clinical evidence, European Journal of Human Genetics, 19, 789, 10.1038/ejhg.2011.38 · DOI
  12. Durán, 2012, Glutaminolysis activates rag-mTORC1 signaling, Molecular Cell, 47, 349, 10.1016/j.molcel.2012.05.043 · DOI
  13. El-Bassossy, 2013, Arginase inhibition alleviates hypertension in the metabolic syndrome, British Journal of Pharmacology, 169, 693, 10.1111/bph.12144 · DOI
  14. Garami, 2003, Insulin activation of rheb, a mediator of mTOR/S6K/4E-BP signaling, is inhibited by TSC1 and 2, Molecular Cell, 11, 1457, 10.1016/S1097-2765(03)00220-X · DOI · Paper page
  15. Han, 2012, Leucyl-tRNA synthetase is an intracellular leucine sensor for the mTORC1-signaling pathway, Cell, 149, 410, 10.1016/j.cell.2012.02.044 · DOI · Paper page
  16. Hara, 1998, Amino acid sufficiency and mTOR regulate p70 S6 kinase and eIF-4E BP1 through a common effector mechanism, Journal of Biological Chemistry, 273, 14484, 10.1074/jbc.273.23.14484 · DOI
  17. Hentges, 2001, FRAP/mTOR is required for proliferation and patterning during embryonic development in the mouse, PNAS, 98, 13796, 10.1073/pnas.241184198 · DOI
  18. Hunter, 1945, The inhibition of arginase by amino acids, Journal Biological Chemistry, 157, 427, 10.1016/S0021-9258(18)51079-6 · DOI
  19. Inoki, 2003, TSC2 mediates cellular energy response to control cell growth and survival, Cell, 115, 577, 10.1016/S0092-8674(03)00929-2 · DOI · Paper page
  20. Jacobs, 2013, Eccentric contractions increase the phosphorylation of tuberous sclerosis complex-2 (tSC2) and alter the targeting of TSC2 and the mechanistic target of rapamycin to the lysosome, The Journal of Physiology, 591, 4611, 10.1113/jphysiol.2013.256339 · DOI · Paper page
  21. Kiefer, 2009, The SWISS-MODEL repository and associated resources, Nucleic Acids Research, 37, D387, 10.1093/nar/gkn750 · DOI
  22. Korolchuk, 2011, Lysosomal positioning coordinates cellular nutrient responses, Nature Cell Biology, 13, 453, 10.1038/ncb2204 · DOI · Paper page
  23. Krissinel, 2004, Secondary-structure matching (sSM), a new tool for fast protein structure alignment in three dimensions, Acta Crystallographica Section D Biological Crystallography, 60, 2256, 10.1107/S0907444904026460 · DOI
  24. Labuschagne, 2014, Serine, but not glycine, supports one-carbon metabolism and proliferation of cancer cells, Cell Reports, 7, 1248, 10.1016/j.celrep.2014.04.045 · DOI · Paper page
  25. Land, 2007, Hypoxia-inducible factor 1 is regulated by the mammalian target of rapamycin (mTOR) via an mTOR signaling motif, Journal of Biological Chemistry, 282, 20534, 10.1074/jbc.M611782200 · DOI
  26. Laplante, 2012, MTOR signaling in growth control and disease, Cell, 149, 274, 10.1016/j.cell.2012.03.017 · DOI · Paper page
  27. Lengner, 2010, Derivation of pre-x inactivation human embryonic stem cells under physiological oxygen concentrations, Cell, 141, 872, 10.1016/j.cell.2010.04.010 · DOI
  28. Li, 2004, Biochemical and functional characterizations of small GTPase rheb and TSC2 GAP activity, Molecular and Cellular Biology, 24, 7965, 10.1128/MCB.24.18.7965-7975.2004 · DOI
  29. Long, 2005, Rheb binds and regulates the mTOR kinase, Current Biology, 15, 702, 10.1016/j.cub.2005.02.053 · DOI · Paper page
  30. Long, 2005, Rheb binding to mammalian target of rapamycin (mTOR) is regulated by amino acid sufficiency, Journal of Biological Chemistry, 280, 23433, 10.1074/jbc.C500169200 · DOI
  31. Maddocks, 2013, Serine starvation induces stress and p53-dependent metabolic remodelling in cancer cells, Nature, 493, 542, 10.1038/nature11743 · DOI · Paper page
  32. Manning, 2004, Balancing akt with S6K: implications for both metabolic diseases and tumorigenesis, The Journal of Cell Biology, 167, 399, 10.1083/jcb.200408161 · DOI
  33. Marchetto, 2010, A model for neural development and treatment of rett syndrome using human induced pluripotent stem cells, Cell, 143, 527, 10.1016/j.cell.2010.10.016 · DOI · Paper page
  34. Marshall, 2009, Characterization of the intrinsic and TSC2-GAP-regulated GTPase activity of rheb by real-time NMR, Science Signaling, 2, ra3, 10.1126/scisignal.2000029 · DOI
  35. Menon, 2014, Spatial control of the TSC complex integrates insulin and nutrient regulation of mTORC1 at the lysosome, Cell, 156, 771, 10.1016/j.cell.2013.11.049 · DOI · Paper page
  36. Nicklin, 2009, Bidirectional transport of amino acids regulates mTOR and autophagy, Cell, 136, 521, 10.1016/j.cell.2008.11.044 · DOI · Paper page
  37. Panchaud, 2013, Amino acid deprivation inhibits TORC1 through a GTPase-activating protein complex for the rag family GTPase Gtr1, Science Signaling, 6, ra42, 10.1126/scisignal.2004112 · DOI · Paper page
  38. Sancak, 2008, The rag GTPases bind raptor and mediate amino acid signaling to mTORC1, Science, 320, 1496, 10.1126/science.1157535 · DOI · Paper page
  39. Seaman, 2004, Cargo-selective endosomal sorting for retrieval to the golgi requires retromer, The Journal of Cell Biology, 165, 111, 10.1083/jcb.200312034 · DOI · Paper page
  40. Si-Tayeb, 2010, Highly efficient generation of human hepatocyte-like cells from induced pluripotent stem cells, Hepatology, 51, 297, 10.1002/hep.23354 · DOI · Paper page
  41. Smith, 2005, The tuberous sclerosis protein TSC2 is not required for the regulation of the mammalian target of rapamycin by amino acids and certain cellular stresses, Journal of Biological Chemistry, 280, 18717, 10.1074/jbc.M414499200 · DOI
  42. Soldner, 2009, Parkinson's disease patient-derived induced pluripotent stem cells free of viral reprogramming factors, Cell, 136, 964, 10.1016/j.cell.2009.02.013 · DOI
  43. Sun, 2008, Phospholipase D1 is an effector of rheb in the mTOR pathway, PNAS, 105, 8286, 10.1073/pnas.0712268105 · DOI
  44. Tee, 2003, Tuberous sclerosis complex gene products, tuberin and hamartin, control mTOR signaling by acting as a GTPase-activating protein complex toward rheb, Current Biology, 13, 1259, 10.1016/S0960-9822(03)00506-2 · DOI · Paper page
  45. Urano, 2005, Identification of novel single amino acid changes that result in hyperactivation of the unique GTPase, rheb, in fission yeast, Molecular Microbiology, 58, 1074, 10.1111/j.1365-2958.2005.04877.x · DOI
  46. Urano, 2007, Point mutations in TOR confer rheb-independent growth in fission yeast and nutrient-independent mammalian TOR signaling in mammalian cells, PNAS, 104, 3514, 10.1073/pnas.0608510104 · DOI
  47. Van Der Spoel, 2005, GROMACS: fast, flexible, and free, Journal of Computational Chemistry, 26, 1701, 10.1002/jcc.20291 · DOI
  48. Wang, 2015, Lysosomal amino acid transporter SLC38A9 signals arginine sufficiency to mTORC1, Science, 347, 188, 10.1126/science.1257132 · DOI
  49. Wu, 2009, Arginine metabolism and nutrition in growth, health and disease, Amino Acids, 37, 153, 10.1007/s00726-008-0210-y · DOI · Paper page
  50. Wu, 2013, Impacts of arginine nutrition on embryonic and fetal development in mammals, Amino Acids, 45, 241, 10.1007/s00726-013-1515-z · DOI
  51. Xu, 2004, Immortalized fibroblast-like cells derived from human embryonic stem cells support undifferentiated cell growth, Stem Cells, 22, 972, 10.1634/stemcells.22-6-972 · DOI
  52. Yu, 2005, Structural basis for the unique biological function of small GTPase RHEB, Journal of Biological Chemistry, 280, 17093, 10.1074/jbc.M501253200 · DOI
  53. Zhang, 2003, Rheb is a direct target of the tuberous sclerosis tumour suppressor proteins, Nature Cell Biology, 5, 578, 10.1038/ncb999 · DOI

Cited by

Sorted by citations

Metadata

Authors
Carroll, B., Maetzel, D., Maddocks, O. D., Otten, G., Ratcliff, M., Smith, G. R., Dunlop, E. A., Passos, J. F., Davies, O. R., Jaenisch, R., Tee, A. R., Sarkar, S., & Korolchuk, V. I.
Affiliations
  • Institute for Cell and Molecular Biosciences, Newcastle University
  • Whitehead Institute for Biomedical Research, Massachusetts Institute of Technology
  • The Beatson Institute for Cancer Research
  • Institute of Cancer and Genetics, Cardiff University
  • Institute of Cancer and Genomic Sciences, Institute of Biomedical Research, College of Medical and Dental Sciences, University of Birmingham
Venue
eLife
Published
2016-01-07
Volume
5
ISSN
2050-084X
Cited by
183
References
16
Language
en
Funders
  • Biotechnology and Biological Sciences Research Council
  • Medical Research Council
  • British Skin Foundation
  • National Institute for Health Research

About these checks

Registry, retraction, Cites and statistics results are computed, not judged, with one exception: a printed reference that no index lists is read once by a model before it counts as a citation error. Claims are extracted by a model and kept only when their quote appears verbatim in the text; each cited source is then checked, with a model’s help, for whether it says what the claim relies on. Those verdicts can be wrong — read the claim’s quote and the cited source before relying on one.

Statistics and arithmetic are recomputed, not judged.

Confidence bands are shown only for fields calibrated on our annotated test set. None is calibrated yet, so no band is shown.

What counts as a claim ›How we measure confidence ›How we check this ›

Are you an author, or do you see a problem with this page? Request a review