

The DOI matches its Crossref record; 91 of the 92 references it cites were found in a registry or an index.
Activation of GCN2 kinase by ribosome stalling links translation elongation with translation initiation
Open accessAbstract
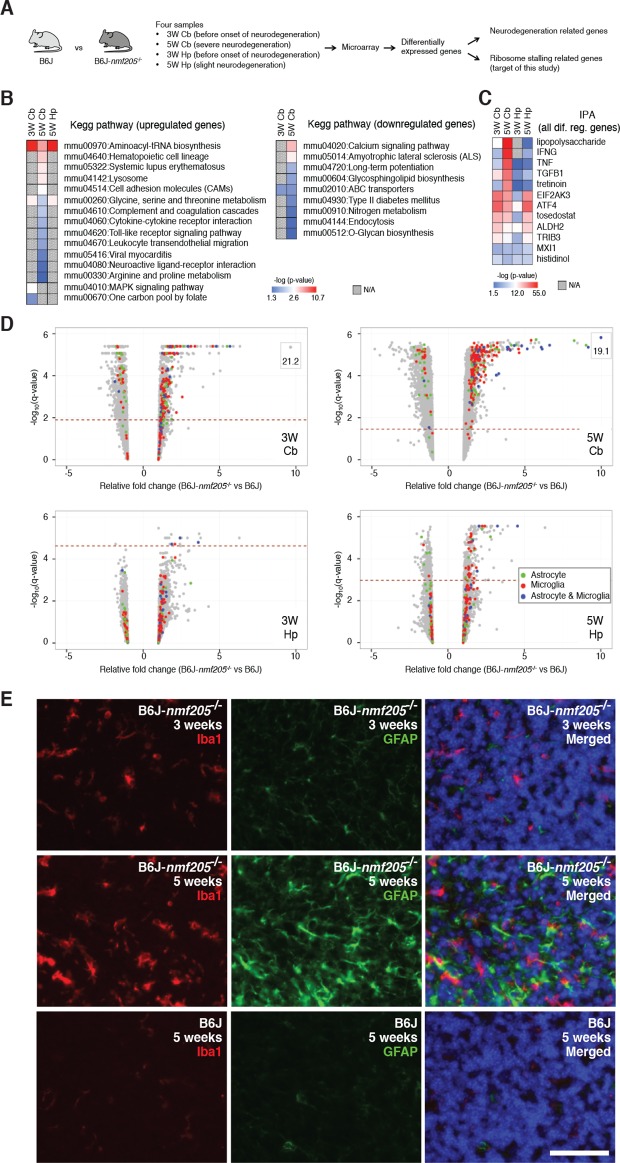
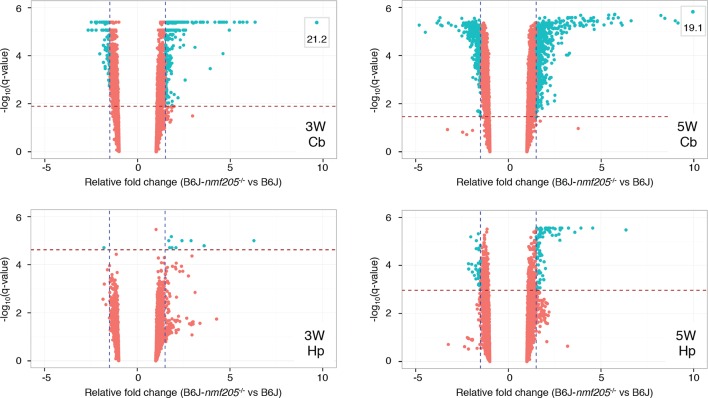
Ribosome stalling during translation has recently been shown to cause neurodegeneration, yet the signaling pathways triggered by stalled elongation complexes are unknown. To investigate these pathways we analyzed the brain of C57BL/6J-Gtpbp2nmf205-/- mice in which neuronal elongation complexes are stalled at AGA codons due to deficiencies in a tRNAArgUCU tRNA and GTPBP2, a mammalian ribosome rescue factor. Increased levels of phosphorylation of eIF2α (Ser51) were detected prior to neurodegeneration in these mice and transcriptome analysis demonstrated activation of ATF4, a key transcription factor in the integrated stress response (ISR) pathway. Genetic experiments showed that this pathway was activated by the eIF2α kinase, GCN2, in an apparent deacylated tRNA-independent fashion. Further we found that the ISR attenuates neurodegeneration in C57BL/6J-Gtpbp2nmf205-/- mice, underscoring the importance of cellular and stress context on the outcome of activation of this pathway. These results demonstrate the critical interplay between translation elongation and initiation in regulating neuron survival during cellular stress.
Overview
The claims and statistics of this paper haven’t been checked yet.
Run the check — free, no account needed. It reads the open-access text and checks the sources it cites.
Integrity signals
Registry
Cites
Statistics
Figures
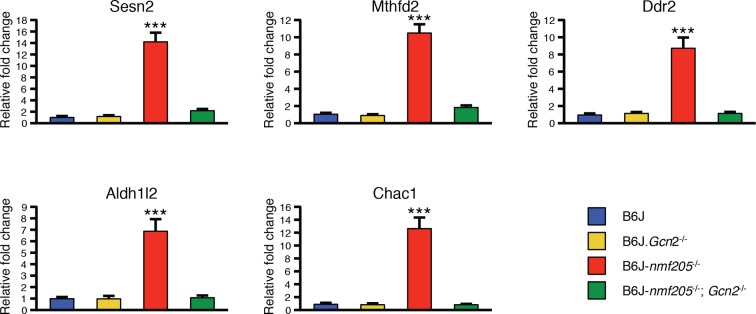
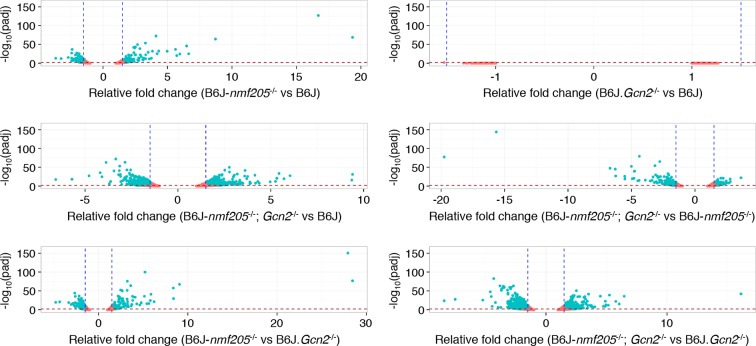
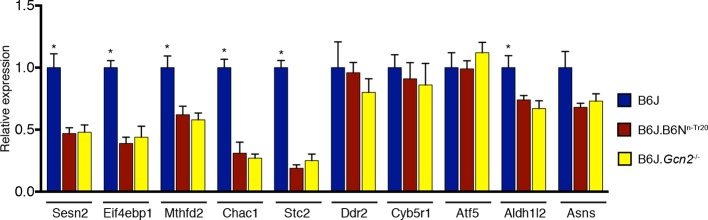
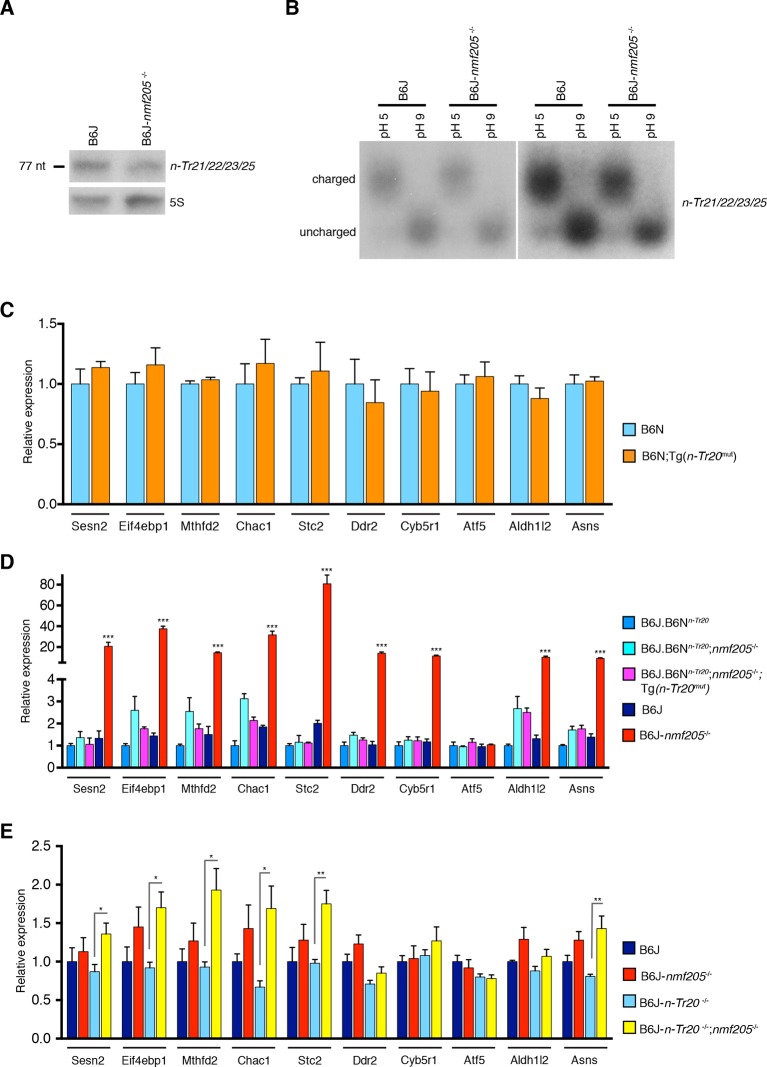
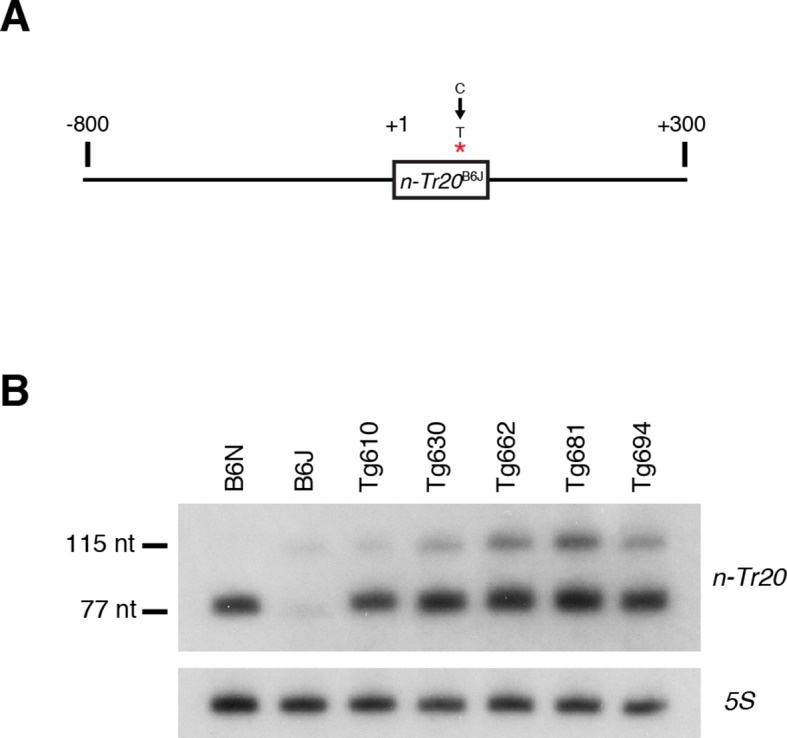
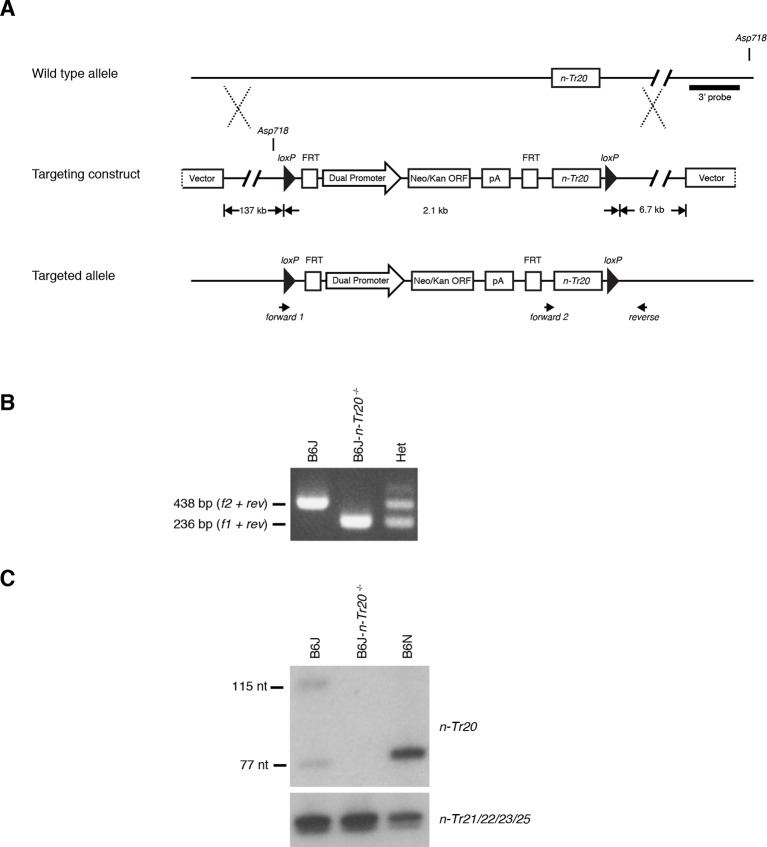
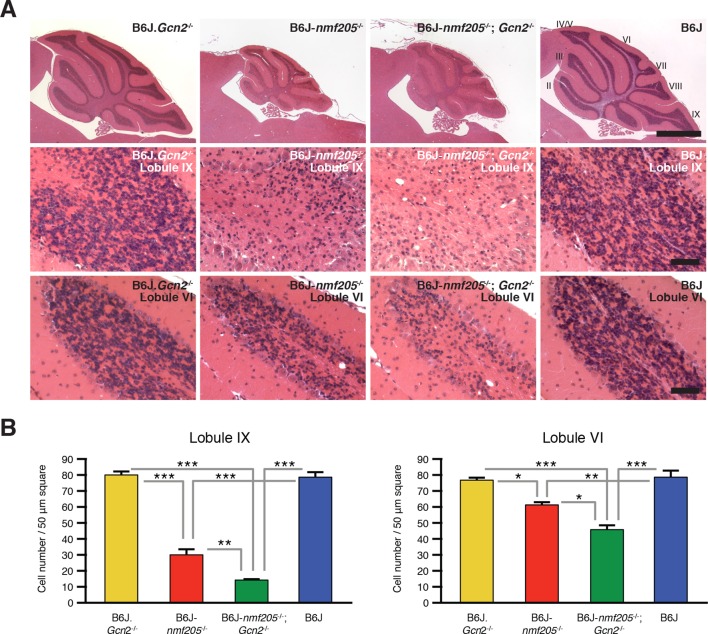
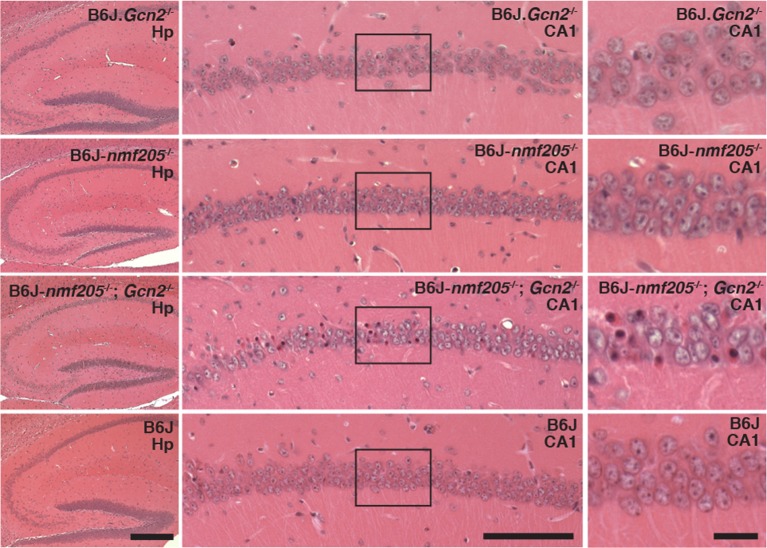
Verification
Claims the paper makes
The claims and statistics of this paper haven’t been checked yet.
Run the check — free, no account needed. It reads the open-access text and checks the sources it cites.
Claims other papers make about this one
Each is checked against this paper’s own text: does it say what the citing paper says it does?
The cited source says what the claim attributes to it.
In the citing paper
“The C57BL6/J (B6J)-nmf205 mouse model has mutations in both the translation GTPase GTPBP2 and the neuronal tRNAArgUCU genes that cause neurodegeneration through ribosomal stalling (Ishimura et al., 2014, 2016).”
From Meta-Analysis of the Alzheimer’s Disease Human Brain Transcriptome and Functional Dissection in Mouse Models (2020) · cites this paper as Ishimura et al., 2016
Self-check
Percentages, sums and reported differences re-computed from the paper’s own numbers.
The self-check needs the paper’s full text.
Citations
Cites
Analysis of Relative Gene Expression Data Using Real-Time Quantitative PCR and the 2−ΔΔCT Method
Livak, K. J., & Schmittgen, T. D. (2001) · Methods · doi:10.1006/meth.2001.1262 · Cited by 180,860
Moderated estimation of fold change and dispersion for RNA-seq data with DESeq2
Love, M. I., Huber, W., & Anders, S. (2014) · Genome Biology · doi:10.1186/s13059-014-0550-8 · Cited by 95,106
Systematic and integrative analysis of large gene lists using DAVID bioinformatics resources
Huang, D. W., Sherman, B. T., & Lempicki, R. A. (2009) · Nature Protocols · doi:10.1038/nprot.2008.211 · Cited by 35,890
A Direct Approach to False Discovery Rates
Storey, J. D. (2002) · Journal of the Royal Statistical Society Series B: Statistical Methodology · doi:10.1111/1467-9868.00346 · Cited by 5,603
Yoshida, H., Matsui, T., Yamamoto, A., Okada, T., & Mori, K. (2001) · Cell · doi:10.1016/s0092-8674(01)00611-0 · Cited by 4,054
Mutation of the mouse klotho gene leads to a syndrome resembling ageing
Kuro-o, M., Matsumura, Y., Aizawa, H., Kawaguchi, H., Suga, T., Utsugi, T., Ohyama, Y., Kurabayashi, M., Kaname, T., Kume, E., et al. (1997) · Nature · doi:10.1038/36285 · Cited by 3,837
An Integrated Stress Response Regulates Amino Acid Metabolism and Resistance to Oxidative Stress
Harding, H. P., Zhang, Y., Zeng, H., Novoa, I., Lu, P. D., Calfon, M. A., Sadri, N., Yun, C., Popko, B., Paules, R. S., et al. (2003) · Molecular Cell · doi:10.1016/s1097-2765(03)00105-9 · Cited by 3,336
FMRP Stalls Ribosomal Translocation on mRNAs Linked to Synaptic Function and Autism
Darnell, J. C., Van Driesche, S. J., Zhang, C., Hung, K. Y. S., Mele, A., Fraser, C. E., Stone, E. F., Chen, C., Fak, J. J., Chi, S. W., et al. (2011) · Cell · doi:10.1016/j.cell.2011.06.013 · Cited by 2,072
Reinitiation involving upstream ORFs regulates ATF4 mRNA translation in mammalian cells
Vattem, K. M., & Wek, R. C. (2004) · Proceedings of the National Academy of Sciences · doi:10.1073/pnas.0400541101 · Cited by 1,696
ER-stress-induced transcriptional regulation increases protein synthesis leading to cell death
Han, J., Back, S. H., Hur, J., Lin, Y.-H., Gildersleeve, R., Shan, J., Yuan, C. L., Krokowski, D., Wang, S., Hatzoglou, M., et al. (2013) · Nature Cell Biology · doi:10.1038/ncb2738 · Cited by 1,691
Kozutsumi, Y., Segal, M. S., Normington, K., Gething, M.-J. H., & Sambrook, J. (1988) · Nature · doi:10.1038/332462a0 · Cited by 1,322
Codon Optimality Is a Major Determinant of mRNA Stability
Presnyak, V., Alhusaini, N., Chen, Y.-H., Martin, S., Morris, N., Kline, N., Olson, S., Weinberg, D., Baker, K. E., Graveley, B. R., et al. (2015) · Cell · doi:10.1016/j.cell.2015.02.029 · Cited by 1,078
Lu, P. D., Harding, H. P., & Ron, D. (2004) · The Journal of Cell Biology · doi:10.1083/jcb.200408003 · Cited by 1,006
The eIF2α kinases: their structures and functions
Donnelly, N., Gorman, A. M., Gupta, S., & Samali, A. (2013) · Cellular and Molecular Life Sciences · doi:10.1007/s00018-012-1252-6 · Cited by 906
The Scanning Mechanism of Eukaryotic Translation Initiation
Hinnebusch, A. G. (2014) · Annual Review of Biochemistry · doi:10.1146/annurev-biochem-060713-035802 · Cited by 798
Codon Bias as a Means to Fine-Tune Gene Expression
Quax, T. E. F., Claassens, N. J., Söll, D. G., & John van der, O. O. S. T. (2015) · Molecular Cell · doi:10.1016/j.molcel.2015.05.035 · Cited by 791
Ye, J., Kumanova, M., Hart, L. S., Sloane, K. L., Zhang, H., Panis, D. N. D., Bobrovnikova-Marjon, E. V., Diehl, J. A., Ron, D., & Koumenis, C. (2010) · The EMBO Journal · doi:10.1038/emboj.2010.81 · Cited by 709
Chiu, I. M., Morimoto, E. T. A., Goodarzi, H., Liao, J. T., O’Keeffe, S., Phatnani, H. P., Muratet, M., Carroll, M. C., Levy, S., Tavazoie, S., et al. (2013) · Cell Reports · doi:10.1016/j.celrep.2013.06.018 · Cited by 651
Sustained translational repression by eIF2α-P mediates prion neurodegeneration
Moreno, J. A., Radford, H. E., Peretti, D., Steinert, J. R., Verity, N., Martin, M. G., Halliday, M., Morgan, J., Dinsdale, D. D., Ortori, C. A., et al. (2012) · Nature · doi:10.1038/nature11058 · Cited by 616
Suppression of eIF2α kinases alleviates Alzheimer's disease–related plasticity and memory deficits
Ma, T., Trinh, M. A., Wexler, A. J., Bourbon, C., Gatti, E., Pierre, P., Cavener, D. R., & Klann, E. (2013) · Nature Neuroscience · doi:10.1038/nn.3486 · Cited by 575
Optimization of Codon Translation Rates via tRNA Modifications Maintains Proteome Integrity
Nedialkova, D. D., & Leidel, S. A. (2015) · Cell · doi:10.1016/j.cell.2015.05.022 · Cited by 565
Dong, J., Qiu, H., Garcia-Barrio, M., Anderson, J., & Hinnebusch, A. G. (2000) · Molecular Cell · doi:10.1016/s1097-2765(00)00028-9 · Cited by 545
Wek, S. A., Zhu, S., & Wek, R. C. (1995) · Molecular and Cellular Biology · doi:10.1128/mcb.15.8.4497 · Cited by 510
Cui, X., Hwang, J. T. G., Qiu, J., Blades, N. J., & Churchill, G. A. (2004) · Biostatistics · doi:10.1093/biostatistics/kxh018 · Cited by 489
Eukaryotic Initiation Factor 2 Phosphorylation and Translational Control in Metabolism
Baird, T. D., & Wek, R. C. (2012) · Advances in Nutrition · doi:10.3945/an.112.002113 · Cited by 486
Rate-Limiting Steps in Yeast Protein Translation
Shah, P., Ding, Y., Niemczyk, M., Kudla, G., & Plotkin, J. B. (2013) · Cell · doi:10.1016/j.cell.2013.05.049 · Cited by 463 · cited 1×
“Indeed, under mild amino acid stress conditions (two–five fold decrease in tRNAs) a decrease in initiation has been predicted to also decrease protein production via yeast whole-cell modeling simulations in which ribosomes have been suggested to be rate limiting for protein production (Shah et al., 2013).”
BackgroundRibosome stalling induced by mutation of a CNS-specific tRNA causes neurodegeneration
Ishimura, R., Nagy, G., Dotu, I., Zhou, H., Yang, X.-L., Schimmel, P., Senju, S., Nishimura, Y., Chuang, J. H., & Ackerman, S. L. (2014) · Science · doi:10.1126/science.1249749 · Cited by 455
Self-citationEndoplasmic reticulum stress in health and disease
Zhao, L., & Ackerman, S. L. (2006) · Current Opinion in Cell Biology · doi:10.1016/j.ceb.2006.06.005 · Cited by 447
Self-citationA mechanistic overview of translation initiation in eukaryotes
Aitken, C. E., & Lorsch, J. R. (2012) · Nature Structural & Molecular Biology · doi:10.1038/nsmb.2303 · Cited by 419
Isolation of glia from Alzheimer’s mice reveals inflammation and dysfunction
Orre, M., Kamphuis, W., Osborn, L. M., Jansen, A. H. P., Kooijman, L., Bossers, K., & Hol, E. M. (2014) · Neurobiology of Aging · doi:10.1016/j.neurobiolaging.2014.06.004 · Cited by 394
Axonally Synthesized ATF4 Transmits a Neurodegenerative Signal across Brain Regions
Baleriola, J., Walker, C. A., Jean, Y. Y., Crary, J. F., Troy, C. M., Nagy, P. L., & Hengst, U. (2014) · Cell · doi:10.1016/j.cell.2014.07.001 · Cited by 352
Widespread Regulation of Translation by Elongation Pausing in Heat Shock
Shalgi, R., Hurt, J. A., Krykbaeva, I., Taipale, M., Lindquist, S. L., & Burge, C. B. (2013) · Molecular Cell · doi:10.1016/j.molcel.2012.11.028 · Cited by 346
Electrostatics in the Ribosomal Tunnel Modulate Chain Elongation Rates
Lu, J., & DEUTSCH, C. J. (2008) · Journal of Molecular Biology · doi:10.1016/j.jmb.2008.08.089 · Cited by 328
MAANOVA: A Software Package for the Analysis of Spotted cDNA Microarray Experiments
Wu, H., Kerr, K. F., Cui, X., & Churchill, G. A. (2003) · Statistics for biology and health · doi:10.1007/0-387-21679-0_14 · Cited by 319
Widespread Co-translational RNA Decay Reveals Ribosome Dynamics
Pelechano, V., Wu, W., & Steinmetz, L. M. (2015) · Cell · doi:10.1016/j.cell.2015.05.008 · Cited by 319
Jiang, H.-Y., & Wek, R. C. (2005) · Journal of Biological Chemistry · doi:10.1074/jbc.m413660200 · Cited by 318
Keeping the eIF2 alpha kinase Gcn2 in check
Castilho, B. A., Shanmugam, R., da Silva, R. C., Ramesh, R., Himme, B. M., & Sattlegger, E. (2014) · Biochimica et Biophysica Acta (BBA) - Molecular Cell Research · doi:10.1016/j.bbamcr.2014.04.006 · Cited by 317
Failure of Amino Acid Homeostasis Causes Cell Death following Proteasome Inhibition
Suraweera, A., Münch, C., Hanssum, A., & Bertolotti, A. (2012) · Molecular Cell · doi:10.1016/j.molcel.2012.08.003 · Cited by 317
Activation of GCN2 in UV-Irradiated Cells Inhibits Translation
Deng, J., Harding, H. P., Raught, B., Gingras, A., Berlanga, J. J., Scheuner, D., Kaufman, R. J., Ron, D., & Sonenberg, N. (2002) · Current Biology · doi:10.1016/s0960-9822(02)01037-0 · Cited by 298
Wek, R. C., Jackson, B. M., & Hinnebusch, A. G. (1989) · Proceedings of the National Academy of Sciences · doi:10.1073/pnas.86.12.4579 · Cited by 293
Following translation by single ribosomes one codon at a time
Wen, J.-D., Lancaster, L., Hodges, C., Zeri, A., Yoshimura, S., Noller, H., Bustamante, C., & Tinoco, I. (2008) · Nature · doi:10.1038/nature06716 · Cited by 292
PERK inhibition prevents tau-mediated neurodegeneration in a mouse model of frontotemporal dementia
Radford, H. E., Moreno, J. A., Verity, N., Halliday, M., & Mallucci, G. R. (2015) · Acta Neuropathologica · doi:10.1007/s00401-015-1487-z · Cited by 290
ATF4 is an oxidative stress–inducible, prodeath transcription factor in neurons in vitro and in vivo
Lange, P. S., Chavez, J. C., Pinto, J. T., Coppola, G., Sun, C.-W., Townes, T. M., Geschwind, D. H., & Ratan, R. R. (2008) · The Journal of Experimental Medicine · doi:10.1084/jem.20071460 · Cited by 272
Arrest Peptides: Cis -Acting Modulators of Translation
Ito, K., & Chiba, S. (2013) · Annual Review of Biochemistry · doi:10.1146/annurev-biochem-080211-105026 · Cited by 266
Fragile X Mental Retardation Protein Regulates Translation by Binding Directly to the Ribosome
Chen, E., Sharma, M. R., Shi, X., Agrawal, R. K., & Joseph, S. (2014) · Molecular Cell · doi:10.1016/j.molcel.2014.03.023 · Cited by 253
Cotranslational Response to Proteotoxic Stress by Elongation Pausing of Ribosomes
Liu, B., Han, Y. Y., & Qian, S. (2013) · Molecular Cell · doi:10.1016/j.molcel.2012.12.001 · Cited by 252
The Analysis of Gene Expression Data
Parmigiani, G., Garrett, E. S., Irizarry, R. A., & Zeger, S. L. (2003) · Statistics for biology and health · doi:10.1007/b97411 · Cited by 244
Marton, M. J., de Aldana, C. R. V., Qiu, H., Chakraburtty, K., & Hinnebusch, A. G. (1997) · Molecular and Cellular Biology · doi:10.1128/mcb.17.8.4474 · Cited by 223
Stress-induced Skeletal Muscle Gadd45a Expression Reprograms Myonuclei and Causes Muscle Atrophy
Ebert, S. M., Dyle, M. C., Kunkel, S. D., Bullard, S. A., Bongers, K. S., Fox, D. K., Dierdorff, J. M., Foster, E. D., & Adams, C. M. (2012) · Journal of Biological Chemistry · doi:10.1074/jbc.m112.374777 · Cited by 221
Pausing on Polyribosomes: Make Way for Elongation in Translational Control
Richter, J. D., & Coller, J. (2015) · Cell · doi:10.1016/j.cell.2015.09.041 · Cited by 207
Ribosomopathies: how a common root can cause a tree of pathologies
Danilova, N., & Gazda, H. T. (2015) · Disease Models & Mechanisms · doi:10.1242/dmm.020529 · Cited by 201
Glucose Limitation Induces GCN4 Translation by Activation of Gcn2 Protein Kinase
Yang, R., Wek, S. A., & Wek, R. C. (2000) · Molecular and Cellular Biology · doi:10.1128/mcb.20.8.2706-2717.2000 · Cited by 199
Translation elongation can control translation initiation on eukaryotic mRNAs
Chu, D., Kazana, E., Bellanger, N., Singh, T., Tuite, M. F., & von der Haar, T. (2013) · The EMBO Journal · doi:10.1002/embj.201385651 · Cited by 195
Ramírez, M., Wek, R. C., & Hinnebusch, A. G. (1991) · Molecular and Cellular Biology · doi:10.1128/mcb.11.6.3027 · Cited by 169
Devi, L., & Ohno, M. (2014) · Neurobiology of Aging · doi:10.1016/j.neurobiolaging.2014.04.031 · Cited by 169
Dynamics of translation by single ribosomes through mRNA secondary structures
Chen, C., Zhang, H., Broitman, S. L., Reiche, M., Farrell, I., Cooperman, B. S., & Goldman, Y. E. (2013) · Nature Structural & Molecular Biology · doi:10.1038/nsmb.2544 · Cited by 147
The Transcription Factor Network Associated With the Amino Acid Response in Mammalian Cells
Kilberg, M. S., Balasubramanian, M. N., Fu, L., & Shan, J. (2012) · Advances in Nutrition · doi:10.3945/an.112.001891 · Cited by 144
Genetic and acute CPEB1 depletion ameliorate fragile X pathophysiology
Udagawa, T., Farny, N. G., Jakovcevski, M., Kaphzan, H., Alarcón, J. M., Anilkumar, S., Ivshina, M. P., Hurt, J. A., Nagaoka, K., Nalavadi, V., et al. (2013) · Nature Medicine · doi:10.1038/nm.3353 · Cited by 134
Ribosomes slide on lysine-encoding homopolymeric A stretches
Koutmou, K. S., Schuller, A. P., Brunelle, J. L., Radhakrishnan, A., Djuranović, S., & Green, R. (2015) · eLife · doi:10.7554/elife.05534 · Cited by 131
ATF4 protects against neuronal death in cellular PD models by maintaining levels of parkin
Sun, X., Liu, J., Crary, J. F., Malagelada, C., Sulzer, D., Greene, L., & Levy, O. (2013) · Journal of Neuroscience · doi:10.1523/jneurosci.2292-12.2013 · Cited by 123
Diverse diseases from a ubiquitous process: The ribosomopathy paradox
Armistead, J., & Triggs‐Raine, B. L. (2014) · FEBS Letters · doi:10.1016/j.febslet.2014.03.024 · Cited by 121
Ribosomopathies: Global process, tissue specific defects
Yelick, P. C., & Trainor, P. A. (2015) · Rare Diseases · doi:10.1080/21675511.2015.1025185 · Cited by 117
Krokowski, D., Han, J., Saikia, M., Majumder, M., Yuan, C. L., Guan, B., Bevilacqua, E., Bussolati, O., Bröer, S., Arvan, P., et al. (2013) · Journal of Biological Chemistry · doi:10.1074/jbc.m113.466920 · Cited by 117
Zhu, S., Sobolev, A. Y., & Wek, R. C. (1996) · Journal of Biological Chemistry · doi:10.1074/jbc.271.40.24989 · Cited by 115
Protein-Folding Homeostasis in the Endoplasmic Reticulum and Nutritional RegulationPreprint
Ron, D., & Harding, H. P. (2012) · Cold Spring Harbor Perspectives in Biology · doi:10.1101/cshperspect.a013177 · Cited by 108
The impact of PKR activation: from neurodegeneration to cancer
Marchal, J. A., López, G., Perán, M., Comino, A., Delgado, J. R., Garcı́a-Garcı́a, J., Conde, V., Aranda, F. M., Rivas, C., Estéban, M., et al. (2014) · The FASEB Journal · doi:10.1096/fj.13-248294 · Cited by 106
Transfer RNAs Mediate the Rapid Adaptation of Escherichia coli to Oxidative Stress
Zhong, J., Xiao, C., Gu, W., Du, G., Sun, X., He, Q., & Zhang, G. (2015) · PLoS Genetics · doi:10.1371/journal.pgen.1005302 · Cited by 106
Less is more: improving proteostasis by translation slow down
Sherman, M. Y., & Qian, S. (2013) · Trends in Biochemical Sciences · doi:10.1016/j.tibs.2013.09.003 · Cited by 93
Narasimhan, J., Staschke, K. A., & Wek, R. C. (2004) · Journal of Biological Chemistry · doi:10.1074/jbc.m402228200 · Cited by 85
Translational control by heme-regulated eIF2α kinase during erythropoiesis
Chen, J.-J. (2014) · Current Opinion in Hematology · doi:10.1097/moh.0000000000000030 · Cited by 82
PKR Inhibition Rescues Memory Deficit and ATF4 Overexpression in ApoE ε4 Human Replacement Mice
Segev, Y., Barrera, I., Ounallah-Saad, H., Wibrand, K., Sporild, I., Livne, A., Rosenberg, T., David, O., Mints, M., Bramham, C. R., et al. (2015) · Journal of Neuroscience · doi:10.1523/jneurosci.5241-14.2015 · Cited by 81
Inada, T. (2013) · Biochimica et Biophysica Acta (BBA) - Gene Regulatory Mechanisms · doi:10.1016/j.bbagrm.2013.02.004 · Cited by 80
Qiu, H., Hu, C., Anderson, J. T., Björk, G. R., Sarkar, S., Hopper, A. K., & Hinnebusch, A. G. (2000) · Molecular and Cellular Biology · doi:10.1128/mcb.20.7.2505-2516.2000 · Cited by 77
Zhu, S., & Wek, R. C. (1998) · Journal of Biological Chemistry · doi:10.1074/jbc.273.3.1808 · Cited by 76
Dynamics of co-translational protein targeting
Elvekrog, M., & Walter, P. (2015) · Current Opinion in Chemical Biology · doi:10.1016/j.cbpa.2015.09.016 · Cited by 72
Devi, L., & Ohno, M. (2013) · PLoS ONE · doi:10.1371/journal.pone.0077335 · Cited by 66
Holtman, I. R., Noback, M. A., Bijlsma, M., Duong, K. N., van der Geest, M. A., Ketelaars, P. T., Brouwer, N., Vainchtein, I. D., Eggen, B. J. L., & Boddeke, H. W. G. M. (2015) · Glia · doi:10.1002/glia.22810 · Cited by 57
Jaberi, E., Rohani, M., Shahidi, G. A., Nafissi, S., Arefian, E., Soleimani, M., Rasooli, P., Ahmadieh, H., Daftarian, N., Carrami, E. M., et al. (2015) · Neurobiology of Aging · doi:10.1016/j.neurobiolaging.2015.10.034 · Cited by 56
Knight, J. R. P., Bastide, A., Roobol, A., Roobol, J., Jackson, T. J., Utami, W., Barrett, D. A., Smales, C. M., & Willis, A. E. (2014) · Biochemical Journal · doi:10.1042/bj20141014 · Cited by 54
Ramirez, M., Wek, R. C., & Hinnebusch, A. G. (1991) · Molecular and Cellular Biology · doi:10.1128/mcb.11.6.3027-3036.1991 · Cited by 50
Phosphoproteins in Stress-Induced Disease
Dalton, L. E., Healey, E., Irving, J. A., & Marciniak, S. J. (2012) · Progress in molecular biology and translational science · doi:10.1016/b978-0-12-396456-4.00003-1 · Cited by 49
Sadleir, K. R., Eimer, W. A., Kaufman, R. J., Osten, P., & Vassar, R. J. (2014) · PLoS ONE · doi:10.1371/journal.pone.0101643 · Cited by 40
Stress-induced inhibition of translation independently of eIF2α phosphorylation
Knutsen, J. H. J., Rødland, G. E., Bøe, C. A., Håland, T. W., Sunnerhagen, P., Grallert, B., & Boye, E. (2015) · Journal of Cell Science · doi:10.1242/jcs.176545 · Cited by 40
Paesler, K., Xie, K., Hettich, M. M., Siwek, M. E., Ryan, D. P., Schröder, S., Papazoglou, A., Broich, K., Müller, R., Trog, A., et al. (2015) · Neural Plasticity · doi:10.1155/2015/825157 · Cited by 36
He, H., Singh, I., Wek, S. A., Dey, S., Baird, T. D., Wek, R. C., & Georgiadis, M. M. (2014) · Journal of Biological Chemistry · doi:10.1074/jbc.m114.560789 · Cited by 33
Carnevalli, L. S., Pereira, C. M., Longo, B. M., Jaqueta, C. B., Avedissian, M., Mello, L. E., & Castilho, B. A. (2004) · Neuroscience Letters · doi:10.1016/j.neulet.2003.12.093 · Cited by 21
Huang, C. C., Chiribau, C.-B., Majumder, M., Chiang, C., Wek, R. C., Kelm, R. J., Khalili, K., Snider, M. D., & Hatzoglou, M. (2009) · Journal of Biological Chemistry · doi:10.1074/jbc.m109.024471 · Cited by 13
Taft, R. A., Low, B. E., Byers, S. L., Murray, S. A., Kutny, P. M., & Wiles, M. V. (2013) · PLoS ONE · doi:10.1371/journal.pone.0067826 · Cited by 13
Codon-specific interaction of uncharged transfer-RNA with eukaryotic ribosomes
Murchie, M.-J., & Leader, D. P. (1978) · Biochimica et Biophysica Acta (BBA) - Nucleic Acids and Protein Synthesis · doi:10.1016/0005-2787(78)90024-2 · Cited by 12
Siegel, S. J., & Swenson, P. A. (1964) · Journal of Cellular and Comparative Physiology · doi:10.1002/jcp.1030630216 · Cited by 12
Puglisi, J. D. (2006) · The FASEB Journal · doi:10.1096/fasebj.20.5.a889-c · Cited by 1
Cited by
Sorted by citations
The integrated stress response: From mechanism to disease
Costa-Mattioli, M., & Walter, P. (2020) · Science · doi:10.1126/science.aat5314 · Cited by 1,617
mRNA structure regulates protein expression through changes in functional half-life
Mauger, D. M., Cabral, B. J., Presnyak, V., Su, S. V., Reid, D. W., Goodman, B., Link, K., Khatwani, N., Reynders, J., Moore, M. J., et al. (2019) · Proceedings of the National Academy of Sciences · doi:10.1073/pnas.1908052116 · Cited by 555
Ribosome collisions trigger general stress responses to regulate cell fate
Wu, C. C.-C., Peterson, A. F., Zinshteyn, B., Regot, S., & Green, R. (2020) · Cell · doi:10.1016/j.cell.2020.06.006 · Cited by 503
UPRmt regulation and output: a stress response mediated by mitochondrial-nuclear communication
Melber, A., & Haynes, C. M. (2018) · Cell Research · doi:10.1038/cr.2018.16 · Cited by 498
The emerging complexity of the tRNA world: mammalian tRNAs beyond protein synthesis
SCHIMMEL, P. R. (2017) · Nature Reviews Molecular Cell Biology · doi:10.1038/nrm.2017.77 · Cited by 471
Metadata
- Authors
- Ishimura, R., Nagy, G., Dotu, I., Chuang, J. H., & Ackerman, S. L.
- Affiliations
- Howard Hughes Medical Institute (US)
- Research Programme on Biomedical Informatics, Department of Experimental and Health Sciences, Universitat Pompeu Fabra, Barcelona, Spain
- The Jackson Laboratory for Genomic Medicine (US)
- Corresponding author
- Ackerman, Susan L
- Venue
- eLife
- Publisher
- eLife Sciences Publications, Ltd
- Published
- 2016-04-16
- Volume
- 5
- ISSN
- 2050-084X (ISSN-L)
- PMC
- PMC4917338
- OpenAlex
- W2341404981
- Cited by
- 221
- References
- 92
- Citations by year
- 2026: 27 · 2025: 38 · 2024: 31 · 2023: 23 · 2022: 19 · 2021: 25 · 2020: 24 · 2019: 14 · 2018: 14 · 2017: 6
- FWCI
- 5.89
- Type
- journal article
- Language
- en
- Open access
- gold
- doi.org
- Licence
- Locations
- eLife (publishedVersion, cc-by)
- Europe PMC (PubMed Central) (publishedVersion, cc-by)
- PubMed Central (publishedVersion, cc-by)
- PubMed (publishedVersion)
- DOAJ (DOAJ: Directory of Open Access Journals) (submittedVersion, cc-by-sa)
- eScholarship (California Digital Library) (submittedVersion)
- eScholarship (California Digital Library) (submittedVersion, cc-by)
- The Mouseion at the JAXlibrary (Jackson Laboratory) (submittedVersion)
- Repositori digital de la UPF (Universitat Pompeu Fabra) (submittedVersion, cc-by)
- Funders
- National Institute of Neurological Disorders and Stroke (NS094637)
- Howard Hughes Medical Institute
- National Human Genome Research Institute (HG007554)
- Topics
- Life Sciences › Biochemistry, Genetics and Molecular Biology › Molecular Biology › RNA and protein synthesis mechanisms
- Life Sciences › Biochemistry, Genetics and Molecular Biology › Cell Biology › Endoplasmic Reticulum Stress and Disease
- Life Sciences › Biochemistry, Genetics and Molecular Biology › Cell Biology › Autophagy in Disease and Therapy
- Keywords
- GCN2, ribosome stalling, translation elongation, translation initiation, integrated stress response, eIF2α phosphorylation, ATF4, neurodegeneration, neuronal stress response, neuronal survival
- MeSH terms
- Animals, Mice, Inbred C57BL, Neurons, Peptide Chain Elongation, Translational, Peptide Chain Initiation, Translational, Phosphorylation, Protein Processing, Post-Translational, Ribosomes, RNA, Transfer, Arg, Eukaryotic Initiation Factor-2, Protein Serine-Threonine Kinases, GTP-Binding Proteins, Gene Expression Profiling, Activating Transcription Factor 4
About these checks
Registry, retraction, Cites and statistics results are computed, not judged, with one exception: a printed reference that no index lists is read once by a model before it counts as a citation error. Claims are extracted by a model and kept only when their quote appears verbatim in the text; each cited source is then checked, with a model’s help, for whether it says what the claim relies on. Those verdicts can be wrong — read the claim’s quote and the cited source before relying on one.
Statistics and arithmetic are recomputed, not judged.
Confidence bands are shown only for fields calibrated on our annotated test set. None is calibrated yet, so no band is shown.
What counts as a claim ›How we measure confidence ›How we check this ›
Are you an author, or do you see a problem with this page? Request a review
