

The DOI matches its Crossref record; 90 of the 90 references it cites were found in a registry or an index.
A selective gut bacterial bile salt hydrolase alters host metabolism
Open accessAbstract
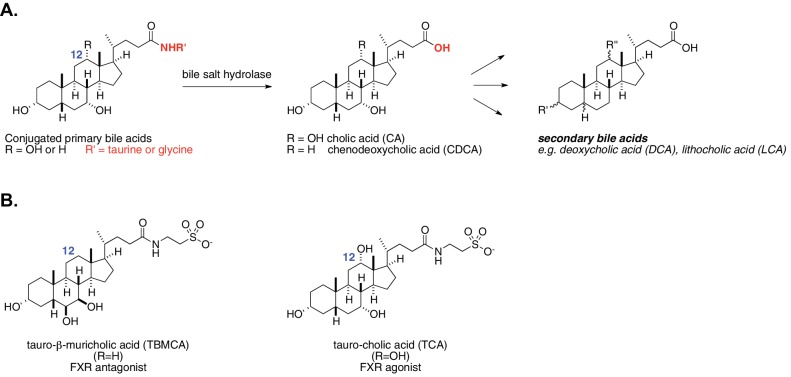
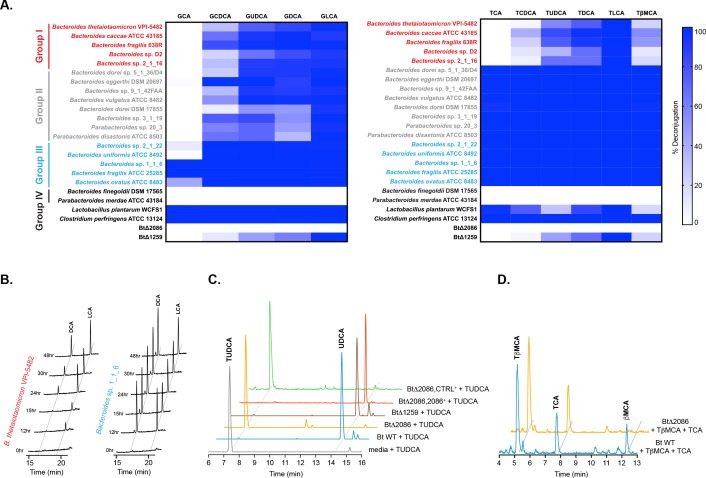
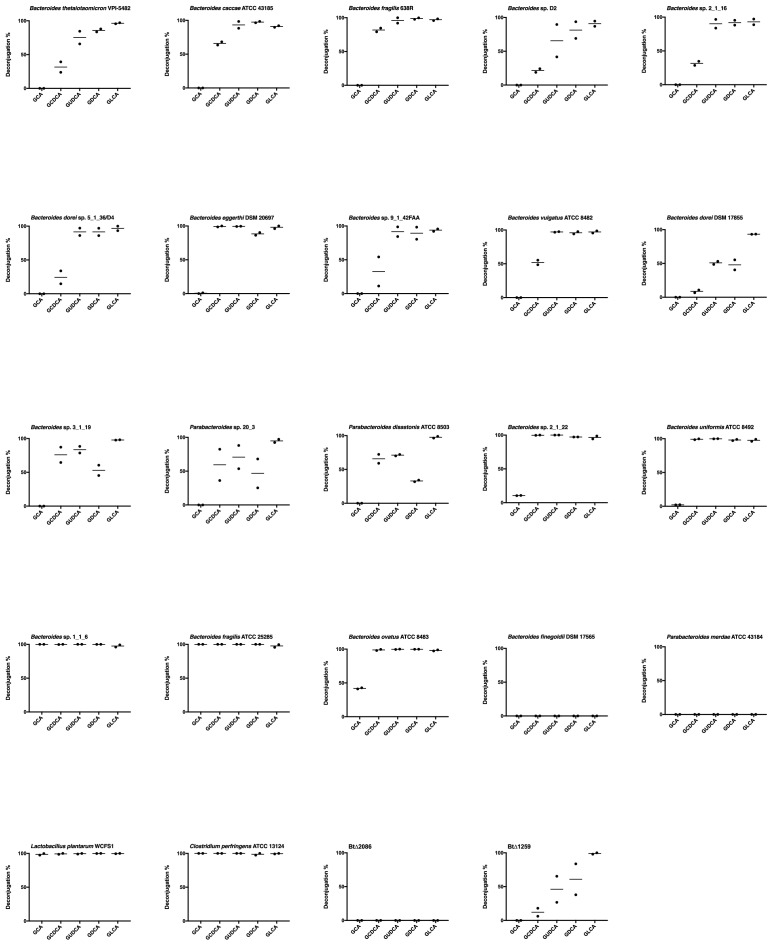
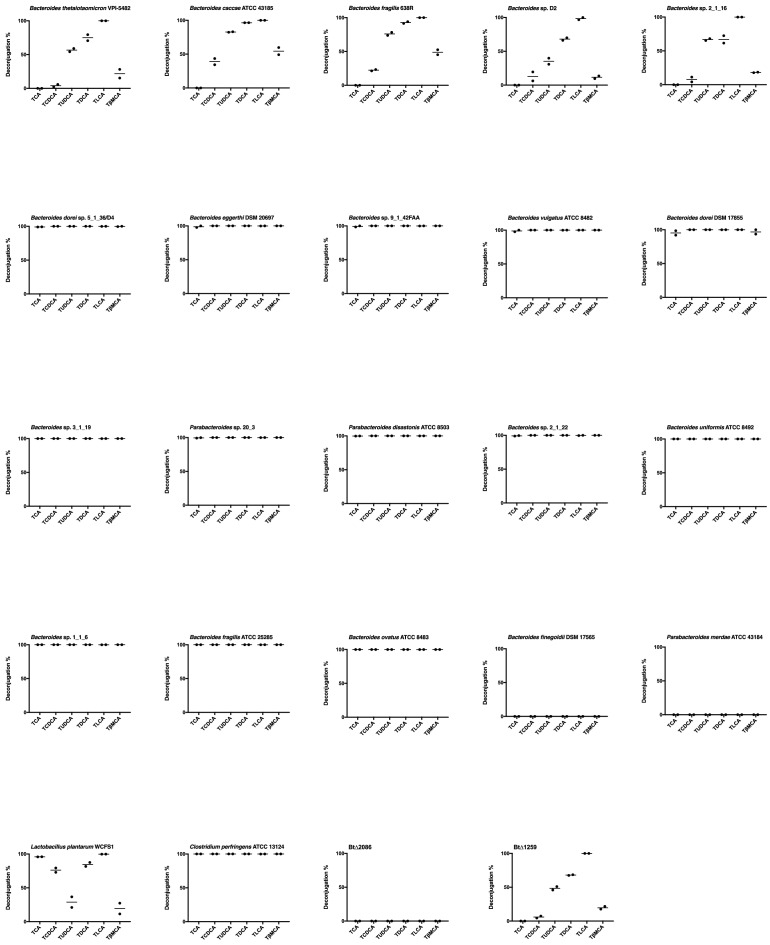
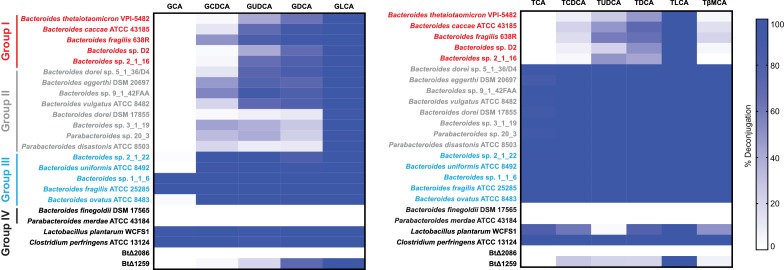
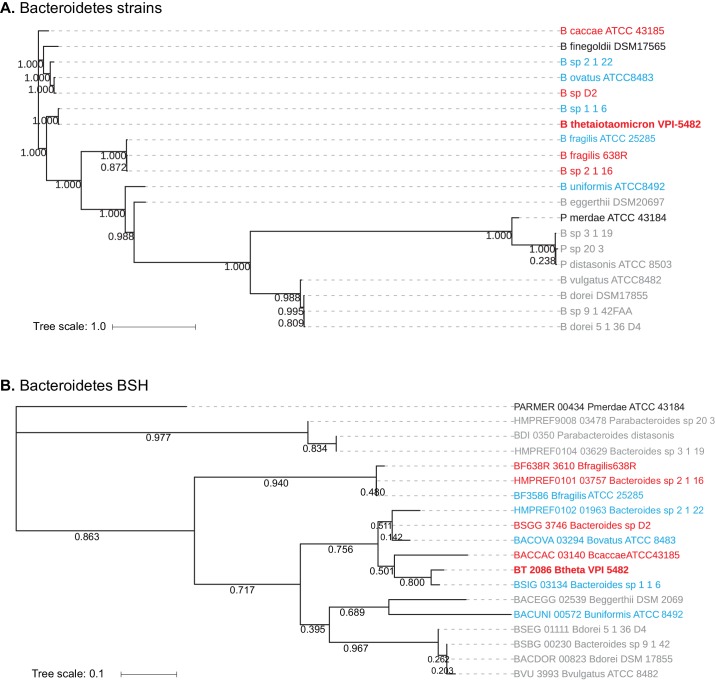
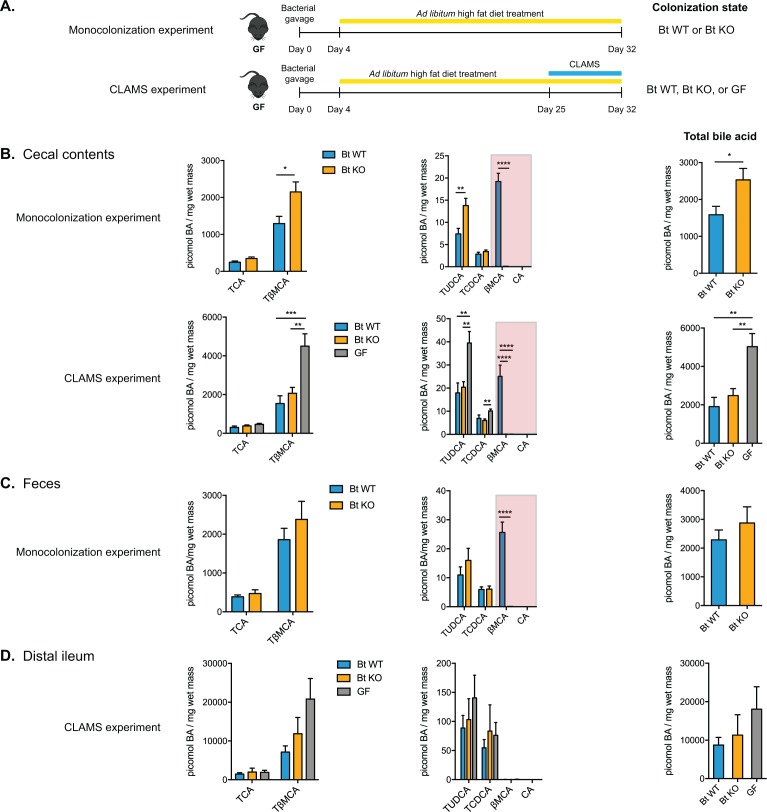
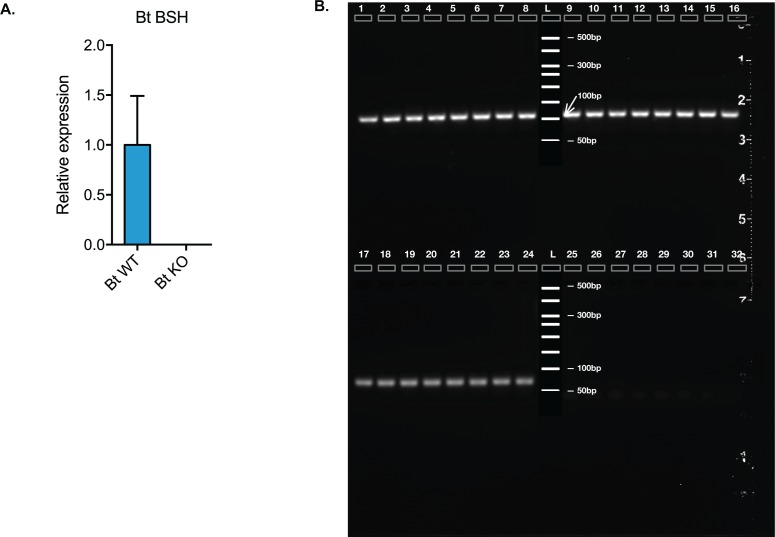
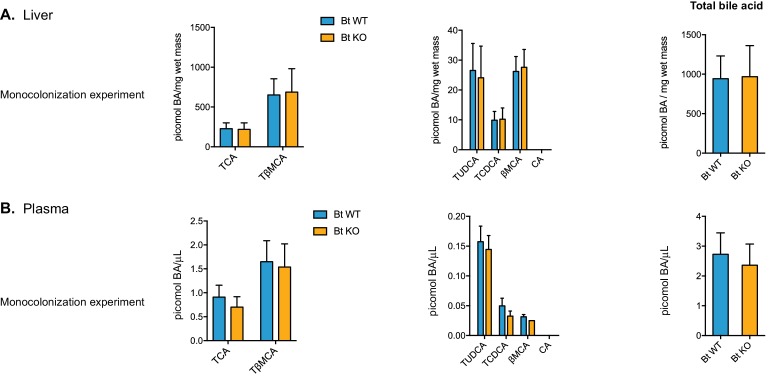
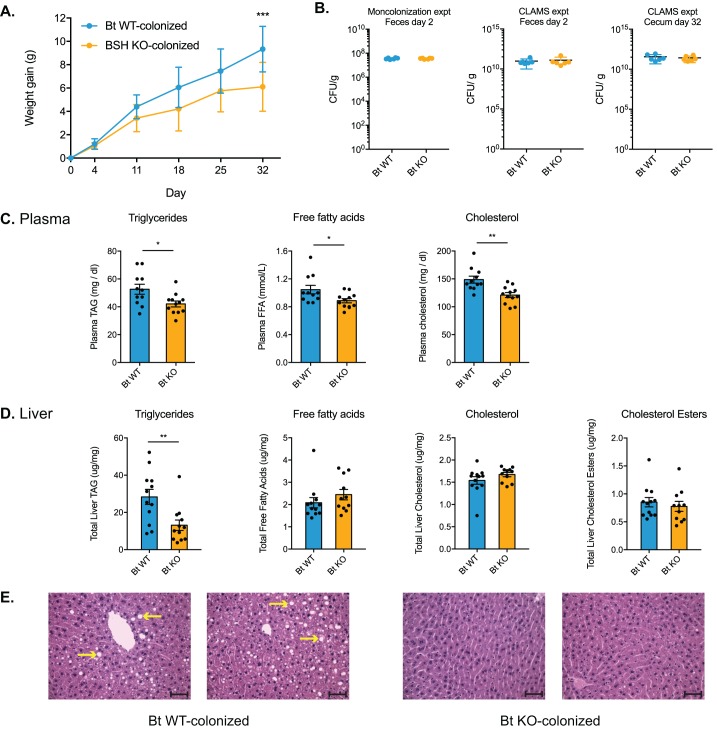
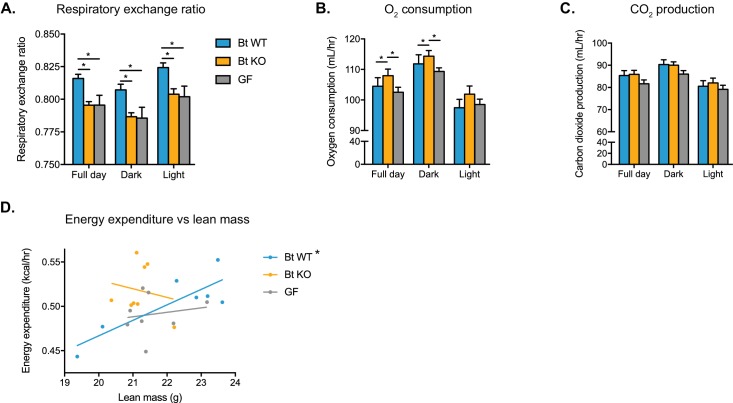
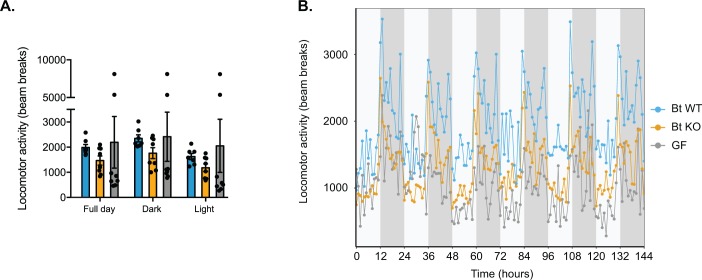
The human gut microbiota impacts host metabolism and has been implicated in the pathophysiology of obesity and metabolic syndromes. However, defining the roles of specific microbial activities and metabolites on host phenotypes has proven challenging due to the complexity of the microbiome-host ecosystem. Here, we identify strains from the abundant gut bacterial phylum Bacteroidetes that display selective bile salt hydrolase (BSH) activity. Using isogenic strains of wild-type and BSH-deleted Bacteroides thetaiotaomicron, we selectively modulated the levels of the bile acid tauro-β-muricholic acid in monocolonized gnotobiotic mice. B. thetaiotaomicron BSH mutant-colonized mice displayed altered metabolism, including reduced weight gain and respiratory exchange ratios, as well as transcriptional changes in metabolic, circadian rhythm, and immune pathways in the gut and liver. Our results demonstrate that metabolites generated by a single microbial gene and enzymatic activity can profoundly alter host metabolism and gene expression at local and organism-level scales.
Overview
The claims and statistics of this paper haven’t been checked yet.
Run the check — free, no account needed. It reads the open-access text and checks the sources it cites.
Integrity signals
Registry
Cites
Statistics
Figures
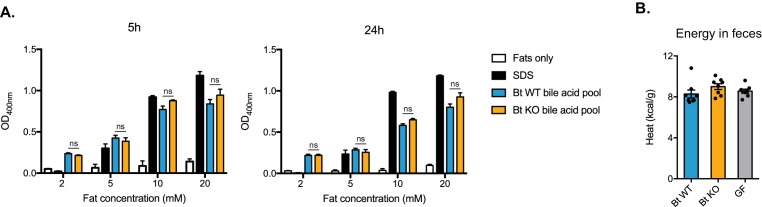
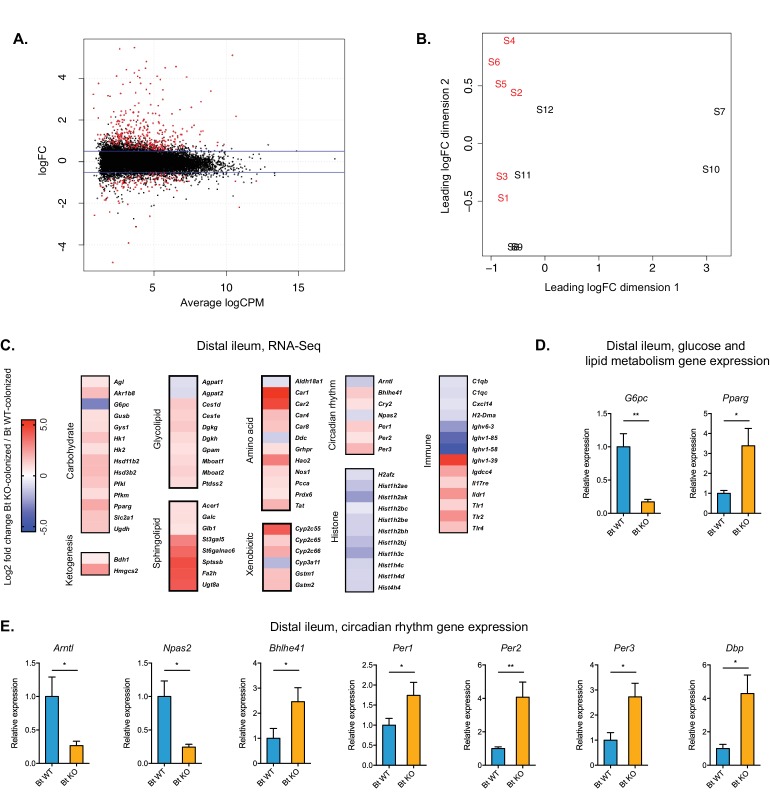
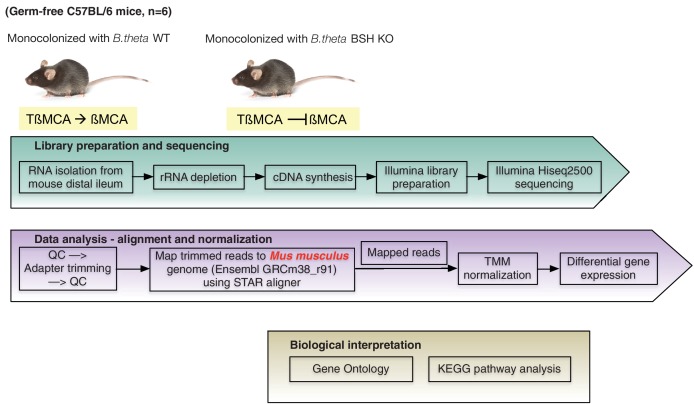
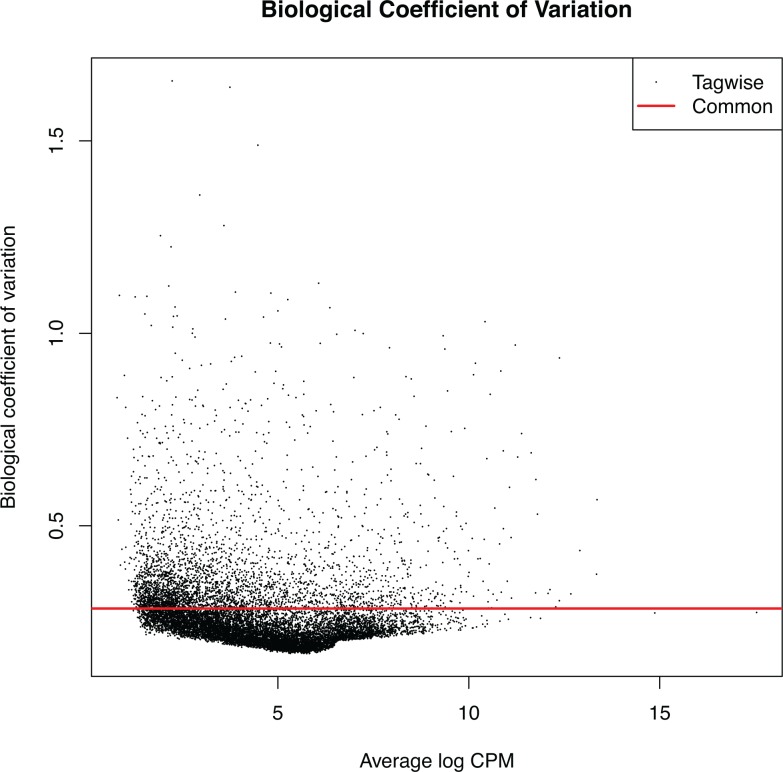
Verification
Claims the paper makes
The claims and statistics of this paper haven’t been checked yet.
Run the check — free, no account needed. It reads the open-access text and checks the sources it cites.
Claims other papers make about this one
Each is checked against this paper’s own text: does it say what the citing paper says it does?
The source backs part of the claim, not all of it — or backs it for a different population, condition or comparison.
In the citing paper
“B. Dorei possesses high BSH activity in vitro (Yao et al., 2018)”
From Bacteroides dorei BDX-01 alleviates DSS-induced experimental colitis in mice by regulating intestinal bile salt hydrolase activity and the FXR-NLRP3 signaling pathway (2023) · cites this paper as Yao et al., 2018
Experimental — accuracy not yet measured
Self-check
Percentages, sums and reported differences re-computed from the paper’s own numbers.
The self-check needs the paper’s full text.
Citations
Cites
Analysis of Relative Gene Expression Data Using Real-Time Quantitative PCR and the 2−ΔΔCT Method
Livak, K. J., & Schmittgen, T. D. (2001) · Methods · doi:10.1006/meth.2001.1262 · Cited by 180,860
A SIMPLE METHOD FOR THE ISOLATION AND PURIFICATION OF TOTAL LIPIDES FROM ANIMAL TISSUES
Folch, J., Lees, M., & Stanley, G. H. S. (1957) · Journal of Biological Chemistry · doi:10.1016/s0021-9258(18)64849-5 · Cited by 65,189
STAR: ultrafast universal RNA-seq aligner
Dobin, A., Davis, C. A., Schlesinger, F., Drenkow, J., Zaleski, C., Jha, S., Batut, P., Chaisson, M., & Gingeras, T. R. (2013) · Bioinformatics · doi:10.1093/bioinformatics/bts635 · Cited by 51,709
MUSCLE: multiple sequence alignment with high accuracy and high throughput
Edgar, R. C. (2004) · Nucleic Acids Research · doi:10.1093/nar/gkh340 · Cited by 44,662
Robinson, M. D., McCarthy, D. J., & Smyth, G. K. (2010) · Bioinformatics · doi:10.1093/bioinformatics/btp616 · Cited by 41,364
Guindon, S., Dufayard, J.-F., Lefort, V., Anisimova, M., Hordijk, W., & Gascuel, O. (2010) · Systematic Biology · doi:10.1093/sysbio/syq010 · Cited by 18,376
An obesity-associated gut microbiome with increased capacity for energy harvest
Turnbaugh, P. J., Ley, R. E., Mahowald, M. A., Magrini, V., Mardis, E. R., & Gordon, J. I. (2006) · Nature · doi:10.1038/nature05414 · Cited by 12,444
Structure, function and diversity of the healthy human microbiome
The Human Microbiome Project Consortium (2012) · Nature · doi:10.1038/nature11234 · Cited by 11,726
MultiQC: summarize analysis results for multiple tools and samples in a single report
Ewels, P., Magnusson, M., Lundin, S., & Käller, M. (2016) · Bioinformatics · doi:10.1093/bioinformatics/btw354 · Cited by 10,143
Human gut microbes associated with obesity
Ley, R. E., Turnbaugh, P. J., Klein, S., & Gordon, J. I. (2006) · Nature · doi:10.1038/4441022a · Cited by 8,785
Research works printed but not linked: 1
- Andrews S, 2010, FastQC: A Quality Control Tool for High Throughput Sequence Data
Cited by
Sorted by citations
Bile acid metabolites control TH17 and Treg cell differentiation
Hang, S., Paik, D., Yao, L., Kim, E., Trinath, J., Lu, J., Ha, S., Nelson, B. N., Kelly, S. P., Wu, L., et al. (2019) · Nature · doi:10.1038/s41586-019-1785-z · Cited by 1,457
Self-citationMicrobial bile acid metabolites modulate gut RORγ+ regulatory T cell homeostasis
Song, X., Sun, X., Oh, S. F., Wu, M., Zhang, Y., Zheng, W., Geva-Zatorsky, N., Jupp, R., Mathis, D., Benoist, C., et al. (2020) · Nature · doi:10.1038/s41586-019-1865-0 · Cited by 1,024
Gut microbiota-derived bile acids in intestinal immunity, inflammation, and tumorigenesis
Cai, J., Sun, L., & Gonzalez, F. J. (2022) · Cell Host & Microbe · doi:10.1016/j.chom.2022.02.004 · Cited by 892
Human gut bacteria produce ΤΗ17-modulating bile acid metabolites
Paik, D., Yao, L., Zhang, Y., Bae, S., D’Agostino, G. D., Zhang, M., Kim, E., Franzosa, E. A., Avila-Pacheco, J., Bisanz, J. E., et al. (2022) · Nature · doi:10.1038/s41586-022-04480-z · Cited by 594
Song, Z., Cai, Y., Lao, X., Wang, X., Lin, X., Cui, Y., Kalavagunta, P. K., Liao, J., Jin, L., Shang, J., et al. (2019) · Microbiome · doi:10.1186/s40168-019-0628-3 · Cited by 505
Bile Acids as Metabolic Regulators and Nutrient Sensors
Chiang, J. Y. L., & Ferrell, J. M. (2019) · Annual Review of Nutrition · doi:10.1146/annurev-nutr-082018-124344 · Cited by 456
Gut microbiota Turicibacter strains differentially modify bile acids and host lipids
Lynch, J. B., Gonzalez, E. L., Choy, K., Faull, K. F., Jewell, T., Arellano, A., Liang, J., Yu, K. B., Paramo, J., & Hsiao, E. Y. (2023) · Nature Communications · doi:10.1038/s41467-023-39403-7 · Cited by 373
Bile acids in glucose metabolism and insulin signalling — mechanisms and research needs
Ahmad, T. R., & Haeusler, R. A. (2019) · Nature Reviews Endocrinology · doi:10.1038/s41574-019-0266-7 · Cited by 348
Plichta, D. R., Graham, D. B., Subramanian, S., & Xavier, R. J. (2019) · Cell · doi:10.1016/j.cell.2019.07.045 · Cited by 316
A bacterial bile acid metabolite modulates Treg activity through the nuclear hormone receptor NR4A1
Li, W., Hang, S., Fang, Y., Bae, S., Zhang, Y., Zhang, M., Wang, G., McCurry, M. D., Bae, M., Paik, D., et al. (2021) · Cell Host & Microbe · doi:10.1016/j.chom.2021.07.013 · Cited by 306
Cholesterol Metabolism by Uncultured Human Gut Bacteria Influences Host Cholesterol Level
Kenny, D. J., Plichta, D. R., Shungin, D., Koppel, N., Hall, A. B., Fu, B., Vasan, R. S., Shaw, S. Y., Vlamakis, H. C., Balskus, E. P., et al. (2020) · Cell Host & Microbe · doi:10.1016/j.chom.2020.05.013 · Cited by 319
Tavella, T., Rampelli, S., Guidarelli, G., Bazzocchi, A., Gasperini, C., Pujos‐Guillot, E., Comte, B., Barone, M., Biagi, E., Candela, M., et al. (2021) · Gut Microbes · doi:10.1080/19490976.2021.1880221 · Cited by 310
Green, M., Arora, K., & Prakash, S. (2020) · International Journal of Molecular Sciences · doi:10.3390/ijms21082890 · Cited by 309
The gut microbiome and hypertension
O’Donnell, J. A., Zheng, T., Méric, G., & Marques, F. Z. (2023) · Nature Reviews Nephrology · doi:10.1038/s41581-022-00654-0 · Cited by 302
Foley, M. H., O’Flaherty, S., Barrangou, R., & Theriot, C. M. (2019) · PLOS Pathogens · doi:10.1371/journal.ppat.1007581 · Cited by 271
Microbial impact on cholesterol and bile acid metabolism: current status and future prospects
Kriaa, A., Bourgin, M., Potiron, A., Mkaouar, H., Jablaoui, A., Gérard, P., Maguin, E., & Rhimi, M. (2019) · Journal of Lipid Research · doi:10.1194/jlr.r088989 · Cited by 264
Otaru, N., Ye, K., Mujezinovic, D., Berchtold, L., Constancias, F., Cornejo, F. A., Krzystek, A., de Wouters, T., Braegger, C., Lacroix, C., et al. (2021) · Frontiers in Microbiology · doi:10.3389/fmicb.2021.656895 · Cited by 253
Bile Acids Are Substrates for Amine N-Acyl Transferase Activity by Bile Salt Hydrolase
Patterson, A., Rimal, B., Collins, S., Granda, M., Koo, I., Solanka, S., Hoque, N., Gentry, E., Yan, T., Bisanz, J., et al. (2022) · doi:10.21203/rs.3.rs-2050120/v1 · Cited by 252
Inulin fibre promotes microbiota-derived bile acids and type 2 inflammation
Arifuzzaman, M., Won, T. H., Li, T., Yano, H., Digumarthi, S., Heras, A. F., Zhang, W., Parkhurst, C. N., Kashyap, S., Jin, W., et al. (2022) · Nature · doi:10.1038/s41586-022-05380-y · Cited by 240
The changing metabolic landscape of bile acids – keys to metabolism and immune regulation
Mohanty, I., Allaband, C., Mannochio-Russo, H., Abiead, Y. E., Hagey, L. R., Knight, R. D., & Dorrestein, P. C. (2024) · Nature Reviews Gastroenterology & Hepatology · doi:10.1038/s41575-024-00914-3 · Cited by 236
Jia, B., Zou, Y., Han, X., Bae, J., & Jeon, C. O. (2022) · Trends in Microbiology · doi:10.1016/j.tim.2022.08.003 · Cited by 220
Foley, M. H., O’Flaherty, S., Allen, G., Rivera, A. J., Stewart, A. K., Barrangou, R., & Theriot, C. M. (2021) · Proceedings of the National Academy of Sciences · doi:10.1073/pnas.2017709118 · Cited by 205
Wu, Q., Liang, X., Wang, K., Lin, J., Wang, X., Wang, P., Zhang, Y., Nie, Q., Liu, H., Zhang, Z., et al. (2021) · Cell Metabolism · doi:10.1016/j.cmet.2021.07.007 · Cited by 201
When Rhythms Meet the Blues: Circadian Interactions with the Microbiota-Gut-Brain Axis
Teichman, E. M., O’Riordan, K. J., Gahan, C. G. M., Dinan, T. G., & Cryan, J. F. (2020) · Cell Metabolism · doi:10.1016/j.cmet.2020.02.008 · Cited by 199
Sharpton, S. R., Schnabl, B., Knight, R., & Loomba, R. (2021) · Cell Metabolism · doi:10.1016/j.cmet.2020.11.010 · Cited by 194
Another renaissance for bile acid gastrointestinal microbiology
Ridlon, J. M., & Gaskins, H. R. (2024) · Nature Reviews Gastroenterology & Hepatology · doi:10.1038/s41575-024-00896-2 · Cited by 205
The gut microbiota and its interactions with cardiovascular disease
Xu, H., Wang, X., Feng, W., Liu, Q., Zhou, S., Liu, Q., & Cai, L. (2020) · Microbial Biotechnology · doi:10.1111/1751-7915.13524 · Cited by 196
Crosstalk between bile acid-activated receptors and microbiome in entero-hepatic inflammation
Thibaut, M. M., & Bindels, L. B. (2022) · Trends in Molecular Medicine · doi:10.1016/j.molmed.2021.12.006 · Cited by 193
Foley, M. H., Walker, M. E., Stewart, A. K., O’Flaherty, S., Gentry, E. C., Patel, S., Beaty, V. V., Allen, G., Pan, M., Simpson, J. B., et al. (2023) · Nature Microbiology · doi:10.1038/s41564-023-01337-7 · Cited by 181
Intersection of the Gut Microbiome and Circadian Rhythms in Metabolism
Frazier, K., & Chang, E. B. (2019) · Trends in Endocrinology and Metabolism · doi:10.1016/j.tem.2019.08.013 · Cited by 171
Zhang, H.-Y., Tian, J., Lian, F., Li, M., Liu, W., Zhong, Z., Liao, J., & Tong, X. (2020) · Biomedicine & Pharmacotherapy · doi:10.1016/j.biopha.2020.110857 · Cited by 166
Liu, H., Shiver, A. L., Price, M. N., Carlson, H. K., Trotter, V. V., Chen, Y., Escalante, V., Ray, J., Hern, K. E., Petzold, C. J., et al. (2021) · Cell Reports · doi:10.1016/j.celrep.2021.108789 · Cited by 157
Deconstructing Mechanisms of Diet-Microbiome-Immune Interactions
Alexander, M., & Turnbaugh, P. J. (2020) · Immunity · doi:10.1016/j.immuni.2020.07.015 · Cited by 151
Intestinal transgene delivery with native E. coli chassis allows persistent physiological changes
Russell, B. J., Brown, S. D., Siguenza, N., Mai, I., Saran, A. R., Lingaraju, A., Maissy, E. S., Dantas Machado, A. C., Pinto, A. F. M., Sanchez, C., et al. (2022) · Cell · doi:10.1016/j.cell.2022.06.050 · Cited by 151
Bariatric surgery reveals a gut-restricted TGR5 agonist with anti-diabetic effects
Chaudhari, S. N., Harris, D. A., Aliakbarian, H., Luo, J. N., Henke, M. T., Subramaniam, R., Vernon, A. H., Tavakkoli, A., Sheu, E. G., & Devlin, A. S. (2020) · Nature Chemical Biology · doi:10.1038/s41589-020-0604-z · Cited by 150
Bile Salt Hydrolases: At the Crossroads of Microbiota and Human Health
Bourgin, M., Kriaa, A., Mkaouar, H., Mariaule, V., Jablaoui, A., Maguin, E., & Rhimi, M. (2021) · Microorganisms · doi:10.3390/microorganisms9061122 · Cited by 152
A microbial metabolite remodels the gut-liver axis following bariatric surgery
Chaudhari, S. N., Luo, J. N., Harris, D. A., Aliakbarian, H., Yao, L., Paik, D., Subramaniam, R., Adhikari, A. A., Vernon, A. H., Kılıç, A., et al. (2021) · Cell Host & Microbe · doi:10.1016/j.chom.2020.12.004 · Cited by 143
Jia, B., Park, D., Hahn, Y., & Jeon, C. O. (2020) · Gut Microbes · doi:10.1080/19490976.2020.1748261 · Cited by 139
Yan, Y., Yu, L., Qu, Y., Fan, Z., Zhang, T., Xu, Y., Du, Q., Brügger, D., Chen, Y., Zhang, K., et al. (2023) · npj Biofilms and Microbiomes · doi:10.1038/s41522-023-00420-5 · Cited by 136
microbeMASST: a taxonomically informed mass spectrometry search tool for microbial metabolomics data
Zuffa, S., Schmid, R., Bauermeister, A., Gomes, P. W. P., Caraballo‐Rodríguez, A. M., Abiead, Y. E., Aron, A. T., Gentry, E. C., Zemlin, J., Meehan, M. J., et al. (2024) · Nature Microbiology · doi:10.1038/s41564-023-01575-9 · Cited by 137
Ding, Y., Yanagi, K., Cheng, C., Alaniz, R. C., Lee, K., & Jayaraman, A. (2019) · Pharmacological Research · doi:10.1016/j.phrs.2019.01.029 · Cited by 125
The path toward using microbial metabolites as therapies
Descamps, H. C., Herrmann, B. I., Wiredu, D., & Thaiss, C. A. (2019) · EBioMedicine · doi:10.1016/j.ebiom.2019.05.063 · Cited by 123
Bile salt hydrolase in non-enterotoxigenic Bacteroides potentiates colorectal cancer
Sun, L., Zhang, Y., Cai, J., Rimal, B., Rocha, E. R., Coleman, J. P., Zhang, C., Nichols, R. G., Luo, Y., Kim, B., et al. (2023) · Nature Communications · doi:10.1038/s41467-023-36089-9 · Cited by 130
Deciphering diet-gut microbiota-host interplay: Investigations of pectin
Tan, H., & Nie, S. (2020) · Trends in Food Science & Technology · doi:10.1016/j.tifs.2020.10.010 · Cited by 122
Genetic circuit design automation for the gut resident species Bacteroides thetaiotaomicron
Taketani, M., Zhang, J., Zhang, S., Triassi, A. J., Huang, Y.-J., Griffith, L. G., & Voigt, C. A. (2020) · Nature Biotechnology · doi:10.1038/s41587-020-0468-5 · Cited by 117
Development of a covalent inhibitor of gut bacterial bile salt hydrolases
Adhikari, A. A., Seegar, T. C. M., Ficarro, S. B., McCurry, M. D., Ramachandran, D., Yao, L., Chaudhari, S. N., Ndousse-Fetter, S., Banks, A. S., Marto, J. A., et al. (2020) · Nature Chemical Biology · doi:10.1038/s41589-020-0467-3 · Cited by 116
Bile acid metabolism and circadian rhythms
Yang, Y., & Zhang, J. (2020) · American Journal of Physiology-Gastrointestinal and Liver Physiology · doi:10.1152/ajpgi.00152.2020 · Cited by 118
Microbial Hydroxysteroid Dehydrogenases: From Alpha to Omega
Doden, H. L., & Ridlon, J. M. (2021) · Microorganisms · doi:10.3390/microorganisms9030469 · Cited by 113
Bogatyrev, S. R., Rolando, J. C., & Ismagilov, R. F. (2020) · Microbiome · doi:10.1186/s40168-020-0785-4 · Cited by 111
Restructuring the Gut Microbiota by Intermittent Fasting Lowers Blood Pressure
Shi, H., Zhang, B., Abo‐Hamzy, T., Nelson, J. W., Ambati, C. S. R., Petrosino, J. F., Bryan, R. M., & Durgan, D. J. (2021) · Circulation Research · doi:10.1161/circresaha.120.318155 · Cited by 114
Avuthu, N., & Guda, C. (2022) · Microbiology Spectrum · doi:10.1128/spectrum.00013-22 · Cited by 114
The Microbiota and the Gut–Brain Axis in Controlling Food Intake and Energy Homeostasis
Romaní‐Pérez, M., Bullich‐Vilarrubias, C., López‐Almela, I., Liébana-García, R., Olivares, M., & Sanz, Y. (2021) · International Journal of Molecular Sciences · doi:10.3390/ijms22115830 · Cited by 117
Mangalea, M. R., Páez-Espino, D., Kieft, K., Chatterjee, A., Chriswell, M. E., Seifert, J. A., Feser, M. L., Demoruelle, M. K., Sakatos, A., Anantharaman, K., et al. (2021) · Cell Host & Microbe · doi:10.1016/j.chom.2021.03.020 · Cited by 102
Intersection of Polycystic Ovary Syndrome and the Gut Microbiome
Rizk, M. G., & Thackray, V. G. (2021) · Journal of the Endocrine Society · doi:10.1210/jendso/bvaa177 · Cited by 104
Physiological Role of Bile Acids Modified by the Gut Microbiome
Kiriyama, Y., & Nochi, H. (2021) · Microorganisms · doi:10.3390/microorganisms10010068 · Cited by 105
Gut microbiota-derived metabolites in CRC progression and causation
Dalal, N., Jalandra, R., Bayal, N., Yadav, A. K., Harshulika, Sharma, M., Makharia, G. K., Kumar, P., Singh, R. K., Solanki, P. R., et al. (2021) · Journal of Cancer Research and Clinical Oncology · doi:10.1007/s00432-021-03729-w · Cited by 105
Wang, F., Zhao, C., Tian, G., Wei, X., Ma, Z., Cui, J., Wei, R., Bao, Y., Kong, W., & Zheng, J. (2020) · Journal of Agricultural and Food Chemistry · doi:10.1021/acs.jafc.0c05800 · Cited by 98
Yun, C., Yan, S., Liao, B., Ding, Y., Qi, X., Zhao, M., Wang, K., Zhuo, Y., Nie, Q., Ye, C., et al. (2024) · Nature Metabolism · doi:10.1038/s42255-024-01041-8 · Cited by 103
Aw, W. C., Towarnicki, S. G., Melvin, R. G., Youngson, N. A., Garvin, M. R., Hu, Y., Nielsen, S., Thomas, T., Pickford, R., Bustamante, S., et al. (2018) · PLoS Genetics · doi:10.1371/journal.pgen.1007735 · Cited by 97
Chemoproteomic Profiling of Gut Microbiota-Associated Bile Salt Hydrolase Activity
Parasar, B., Zhou, H., Xiao, X., Shi, Q., Brito, I., & Chang, P. V. (2019) · ACS Central Science · doi:10.1021/acscentsci.9b00147 · Cited by 94
Diet-gut microbiota interactions on cardiovascular disease
Zhang, X., & Gérard, P. (2022) · Computational and Structural Biotechnology Journal · doi:10.1016/j.csbj.2022.03.028 · Cited by 98
A biosynthetic pathway for the selective sulfonation of steroidal metabolites by human gut bacteria
Yao, L., D’Agostino, G. D., Park, J., Hang, S., Adhikari, A. A., Zhang, Y., Li, W., Ávila-Pacheco, J., Bae, S., Clish, C. B., et al. (2022) · Nature Microbiology · doi:10.1038/s41564-022-01176-y · Cited by 96
Busnelli, M., Manzini, S., & Chiesa, G. (2019) · Nutrients · doi:10.3390/nu12010079 · Cited by 92
Agolino, G., Pino, A., Vaccalluzzo, A., Cristofolini, M., Solieri, L., Caggia, C., & Randazzo, C. L. (2024) · Journal of Functional Foods · doi:10.1016/j.jff.2024.106357 · Cited by 99
Pathak, P., Helsley, R. N., Brown, A. L., Buffa, J. A., Choucair, I., Nemet, I., Baleanu‐Gogonea, C., Gogonea, V., Wang, Z., Garcı́a-Garcı́a, J. C., et al. (2020) · American Journal of Physiology-Heart and Circulatory Physiology · doi:10.1152/ajpheart.00584.2019 · Cited by 89
Immunology of bile acids regulated receptors
Fiorucci, S., Marchianò, S., Urbani, G., Giorgio, C. D., Distrutti, E., Zampella, A., & Biagioli, M. (2024) · Progress in Lipid Research · doi:10.1016/j.plipres.2024.101291 · Cited by 88
Host metabolism balances microbial regulation of bile acid signalling
Won, T. H., Arifuzzaman, M., Parkhurst, C. N., Miranda, I. C., Zhang, B., Hu, E., Kashyap, S., Letourneau, J., Jin, W., Fu, Y., et al. (2025) · Nature · doi:10.1038/s41586-024-08379-9 · Cited by 100
Microbiota in Gut‐Heart Axis: Metabolites and Mechanisms in Cardiovascular Disease
Kondapalli, N. B., Katari, V., Dalal, K. K., Paruchuri, S. M., & Thodeti, C. K. (2025) · Comprehensive physiology · doi:10.1002/cph4.70024 · Cited by 98
Messengers From the Gut: Gut Microbiota-Derived Metabolites on Host Regulation
Li, C., Liang, Y., & Qiao, Y. (2022) · Frontiers in Microbiology · doi:10.3389/fmicb.2022.863407 · Cited by 88
Chains of evidence from correlations to causal molecules in microbiome-linked diseases
Chaudhari, S. N., McCurry, M. D., & Devlin, A. S. (2021) · Nature Chemical Biology · doi:10.1038/s41589-021-00861-z · Cited by 82
Tudela, H., Claus, S. P., & Saleh, M. (2021) · Frontiers in Cell and Developmental Biology · doi:10.3389/fcell.2021.719072 · Cited by 81
CRISPR/Cas-Based Genome Editing for Human Gut Commensal Bacteroides Species
Zheng, L., Tan, Y., Hu, Y., Shen, J., Qu, Z., Chen, X., Ho, C. L., Leung, E. L., Zhao, W., & Dai, L. (2022) · ACS Synthetic Biology · doi:10.1021/acssynbio.1c00543 · Cited by 82
Proal, A. D., & Marshall, T. G. (2018) · Frontiers in Pediatrics · doi:10.3389/fped.2018.00373 · Cited by 81
Rekdal, V. M., Bernardino, P. N., Luescher, M. U., Kiamehr, S., Le, C.-D., Bisanz, J. E., Turnbaugh, P. J., Bess, E. N., & Balskus, E. P. (2020) · eLife · doi:10.7554/elife.50845 · Cited by 76
Campbell, D. E., Ly, L. K., Ridlon, J. M., Hsiao, A., Whitaker, R. J., & Degnan, P. H. (2020) · Cell Reports · doi:10.1016/j.celrep.2020.108142 · Cited by 80
Bile Acid Signaling in Metabolic and Inflammatory Diseases and Drug Development
Li, T., & Chiang, J. Y. L. (2024) · Pharmacological Reviews · doi:10.1124/pharmrev.124.000978 · Cited by 85
Convergent evolution of bacterial ceramide synthesis
Stankeviciute, G., Tang, P., Ashley, B., Chamberlain, J. D., Hansen, M. E. B., Coleman, A., D’Emilia, R., Fu, L., Mohan, E. C., Nguyen, H. X., et al. (2021) · Nature Chemical Biology · doi:10.1038/s41589-021-00948-7 · Cited by 76
Keller, L. J., Babin, B. M., Lakemeyer, M., & Bogyo, M. S. (2019) · Current Opinion in Chemical Biology · doi:10.1016/j.cbpa.2019.10.007 · Cited by 72
Ning, K., Lu, K., Chen, Q., Guo, Z., Du, X., Riaz, F., Feng, L., Fu, Y., Yin, C., Zhang, F., et al. (2020) · ACS Omega · doi:10.1021/acsomega.0c01689 · Cited by 70
Ranaivo, H., Thirion, F., Béra‐Maillet, C., Guilly, S., Simon, C., Sothier, M., Berghe, L. V. D., Feugier, N., Lambert-Porcheron, S., Dussous, I., et al. (2022) · Gut Microbes · doi:10.1080/19490976.2022.2044722 · Cited by 69
The N-space Episenome unifies cellular information space-time within cognition-based evolution
Miller, W. B., Torday, J. S., & Baluška, F. (2019) · Progress in Biophysics and Molecular Biology · doi:10.1016/j.pbiomolbio.2019.08.006 · Cited by 70
Bile Acid and Cholesterol Metabolism in Atherosclerotic Cardiovascular Disease and Therapy
Chiang, J. Y. L., Ferrell, J. M., Wu, Y., & Boehme, S. (2020) · Cardiology Plus · doi:10.4103/2470-7511.305419 · Cited by 68
Lindner, S., Miltiadous, O., Ramos, R. J. J. F., Paredes, J., Kousa, A. I., Dai, A., Fei, T., Lauder, E., Frame, J., Waters, N. R., et al. (2024) · Nature Microbiology · doi:10.1038/s41564-024-01617-w · Cited by 74
Bile Salt Hydrolase-Competent Probiotics in the Management of IBD: Unlocking the “Bile Acid Code”
Gadaleta, R. M., Cariello, M., Crudele, L., & Moschetta, A. (2022) · Nutrients · doi:10.3390/nu14153212 · Cited by 67
Hayashi, N., Lai, Y., Fuerte-Stone, J., Mimee, M., & Lu, T. K. (2024) · Nature Communications · doi:10.1038/s41467-024-45893-w · Cited by 68
New insights into microbial bile salt hydrolases: from physiological roles to potential applications
Dong, Z., Yang, S., Tang, C., Li, D., Kan, Y., & Yao, L. (2025) · Frontiers in Microbiology · doi:10.3389/fmicb.2025.1513541 · Cited by 64
Self-citationPathogen Colonization Resistance in the Gut and Its Manipulation for Improved Health
Pickard, J. M., & Núñez, G. (2019) · American Journal Of Pathology · doi:10.1016/j.ajpath.2019.03.003 · Cited by 68
Zhang, H., Xie, Y., Cao, F., & Song, X. (2024) · Gut Microbes · doi:10.1080/19490976.2024.2382336 · Cited by 71
Bile acid analogues are activators of pyrin inflammasome
Alimov, I., Menon, S., Cochran, N., Maher, R., Wang, Q., Alford, J., Concannon, J. B., Yang, Z., Harrington, E., Llamas, L., et al. (2019) · Journal of Biological Chemistry · doi:10.1074/jbc.ra118.005103 · Cited by 64
Gut microbiome and metabolites, the future direction of diagnosis and treatment of atherosclerosis?
Cao, H., Zhu, Y., Hu, G., Zhang, Q., & Zheng, L. (2022) · Pharmacological Research · doi:10.1016/j.phrs.2022.106586 · Cited by 64
Role of Bile Acids in Dysbiosis and Treatment of Nonalcoholic Fatty Liver Disease
Wang, C., Zhu, C., Shao, L., Ye, J., Shen, Y., & Ren, Y. (2019) · Mediators of Inflammation · doi:10.1155/2019/7659509 · Cited by 67
Genetic Engineering of Resident Bacteria in the Gut Microbiome
Arnold, J. H., Glazier, J., & Mimee, M. (2023) · Journal of Bacteriology · doi:10.1128/jb.00127-23 · Cited by 64
Balance between bile acid conjugation and hydrolysis activity can alter outcomes of gut inflammation
Fu, Y., Guzior, D. V., Okros, M., Bridges, C., Rosset, S. L., Gonzalez, C. T., Christian Martin, H., Karunarathne, H., Watson, V. E., & Quinn, R. A. (2025) · Nature Communications · doi:10.1038/s41467-025-58649-x · Cited by 71
Zhou, C., Wang, Y., Li, C., Xie, Z., & Dai, L. (2023) · Microbiology Spectrum · doi:10.1128/spectrum.03330-22 · Cited by 65
The gut microbiota-bile acid axis: a crucial regulator of immune function and metabolic health
Tyagi, A., & Kumar, V. (2025) · World Journal of Microbiology and Biotechnology · doi:10.1007/s11274-025-04395-7 · Cited by 68
Identification and Characterization of Major Bile Acid 7α-Dehydroxylating Bacteria in the Human Gut
Kim, K. H., Park, D., Jia, B., Baek, J. H., Hahn, Y., & Jeon, C. O. (2022) · mSystems · doi:10.1128/msystems.00455-22 · Cited by 66
Zhao, M., Jiafeng, Z., Yang, H., Ouyang, Z., Lv, C., Geng, Z., & Zhao, J. (2025) · Biomedicine & Pharmacotherapy · doi:10.1016/j.biopha.2025.118182 · Cited by 69
Li, D. K., Chaudhari, S. N., Sojoodi, M., Lee, Y., Adhikari, A. A., Zukerberg, L. R., Shroff, S. G., Barrett, S. C., Tanabe, K. K., Chung, R. T., et al. (2022) · Science Advances · doi:10.1126/sciadv.abo2794 · Cited by 59
Li, X., Zhao, W., Meng, X., Yu, L., Chen, Q., Hu, X., Zhao, Y., Xiong, L., Chen, X., Wang, X., et al. (2022) · Journal of Ethnopharmacology · doi:10.1016/j.jep.2022.115333 · Cited by 58
Integrating the gut microbiome and pharmacology
Verdegaal, A. A., & Goodman, A. L. (2024) · Science Translational Medicine · doi:10.1126/scitranslmed.adg8357 · Cited by 67
Metadata
- Authors
- Yao, L., Seaton, S. C., Ndousse-Fetter, S., Adhikari, A. A., DiBenedetto, N., Mina, A. I., Banks, A. S., Bry, L., & Devlin, A. S.
- Affiliations
- Harvard University (US)
- Brigham and Women's Hospital (US)
- Corresponding author
- Devlin, A Sloan
- Venue
- eLife
- Publisher
- eLife Sciences Publications, Ltd
- Published
- 2018-07-17
- Volume
- 7
- ISSN
- 2050-084X (ISSN-L)
- PMC
- PMC6078496
- OpenAlex
- W2884910880
- Cited by
- 274
- References
- 90
- Citations by year
- 2026: 28 · 2025: 33 · 2024: 41 · 2023: 28 · 2022: 45 · 2021: 41 · 2020: 32 · 2019: 23 · 2018: 3
- FWCI
- 8.81
- Type
- journal article
- Language
- en
- Open access
- gold
- doi.org
- Licence
- Locations
- eLife (publishedVersion, cc-by)
- Europe PMC (PubMed Central) (publishedVersion, cc-by)
- PubMed Central (publishedVersion, cc-by)
- PubMed (publishedVersion)
- DOAJ (DOAJ: Directory of Open Access Journals) (submittedVersion, cc-by-sa)
- Funders
- National Institutes of Health (P30DK034854)
- Wellington Postdoctoral Fellowship
- Massachusetts Institute of Technology (Center for Microbiome Informatics and Therapeutics – Innovation Award)
- Karin Grunebaum Cancer Research Foundation (Junior Faculty Award)
- Topics
- Life Sciences › Biochemistry, Genetics and Molecular Biology › Molecular Biology › Gut microbiota and health
- Health Sciences › Medicine › Oncology › Drug Transport and Resistance Mechanisms
- Health Sciences › Dentistry › Periodontics › Oral microbiology and periodontitis research
- Keywords
- bile salt hydrolase, Bacteroides thetaiotaomicron, gut microbiota, host metabolism, bile acids, obesity, metabolic syndrome, gnotobiotic mice, respiratory exchange ratio, circadian rhythm, immune gene expression, microbial metabolites
- MeSH terms
- Bacteroides thetaiotaomicron, Host Microbial Interactions, Amidohydrolases, Animals, Body Weight, Circadian Rhythm, Germ-Free Life, Immunity, Intestines, Liver, Metabolism, Respiration, Taurocholic Acid, Gene Expression Profiling, Gastrointestinal Tract, Mice
About these checks
Registry, retraction, Cites and statistics results are computed, not judged, with one exception: a printed reference that no index lists is read once by a model before it counts as a citation error. Claims are extracted by a model and kept only when their quote appears verbatim in the text; each cited source is then checked, with a model’s help, for whether it says what the claim relies on. Those verdicts can be wrong — read the claim’s quote and the cited source before relying on one.
Statistics and arithmetic are recomputed, not judged.
Confidence bands are shown only for fields calibrated on our annotated test set. None is calibrated yet, so no band is shown.
What counts as a claim ›How we measure confidence ›How we check this ›
Are you an author, or do you see a problem with this page? Request a review
