Cited by 227

The DOI matches its Crossref record; 12 of the 12 references it cites were found in a registry or an index.

Distinct mechanisms of microRNA sorting into cancer cell-derived extracellular vesicle subtypes

Temoche-Diaz, Morayma M, Shurtleff, Matthew J, Nottingham, Ryan M, Yao, Jun, Fadadu, Raj P, Lambowitz, Alan M, Schekman, Randy·2019·eLife

Published version of a preprint

Abstract

Extracellular vesicles (EVs) encompass a variety of vesicles secreted into the extracellular space. EVs have been implicated in promoting tumor metastasis, but the molecular composition of tumor-derived EV sub-types and the mechanisms by which molecules are sorted into EVs remain mostly unknown. We report the separation of two small EV sub-populations from a metastatic breast cancer cell line, with biochemical features consistent with different sub-cellular origins. These EV sub-types use different mechanisms of miRNA sorting (selective and non-selective), suggesting that sorting occurs via fundamentally distinct processes, possibly dependent on EV origin. Using biochemical and genetic tools, we identified the Lupus La protein as mediating sorting of selectively packaged miRNAs. We found that two motifs embedded in miR-122 are responsible for high-affinity binding to Lupus La and sorting into vesicles formed in a cell-free reaction. Thus, tumor cells can simultaneously deploy multiple EV species using distinct sorting mechanisms that may enable diverse functions in normal and cancer biology.

Overview

The claims and statistics of this paper haven’t been checked yet.

Run the check — free, no account needed. It reads the open-access text and checks the sources it cites.

A few free checks a day · papers already verified open instantly · results are public

Integrity signals

Registry

Crossref · 10.7554/elife.47544

Cites

12 of 12 references verified0 citation errors · 0 not checkable

Statistics

Figures
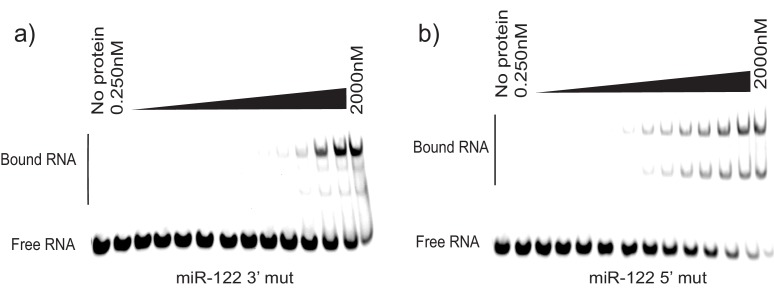
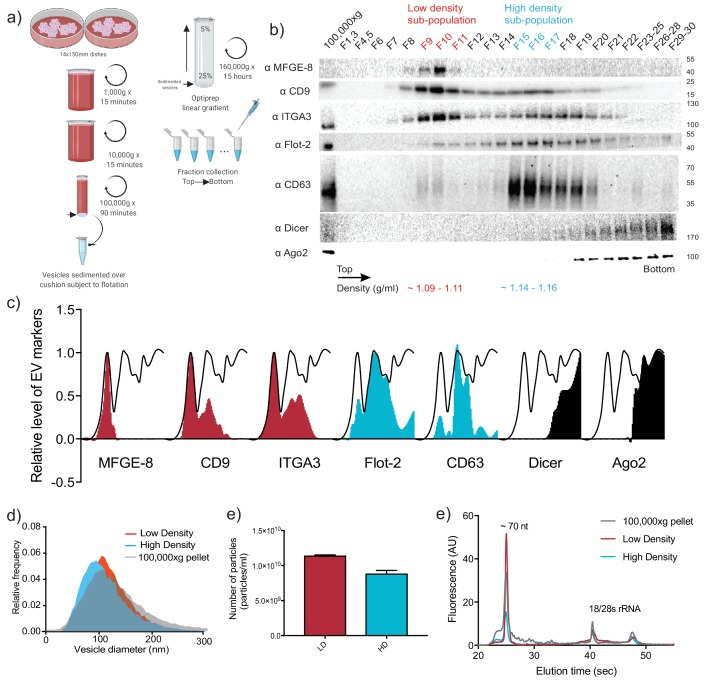
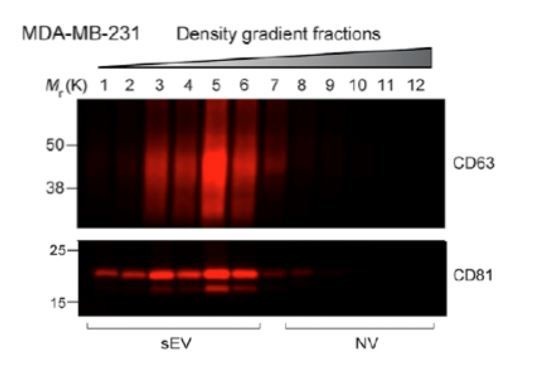
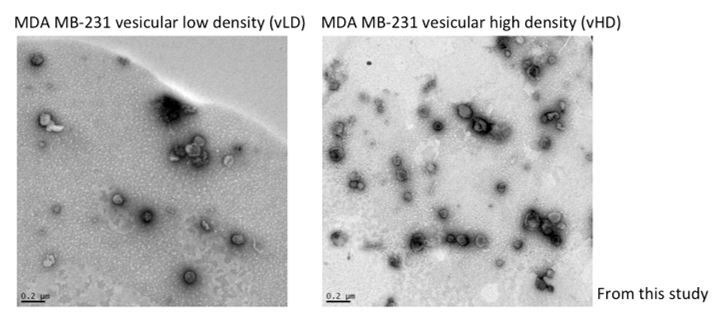
Figure 1. Two biochemically distinct sEV sub-populations are released by MDA-MB-231 cells. (a) Schematic showing the two-step purification methodology. Differential ultracentrifugation was followed by buoyant density flotation in a linear iodixanol gradient (Figure 1—figure supplement 1). (b) Immunoblot across the iodixanol gradient for classical sEV markers as well as other non-vesicular RNP components. The two discrete sub-populations are indicated. CD63, a glycosylated protein, migrates heterogeneously. (c) Quantification of individual proteins as in 1b. The black line delineates the maximum signal across the gradient showing three distinctive areas. The first, second and third peak represent the vLD, vHD and non-vesicular RNP fractions. (d) Nanoparticle tracking analysis showing the size distribution of the vHD and vLD sub-populations. The high-speed pellet is also shown. (d) Quantification of the particle number per sEV sub-population using Nanoparticle tracking analysis. Data plotted are from two independent experiments; error bars represent standard deviation from independent samples. (e) Bioanalyzer analysis of the vHD and vLD RNA. The high-speed pellet RNA is also shown.
Figure 1. Two biochemically distinct sEV sub-populations are released by MDA-MB-231 cells. (a) Schematic showing the two-step purification methodology. Differential ultracentrifugation was followed by buoyant density flotation in a linear iodixanol gradient (Figure 1—figure supplement 1). (b) Immunoblot across the iodixanol gradient for classical sEV markers as well as other non-vesicular RNP components. The two discrete sub-populations are indicated. CD63, a glycosylated protein, migrates heterogeneously. (c) Quantification of individual proteins as in 1b. The black line delineates the maximum signal across the gradient showing three distinctive areas. The first, second and third peak represent the vLD, vHD and non-vesicular RNP fractions. (d) Nanoparticle tracking analysis showing the size distribution of the vHD and vLD sub-populations. The high-speed pellet is also shown. (d) Quantification of the particle number per sEV sub-population using Nanoparticle tracking analysis. Data plotted are from two independent experiments; error bars represent standard deviation from independent samples. (e) Bioanalyzer analysis of the vHD and vLD RNA. The high-speed pellet RNA is also shown.CC BY · PubMed Central
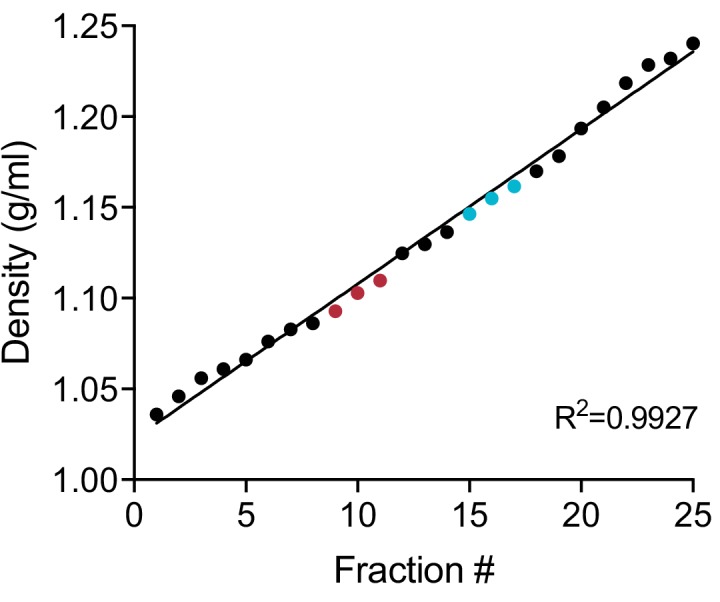
Figure 1—figure supplement 1. Linearity of iodixanol density gradient. Calculated iodixanol fraction densities collected from the top to bottom of the gradient (fractions 1 to 25) as measured by refractometry (Figure 1—figure supplement 1—source data 1). Fractions were collected post 160,000 g ultracentrifugation (Figure 1a). In red, fractions corresponding to the vLD sub-population. In blue, fractions corresponding to the vHD sub-population.
Figure 1—figure supplement 1. Linearity of iodixanol density gradient. Calculated iodixanol fraction densities collected from the top to bottom of the gradient (fractions 1 to 25) as measured by refractometry (Figure 1—figure supplement 1—source data 1). Fractions were collected post 160,000 g ultracentrifugation (Figure 1a). In red, fractions corresponding to the vLD sub-population. In blue, fractions corresponding to the vHD sub-population.CC BY · PubMed Central
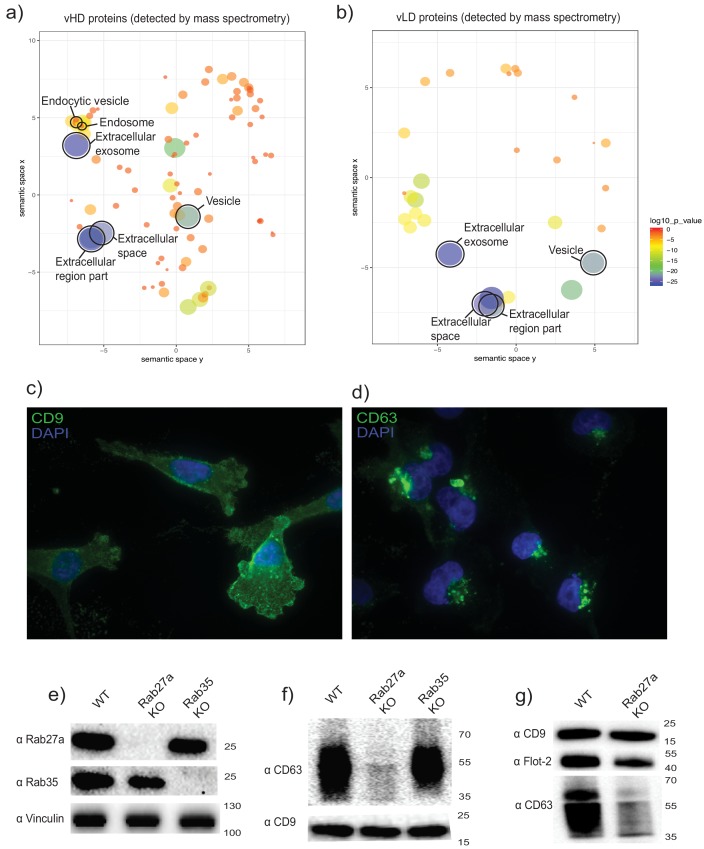
Figure 2. The two biochemically distinct sEV sub-populations co-fractionate with membranes of different sub-cellular origin. (a, b) Gene ontology analysis for sub-cellular localization of proteins that coincide with vHD and vLD proteins detected by mass spectrometry. The gene ontology analysis platform compares the list of proteins given per group to the human genome frequency. The detection of enrichment for a certain organelle/localization is represented as circles, with the size of circles correlating to log10 p-value. (c, d) Immunofluorescence for two tetraspanins enriched in each sEV sub-population. CD9 and CD63 enriched in vLD and vHD respectively. (e) Analysis of WT, CRISPR-Cas9 Rab27a KO and CRISPR-Cas9 Rab35 KO by immunoblot. Rab27a, Rab35 and vinculin are shown. (f) Immunoblots for CD63 and CD9 in sEVs secreted by WT, Rab27a KO cells and Rab35 KO cells. The amounts of loaded sEVs were normalized by total cell number. (g) Immunoblots for CD63, CD9 and flotillin-2 in sEVs secreted by WT and Rab27a KO cells. The amounts of loaded sEVs were normalized by total cell number.
Figure 2. The two biochemically distinct sEV sub-populations co-fractionate with membranes of different sub-cellular origin. (a, b) Gene ontology analysis for sub-cellular localization of proteins that coincide with vHD and vLD proteins detected by mass spectrometry. The gene ontology analysis platform compares the list of proteins given per group to the human genome frequency. The detection of enrichment for a certain organelle/localization is represented as circles, with the size of circles correlating to log10 p-value. (c, d) Immunofluorescence for two tetraspanins enriched in each sEV sub-population. CD9 and CD63 enriched in vLD and vHD respectively. (e) Analysis of WT, CRISPR-Cas9 Rab27a KO and CRISPR-Cas9 Rab35 KO by immunoblot. Rab27a, Rab35 and vinculin are shown. (f) Immunoblots for CD63 and CD9 in sEVs secreted by WT, Rab27a KO cells and Rab35 KO cells. The amounts of loaded sEVs were normalized by total cell number. (g) Immunoblots for CD63, CD9 and flotillin-2 in sEVs secreted by WT and Rab27a KO cells. The amounts of loaded sEVs were normalized by total cell number.CC BY · PubMed Central
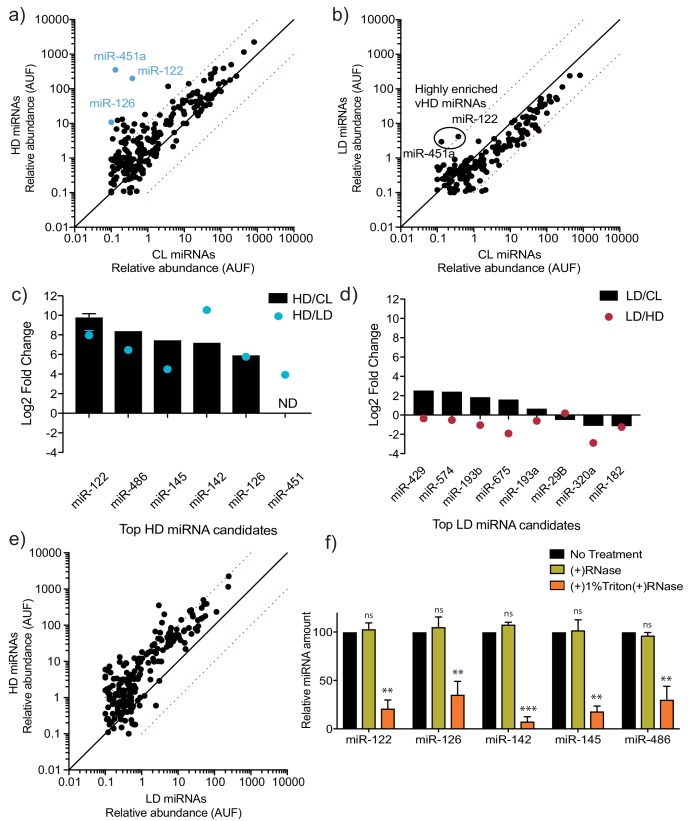
Figure 3. MicroRNA profiling of high buoyant density and low buoyant density sEV sub-populations. (a, b) Scatterplots showing the relative abundance (as arbitrary units of fluorescence (AUF)) for miRNAs detected in vHD and vLD sub-populations relative to cellular levels, as detected by Firefly profiling and normalized per ng of total RNA. In blue, vHD miRNAs that were selected for further validation by RT-qPCR. Circled miRNAs in vLD represent those also found to be enriched in the vHD-subpopulation. (c, d) Log2 fold change for top vHD and vLD candidate miRNAs in vHD or vLD relative to cells (vHD/CL or vLD/CL, respectively) and vHD relative to vLD or vice versa (vHD/vLD or vLD/vHD, respectively). MiRNA species were quantified by RT-qPCR and normalized per ng of total RNA. Data plotted for miR-122 are from three independent experiments (biological replicates), each independent experiment with triplicate qPCR reactions; error bars represent standard deviation from independent samples. (e) Scatterplots showing relative abundance of miRNAs (AUF) detected in vHD and vLD sub-populations normalized per ng of total RNA, as detected by Firefly profiling. (f) RNase protection of highly enriched vHD miRNAs quantified by qPCR. Isolated sEVs were treated with or without RNase If and or Triton X-100. Data plotted are from two independent experiments, each independent experiment with triplicate qPCR reactions; error bars represent standard deviation from independent samples. Statistical significance was performed using Student’s t-test (**p<0.01, ***p<0.001, ns = not significant). CL: cellular lysate. Dashed red lines in a, b and e, represent 10-fold differences.
Figure 3. MicroRNA profiling of high buoyant density and low buoyant density sEV sub-populations. (a, b) Scatterplots showing the relative abundance (as arbitrary units of fluorescence (AUF)) for miRNAs detected in vHD and vLD sub-populations relative to cellular levels, as detected by Firefly profiling and normalized per ng of total RNA. In blue, vHD miRNAs that were selected for further validation by RT-qPCR. Circled miRNAs in vLD represent those also found to be enriched in the vHD-subpopulation. (c, d) Log2 fold change for top vHD and vLD candidate miRNAs in vHD or vLD relative to cells (vHD/CL or vLD/CL, respectively) and vHD relative to vLD or vice versa (vHD/vLD or vLD/vHD, respectively). MiRNA species were quantified by RT-qPCR and normalized per ng of total RNA. Data plotted for miR-122 are from three independent experiments (biological replicates), each independent experiment with triplicate qPCR reactions; error bars represent standard deviation from independent samples. (e) Scatterplots showing relative abundance of miRNAs (AUF) detected in vHD and vLD sub-populations normalized per ng of total RNA, as detected by Firefly profiling. (f) RNase protection of highly enriched vHD miRNAs quantified by qPCR. Isolated sEVs were treated with or without RNase If and or Triton X-100. Data plotted are from two independent experiments, each independent experiment with triplicate qPCR reactions; error bars represent standard deviation from independent samples. Statistical significance was performed using Student’s t-test (**p<0.01, ***p<0.001, ns = not significant). CL: cellular lysate. Dashed red lines in a, b and e, represent 10-fold differences.CC BY · PubMed Central
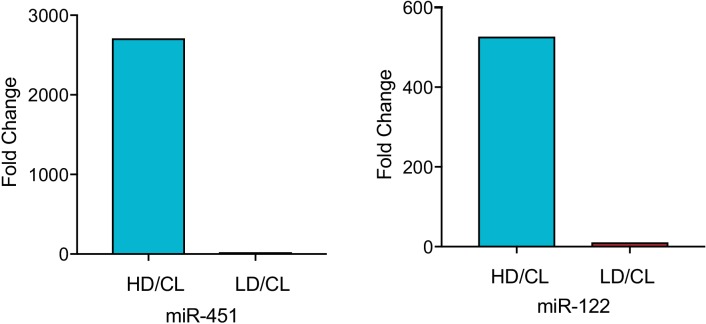
Figure 3—figure supplement 1. MiR-122 and miR-451 are highly enriched in the vHD sub-population. Fold difference vHD/CL or vLD/CL for miR-451a and miR-122. Data extracted from Firefly profiling. CL: cellular lysate.
Figure 3—figure supplement 1. MiR-122 and miR-451 are highly enriched in the vHD sub-population. Fold difference vHD/CL or vLD/CL for miR-451a and miR-122. Data extracted from Firefly profiling. CL: cellular lysate.CC BY · PubMed Central
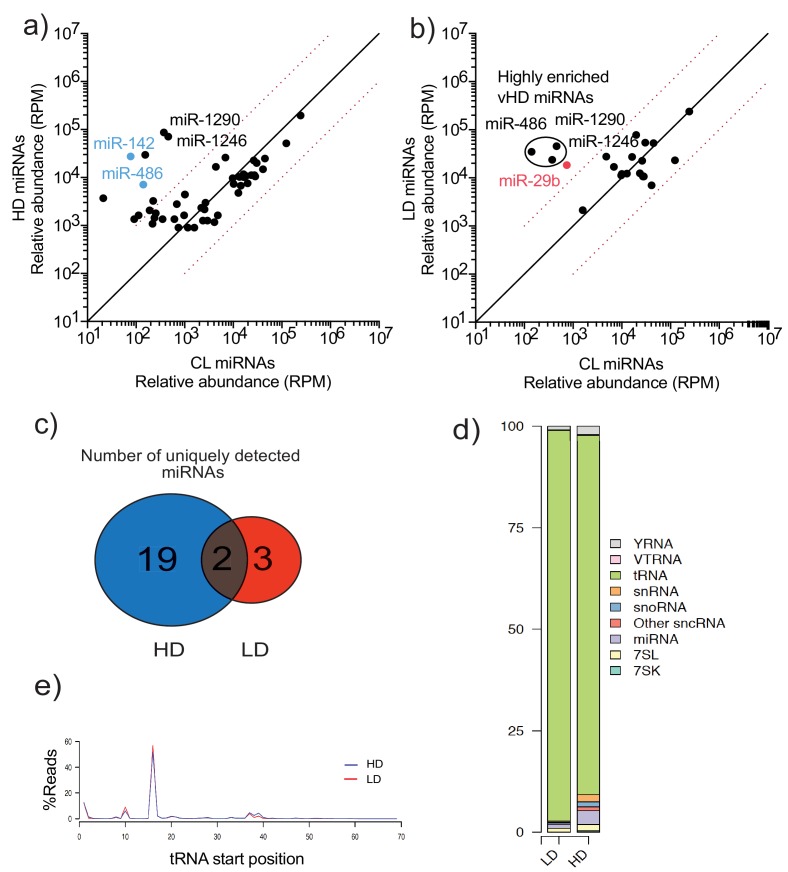
Figure 3—figure supplement 2. TGIRT-sequencing of high buoyant density and low buoyant density sEV sub-populations. (a, b) Scatterplots showing the relative abundance (as reads per million (RPM)) for miRNAs detected in vHD and vLD sub-populations relative to CL levels. Normalized per total number of miRNA reads. In blue, vHD miRNAs that were selected for further validation by qPCR. In red, vLD miRNAs selected for further validation by qPCR. Circled miRNAs in vLD represent those also found to be enriched in the vHD-subpopulation c) Venn Diagram showing the total number of vHD and vLD uniquely found miRNAs (miRNAs with non-detectable signal in cellular lysates) detected by TGIRT-seq. (d) Bar graph showing the distribution of all small non-coding RNA transcripts found in vHD and vLD sub-populations. (e) tRNA start site distribution showing the majority of tRNA reads start at position 16, previously described as the site of an EV-specific D-loop modification (Shurtleff et al., 2017). The putative D-loop modification is present at relatively same levels in both the vHD and vLD sub-populations. CL: cellular lysate. Dashed red lines in a and b represent 10-fold differences.
Figure 3—figure supplement 2. TGIRT-sequencing of high buoyant density and low buoyant density sEV sub-populations. (a, b) Scatterplots showing the relative abundance (as reads per million (RPM)) for miRNAs detected in vHD and vLD sub-populations relative to CL levels. Normalized per total number of miRNA reads. In blue, vHD miRNAs that were selected for further validation by qPCR. In red, vLD miRNAs selected for further validation by qPCR. Circled miRNAs in vLD represent those also found to be enriched in the vHD-subpopulation c) Venn Diagram showing the total number of vHD and vLD uniquely found miRNAs (miRNAs with non-detectable signal in cellular lysates) detected by TGIRT-seq. (d) Bar graph showing the distribution of all small non-coding RNA transcripts found in vHD and vLD sub-populations. (e) tRNA start site distribution showing the majority of tRNA reads start at position 16, previously described as the site of an EV-specific D-loop modification (Shurtleff et al., 2017). The putative D-loop modification is present at relatively same levels in both the vHD and vLD sub-populations. CL: cellular lysate. Dashed red lines in a and b represent 10-fold differences.CC BY · PubMed Central
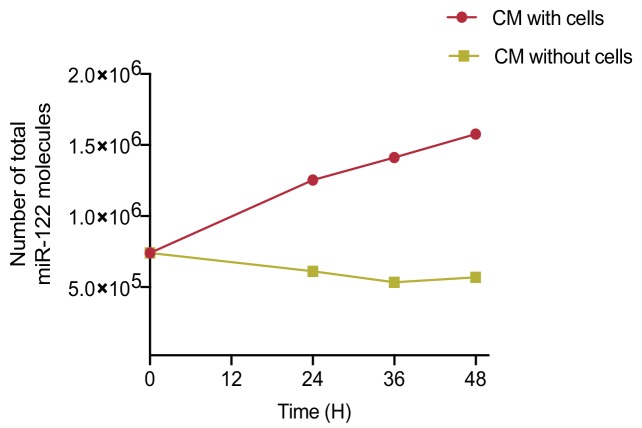
Figure 3—figure supplement 3. MiR-122 accumulates in conditioned media (CM) over time. Quantification of total number of miR-122 molecules in CM. CM was incubated with or without MDA-MB-231 cells for a period of 48 hr. Samples were collected at the indicated time points. Cell debris and apoptotic bodies were removed by low and medium speed centrifugation (as in steps 1–2 shown in Figure 1a).
Figure 3—figure supplement 3. MiR-122 accumulates in conditioned media (CM) over time. Quantification of total number of miR-122 molecules in CM. CM was incubated with or without MDA-MB-231 cells for a period of 48 hr. Samples were collected at the indicated time points. Cell debris and apoptotic bodies were removed by low and medium speed centrifugation (as in steps 1–2 shown in Figure 1a).CC BY · PubMed Central
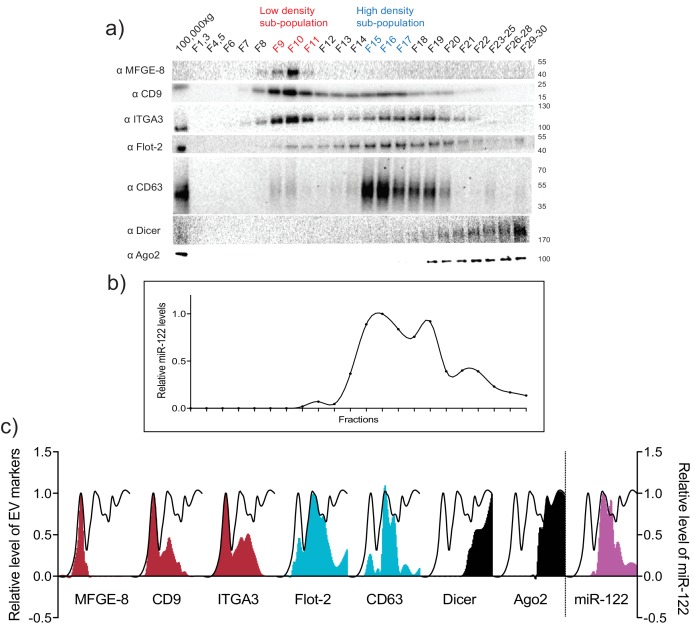
Figure 3—figure supplement 4. MiR-122 co-fractionates with the vHD sub-population. (a) Iodixanol linear gradient showing the distribution of EV and non-vesicular RNP markers. (b) Quantification of miR-122 by qPCR across the linear gradient. The majority of MiR-122 co-fractionates with the vHD subpopulation. (c) Quantification of individual proteins as in a and miR-122 as in b across the gradient. The black line delineates the maximum signal across the gradient showing the three distinct components. The first, second and third peak represent the vLD, vHD and non-vesicular RNP fractions.
Figure 3—figure supplement 4. MiR-122 co-fractionates with the vHD sub-population. (a) Iodixanol linear gradient showing the distribution of EV and non-vesicular RNP markers. (b) Quantification of miR-122 by qPCR across the linear gradient. The majority of MiR-122 co-fractionates with the vHD subpopulation. (c) Quantification of individual proteins as in a and miR-122 as in b across the gradient. The black line delineates the maximum signal across the gradient showing the three distinct components. The first, second and third peak represent the vLD, vHD and non-vesicular RNP fractions.CC BY · PubMed Central
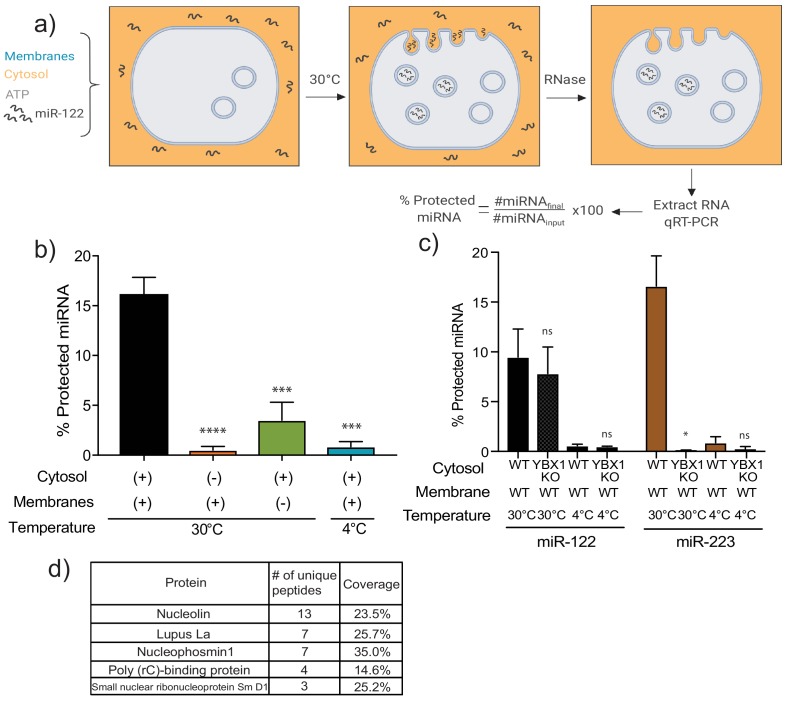
Figure 4. MiR-122 packaging is recapitulated in a cell-free reaction. (a) Schematic depicting the in vitro packaging reaction. Image reproduced from the original manuscript developing the cell-free reconstitution assay (Shurtleff et al., 2016). (b) Quantification of the in vitro packaging reaction of miR-122. Reactions with or without membranes (15,000xg pellet), cytosol (150,000xg supernatant) prepared from MDA-MB-231 cells and incubated at 30°C or 4°C are shown. Data plotted are from three independent experiments, each independent experiment with triplicate qPCR reactions; error bars represent standard deviation from independent samples. (c) Quantification of the in vitro packaging of miR-122 and miR-223. Cytosols from WT or YBX1 KO HEK293T cells were used. Incubations at 30°C or 4°C are shown. Data plotted are from two independent experiments, each independent experiment with triplicate qPCR reactions; error bars represent standard deviation from independent samples. (d) List of RNA binding proteins pulled down with biotinylated miR-122 after a modified in vitro packaging reaction was performed (see Materials and methods). Statistical significance was performed using Student’s t-test (*p<0.05, ***p<0.001, ****p<0.0001, ns = not significant).
Figure 4. MiR-122 packaging is recapitulated in a cell-free reaction. (a) Schematic depicting the in vitro packaging reaction. Image reproduced from the original manuscript developing the cell-free reconstitution assay (Shurtleff et al., 2016). (b) Quantification of the in vitro packaging reaction of miR-122. Reactions with or without membranes (15,000xg pellet), cytosol (150,000xg supernatant) prepared from MDA-MB-231 cells and incubated at 30°C or 4°C are shown. Data plotted are from three independent experiments, each independent experiment with triplicate qPCR reactions; error bars represent standard deviation from independent samples. (c) Quantification of the in vitro packaging of miR-122 and miR-223. Cytosols from WT or YBX1 KO HEK293T cells were used. Incubations at 30°C or 4°C are shown. Data plotted are from two independent experiments, each independent experiment with triplicate qPCR reactions; error bars represent standard deviation from independent samples. (d) List of RNA binding proteins pulled down with biotinylated miR-122 after a modified in vitro packaging reaction was performed (see Materials and methods). Statistical significance was performed using Student’s t-test (*p<0.05, ***p<0.001, ****p<0.0001, ns = not significant).CC BY · PubMed Central
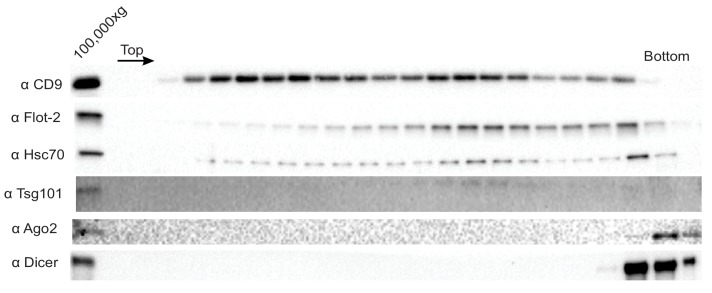
Figure 4—figure supplement 1. Ago2 and Dicer are not sEV-associated in MB-MDA-231 cells. Immunoblot for sEV markers across the linear ioxidanol gradient as depicted in Figure 1a, except that the sucrose cushion step to sediment and concentrate the vesicles was not included. Therefore the amount of sedimentable material subjected to flotation was diminished.
Figure 4—figure supplement 1. Ago2 and Dicer are not sEV-associated in MB-MDA-231 cells. Immunoblot for sEV markers across the linear ioxidanol gradient as depicted in Figure 1a, except that the sucrose cushion step to sediment and concentrate the vesicles was not included. Therefore the amount of sedimentable material subjected to flotation was diminished.CC BY · PubMed Central
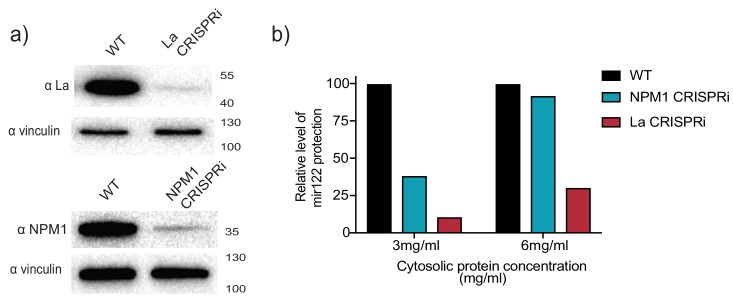
Figure 4—figure supplement 2. CRISPRi efficiently depletes the RNA binding protein candidates. (a) Analysis of RBP depletion by immunoblots. Immunoblots for La, NPM1 and vinculin are shown. (b) Relative quantification of miR-122 in vitro packaging. Cytosols from WT, La or NPM1-depleted backgrounds were tested in the reactions (cytosols from (a) were used). Two cytosolic protein concentrations were tested: 3 and 6 mg/ml.
Figure 4—figure supplement 2. CRISPRi efficiently depletes the RNA binding protein candidates. (a) Analysis of RBP depletion by immunoblots. Immunoblots for La, NPM1 and vinculin are shown. (b) Relative quantification of miR-122 in vitro packaging. Cytosols from WT, La or NPM1-depleted backgrounds were tested in the reactions (cytosols from (a) were used). Two cytosolic protein concentrations were tested: 3 and 6 mg/ml.CC BY · PubMed Central
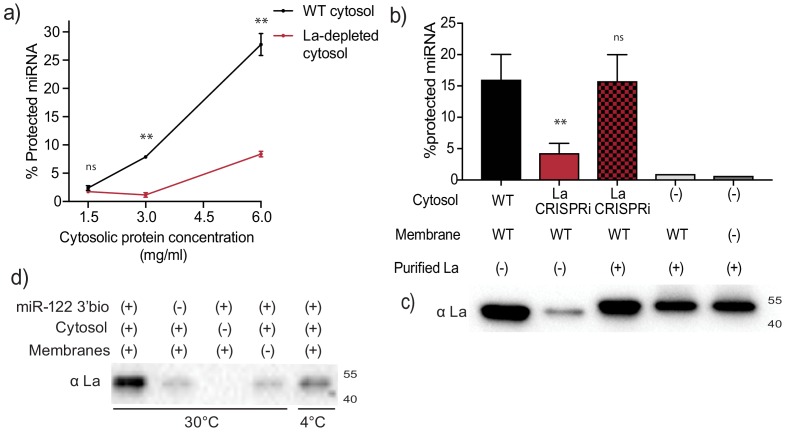
Figure 5. Sorting of miR-122 into EVs in vitro requires La. (a) Quantification of miR-122 in vitro packaging. WT and La-depleted cytosols were titrated from 1.5 to 6 mg/ml. Data plotted are from two independent experiments, each independent experiment with triplicate qPCR reactions; error bars represent standard deviation from independent samples. (b) Heterologously expressed La rescues miR-122 in vitro packaging. Quantification of miR-122 in vitro packaging is shown. Cytosols from WT or La-depleted cells with or without complementation using purified La were used. Reactions without cytosol, with or without membranes and with added purified La are also shown. Data plotted are from three independent experiments, each independent experiment with triplicate qPCR reactions; error bars represent standard deviation from independent samples. (c) Immunoblots showing the levels of endogenous or heterologously expressed added La used in the in vitro reactions as in (b) are shown. (d) Immunoblots for La following miR-122 in vitro packaging performed as for Figure 3d according to the conditions indicated. Statistical significance was performed using Student’s t-test (**p<0.01, ns = not significant).
Figure 5. Sorting of miR-122 into EVs in vitro requires La. (a) Quantification of miR-122 in vitro packaging. WT and La-depleted cytosols were titrated from 1.5 to 6 mg/ml. Data plotted are from two independent experiments, each independent experiment with triplicate qPCR reactions; error bars represent standard deviation from independent samples. (b) Heterologously expressed La rescues miR-122 in vitro packaging. Quantification of miR-122 in vitro packaging is shown. Cytosols from WT or La-depleted cells with or without complementation using purified La were used. Reactions without cytosol, with or without membranes and with added purified La are also shown. Data plotted are from three independent experiments, each independent experiment with triplicate qPCR reactions; error bars represent standard deviation from independent samples. (c) Immunoblots showing the levels of endogenous or heterologously expressed added La used in the in vitro reactions as in (b) are shown. (d) Immunoblots for La following miR-122 in vitro packaging performed as for Figure 3d according to the conditions indicated. Statistical significance was performed using Student’s t-test (**p<0.01, ns = not significant).CC BY · PubMed Central
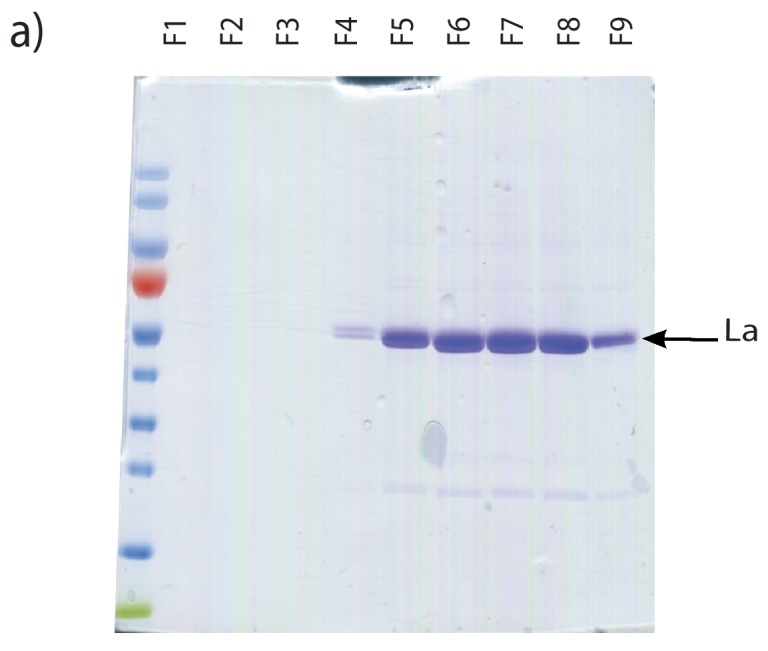
Figure 5—figure supplement 1. Purification of heterologously expressed La. Coomassie staining of purified La fractions. Fractions shown were collected post gel filtration on Sephadex G25 columns.
Figure 5—figure supplement 1. Purification of heterologously expressed La. Coomassie staining of purified La fractions. Fractions shown were collected post gel filtration on Sephadex G25 columns.CC BY · PubMed Central
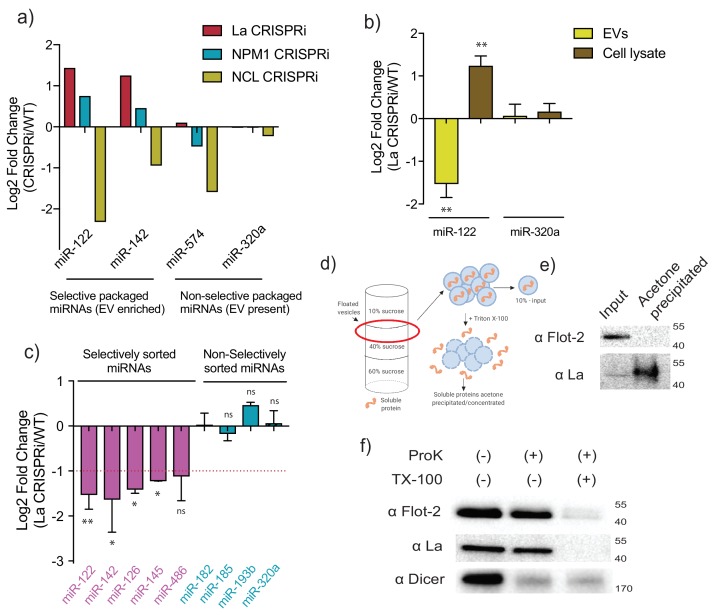
Figure 6. MiR-122 sorting into sEVs requires La in vivo. (a) Log2 fold change for intracellular levels of miRNAs of interest post-depletion of the shown RBPs by CRISPRi. MiR-122 and miR-142 were used as representatives of selectively packaged miRNAs. MiR-574 and miR-320a were used as representatives of non-selectively packaged miRNAs. Data quantified by RT-qPCR, normalized per ng of total RNA. (b) Log2 fold change of intracellular and secreted levels of miRNAs of interest quantified by RT-qPCR. sEVs were purified from WT and La-depleted cells. Cellular lysates were isolated at the moment of EV collection. MiR-320a was used as a control for non-selectively packaged miRNAs. Data plotted are from three independent experiments (biological replicates); each independent experiment with triplicate qPCR reactions, error bars represent standard deviation from independent samples. (c) Log2 fold change of secreted levels of miRNAs of interest quantified by RT-qPCR. sEVs were purified from WT and La-depleted cells. MiRNAs in pink represent miRNAs selectively sorted into vHD sEVs, miRNAs in blue represent non-selectively sorted miRNAs present in both vLD and vHD sEVs. Data plotted are from three independent experiments (biological replicates) for miR-122, miR-142 and miR-320a and from two independent experiments (biological replicates) for the rest; each independent experiment with triplicate qPCR reactions; error bars represent standard deviation from independent samples. (d) Schematic representation of the flotation assay and acetone precipitation as in (e). The high-speed pellet of conditioned medium was floated in a step sucrose gradient (input) and the soluble content was released by the addition of TX-100 and then concentrated by acetone precipitation (acetone precipitated). (e) sEV samples post-flotation and acetone precipitation/concentration were tested. Immunoblots for flotillin-2 and La are shown. Acetone precipitation captures mostly soluble proteins (Feist and Hummon, 2015), thus flotillin-2 is only detectable in the floated sample, prior to acetone precipitation, whereas La detection improves post precipitation/concentration. (f) Proteinase K protection assays in high-speed pellet fractions. Samples were treated with or without proteinase K and or Triton X-100. Immunoblots for flotillin-2, La and Dicer are shown. Statistical significance was performed using Student’s t-test (*p<0.05, **p<0.01, ns = not significant).
Figure 6. MiR-122 sorting into sEVs requires La in vivo. (a) Log2 fold change for intracellular levels of miRNAs of interest post-depletion of the shown RBPs by CRISPRi. MiR-122 and miR-142 were used as representatives of selectively packaged miRNAs. MiR-574 and miR-320a were used as representatives of non-selectively packaged miRNAs. Data quantified by RT-qPCR, normalized per ng of total RNA. (b) Log2 fold change of intracellular and secreted levels of miRNAs of interest quantified by RT-qPCR. sEVs were purified from WT and La-depleted cells. Cellular lysates were isolated at the moment of EV collection. MiR-320a was used as a control for non-selectively packaged miRNAs. Data plotted are from three independent experiments (biological replicates); each independent experiment with triplicate qPCR reactions, error bars represent standard deviation from independent samples. (c) Log2 fold change of secreted levels of miRNAs of interest quantified by RT-qPCR. sEVs were purified from WT and La-depleted cells. MiRNAs in pink represent miRNAs selectively sorted into vHD sEVs, miRNAs in blue represent non-selectively sorted miRNAs present in both vLD and vHD sEVs. Data plotted are from three independent experiments (biological replicates) for miR-122, miR-142 and miR-320a and from two independent experiments (biological replicates) for the rest; each independent experiment with triplicate qPCR reactions; error bars represent standard deviation from independent samples. (d) Schematic representation of the flotation assay and acetone precipitation as in (e). The high-speed pellet of conditioned medium was floated in a step sucrose gradient (input) and the soluble content was released by the addition of TX-100 and then concentrated by acetone precipitation (acetone precipitated). (e) sEV samples post-flotation and acetone precipitation/concentration were tested. Immunoblots for flotillin-2 and La are shown. Acetone precipitation captures mostly soluble proteins (Feist and Hummon, 2015), thus flotillin-2 is only detectable in the floated sample, prior to acetone precipitation, whereas La detection improves post precipitation/concentration. (f) Proteinase K protection assays in high-speed pellet fractions. Samples were treated with or without proteinase K and or Triton X-100. Immunoblots for flotillin-2, La and Dicer are shown. Statistical significance was performed using Student’s t-test (*p<0.05, **p<0.01, ns = not significant).CC BY · PubMed Central
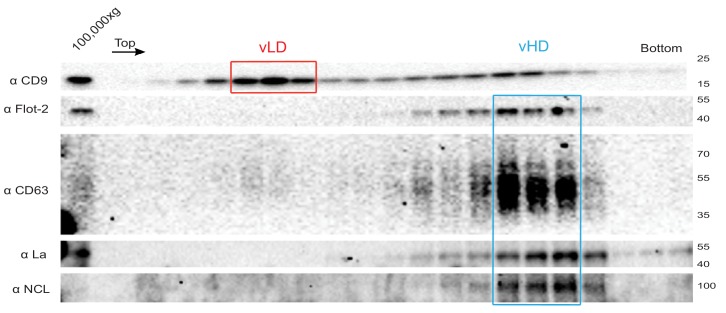
Figure 6—figure supplement 1. The La protein co-fractionates with the vHD sub-population. Immunoblots across the optiprep linear gradient for classical sEV markers as well as for La and nucleolin are shown.
Figure 6—figure supplement 1. The La protein co-fractionates with the vHD sub-population. Immunoblots across the optiprep linear gradient for classical sEV markers as well as for La and nucleolin are shown.CC BY · PubMed Central
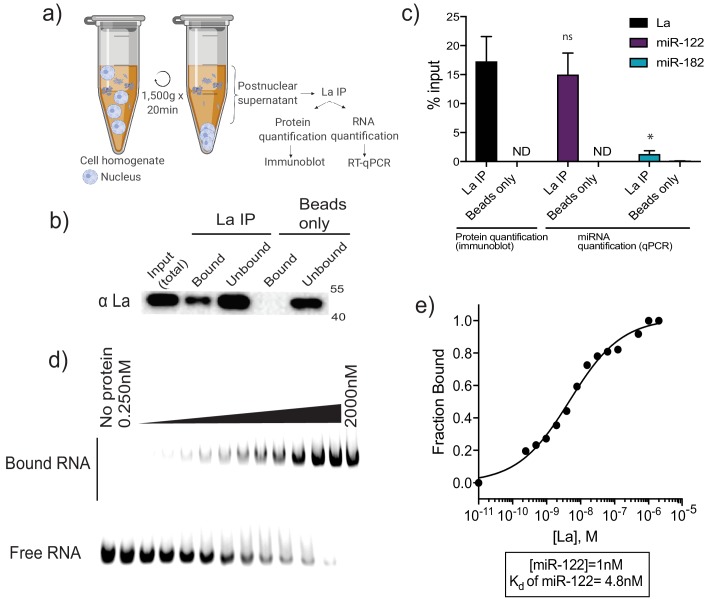
Figure 7. La interacts with miR-122 in vitro and in vivo. (a) Schematic representing immunoprecipitation of endogenous La shown in (b) and (c). (b) Immunoblot for La post-La IP. (c) Quantification of the La immunoblot post La IP. The relative levels, as percentage of input, of miR-122 and miR-182 co-IP with La are also shown. MiR-182, a non-selectively sorted miRNA, served as a negative control for La binding. Data plotted are from two independent experiments (biological replicates), for qPCR data each independent experiment with triplicate qPCR reactions; error bars represent standard deviation from independent samples. (d) EMSA assays using 5’ fluorescently labeled miR-122. Purified La was titrated from 250 pM to 2 μM. In gel fluorescence was detected. (e) Quantification of (d) showing the calculated Kd. Fraction bound was quantified as a function of exhaustion of free miRNA. Statistical significance was performed using Student’s t-test (*p<0.05, ns = not significant).
Figure 7. La interacts with miR-122 in vitro and in vivo. (a) Schematic representing immunoprecipitation of endogenous La shown in (b) and (c). (b) Immunoblot for La post-La IP. (c) Quantification of the La immunoblot post La IP. The relative levels, as percentage of input, of miR-122 and miR-182 co-IP with La are also shown. MiR-182, a non-selectively sorted miRNA, served as a negative control for La binding. Data plotted are from two independent experiments (biological replicates), for qPCR data each independent experiment with triplicate qPCR reactions; error bars represent standard deviation from independent samples. (d) EMSA assays using 5’ fluorescently labeled miR-122. Purified La was titrated from 250 pM to 2 μM. In gel fluorescence was detected. (e) Quantification of (d) showing the calculated Kd. Fraction bound was quantified as a function of exhaustion of free miRNA. Statistical significance was performed using Student’s t-test (*p<0.05, ns = not significant).CC BY · PubMed Central
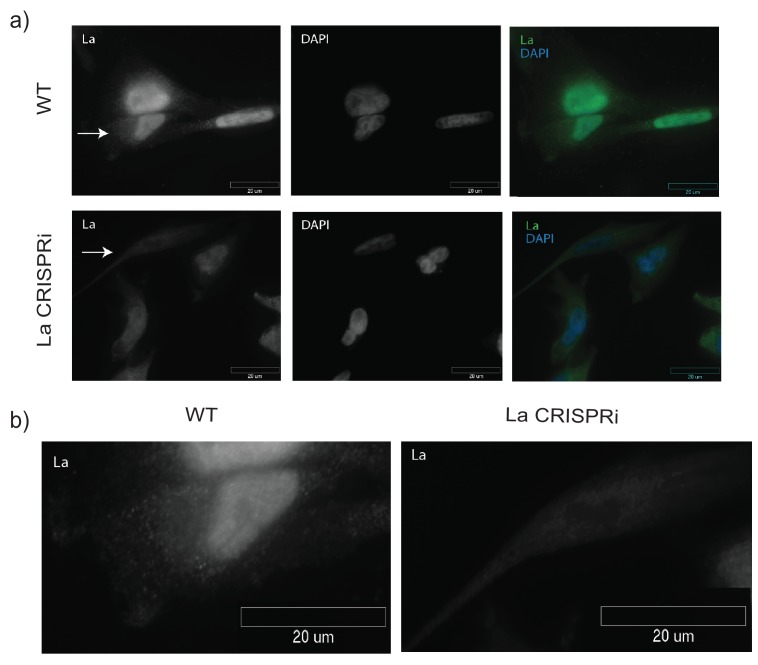
Figure 7—figure supplement 1. Detection of nuclear and cytoplasmic La by immunofluorescence. (a) Immunofluorescence for endogenous La was performed. WT and La-depleted cells were fixed and permeabilized with 0.1% Triton X-100. La and DAPI staining are shown. (b) Cells with arrows in (a) are shown side by side to confirm antibody specificity.
Figure 7—figure supplement 1. Detection of nuclear and cytoplasmic La by immunofluorescence. (a) Immunofluorescence for endogenous La was performed. WT and La-depleted cells were fixed and permeabilized with 0.1% Triton X-100. La and DAPI staining are shown. (b) Cells with arrows in (a) are shown side by side to confirm antibody specificity.CC BY · PubMed Central
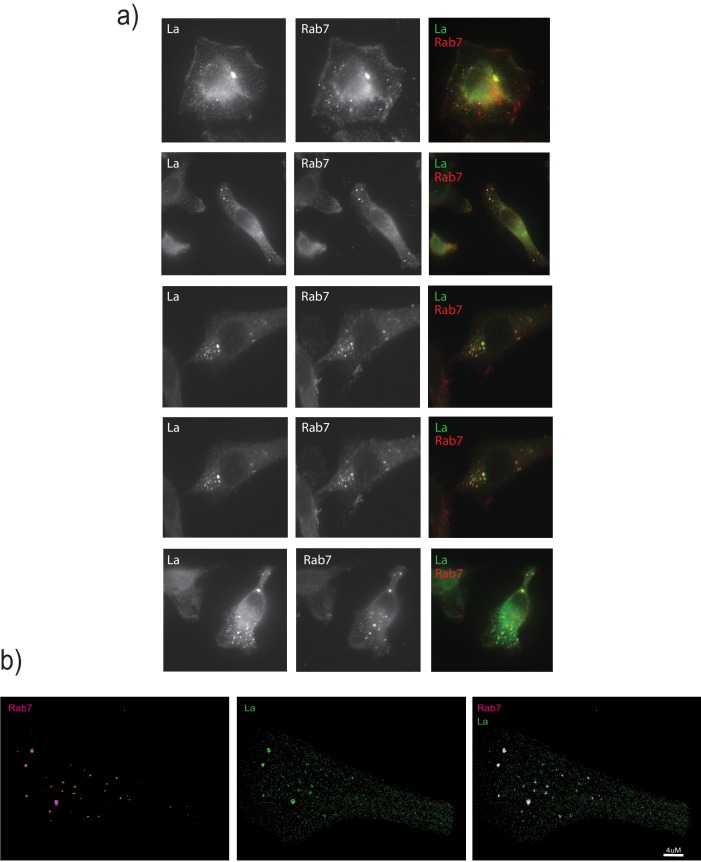
Figure 7—figure supplement 2. La associates with Rab7-positive vesicles. (a) Immunofluorescence for endogenous La and Rab7 was performed. WT cells were fixed and permeabilized with 0.02% saponin in order to preserve the nuclear envelope intact and avoid detection of nuclear La. (b) Structured illumination microscopy (SIM) was used to achieve higher resolution.
Figure 7—figure supplement 2. La associates with Rab7-positive vesicles. (a) Immunofluorescence for endogenous La and Rab7 was performed. WT cells were fixed and permeabilized with 0.02% saponin in order to preserve the nuclear envelope intact and avoid detection of nuclear La. (b) Structured illumination microscopy (SIM) was used to achieve higher resolution.CC BY · PubMed Central
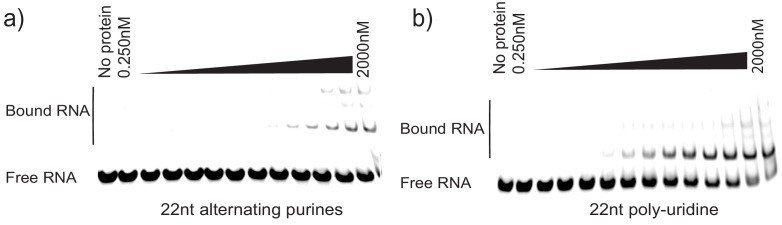
Figure 7—figure supplement 3. Controls for La specificity during EMSA. (a) 22nt RNA oligonucleotide consisting of alternating purines was incubated with different concentrations of purified La. Negative control for binding. (b) 22nt poly-uridine oligonucleotide was incubated with different concentrations of purified La as a positive control for binding.
Figure 7—figure supplement 3. Controls for La specificity during EMSA. (a) 22nt RNA oligonucleotide consisting of alternating purines was incubated with different concentrations of purified La. Negative control for binding. (b) 22nt poly-uridine oligonucleotide was incubated with different concentrations of purified La as a positive control for binding.CC BY · PubMed Central
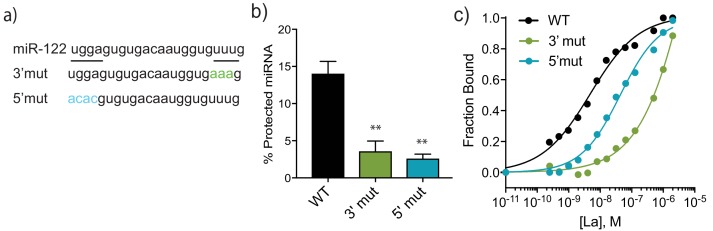
Figure 8. A bipartite motif in miR-122 is required for its packaging and interaction with La in vitro. (a) The sequences of miR-122 WT and mutated versions are shown. (b) Quantification of in vitro packaging of miR-122 WT and mutated versions. Data plotted are from three independent experiments, each with triplicate qPCR reactions; error bars represent standard deviation from independent samples. (c) Binding affinity curves (as calculated from EMSAs) for miR-122 and the mutated versions are shown. Fraction bound was quantified as a function of exhaustion of free miRNA. Statistical significance was performed using Student’s t-test (**p<0.01).
Figure 8. A bipartite motif in miR-122 is required for its packaging and interaction with La in vitro. (a) The sequences of miR-122 WT and mutated versions are shown. (b) Quantification of in vitro packaging of miR-122 WT and mutated versions. Data plotted are from three independent experiments, each with triplicate qPCR reactions; error bars represent standard deviation from independent samples. (c) Binding affinity curves (as calculated from EMSAs) for miR-122 and the mutated versions are shown. Fraction bound was quantified as a function of exhaustion of free miRNA. Statistical significance was performed using Student’s t-test (**p<0.01).CC BY · PubMed Central
Figure 8—figure supplement 1. EMSA for miR-122 mutated versions. (a) miR-122 3’ mutated oligonucleotide incubated with increasing amounts of La. (b) miR-122 5’ mutated oligonucleotide incubated with increasing amounts of La.
Figure 8—figure supplement 1. EMSA for miR-122 mutated versions. (a) miR-122 3’ mutated oligonucleotide incubated with increasing amounts of La. (b) miR-122 5’ mutated oligonucleotide incubated with increasing amounts of La.CC BY · PubMed Central
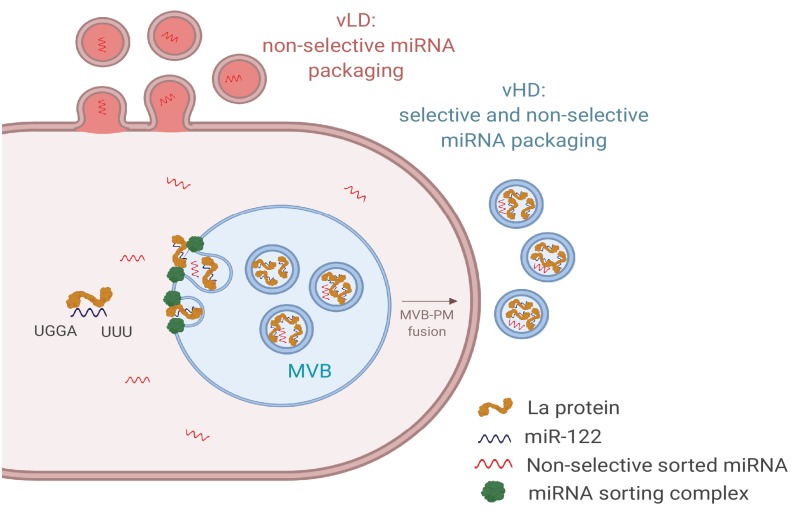
Figure 9. Diagram representing the current model of miRNA sorting into extracellular vesicles derived from MDA-MB-231 cells. At least one vesicular species within the vHD sub-population has its origin in the endocytic pathway, representing the classical exosomes. We propose a selective mechanism of miRNA sorting occurring at the site of vHD vesicle biogenesis where La, along with bound miR-122 (which interaction is mediated by at least two RNA motifs), is targeted for capture into a bud invaginating into the interior of an endosome. vLD vesicles may originate at the plasma membrane, representing shedding vesicles. There may be no selective miRNA sorting occurring at the site of vLD vesicle biogenesis. Non-selective miRNA sorting occurs in both the vHD and vLD sub-populations. MVB: multivesicular body, PM: plasma membrane.
Figure 9. Diagram representing the current model of miRNA sorting into extracellular vesicles derived from MDA-MB-231 cells. At least one vesicular species within the vHD sub-population has its origin in the endocytic pathway, representing the classical exosomes. We propose a selective mechanism of miRNA sorting occurring at the site of vHD vesicle biogenesis where La, along with bound miR-122 (which interaction is mediated by at least two RNA motifs), is targeted for capture into a bud invaginating into the interior of an endosome. vLD vesicles may originate at the plasma membrane, representing shedding vesicles. There may be no selective miRNA sorting occurring at the site of vLD vesicle biogenesis. Non-selective miRNA sorting occurs in both the vHD and vLD sub-populations. MVB: multivesicular body, PM: plasma membrane.CC BY · PubMed Central
Author response image 1.
Author response image 1. CC BY · PubMed Central
Author response image 2.
Author response image 2. CC BY · PubMed Central

Verification

Claims the paper makes

The claims and statistics of this paper haven’t been checked yet.

Run the check — free, no account needed. It reads the open-access text and checks the sources it cites.

A few free checks a day · papers already verified open instantly · results are public

Claims other papers make about this one

Each is checked against this paper’s own text: does it say what the citing paper says it does?

Self-check

Percentages, sums and reported differences re-computed from the paper’s own numbers.

The self-check needs the paper’s full text.

Citations

Cites

Show all 12 references

Research works printed but not linked: 76

  1. Admyre, 2007, Exosomes with immune modulatory features are present in human breast milk, The Journal of Immunology, 179, 1969, 10.4049/jimmunol.179.3.1969 · DOI
  2. Al-Ejeh, 2007, The La autoantigen is a Malignancy-Associated cell death target that is induced by DNA-Damaging drugs, Clinical Cancer Research, 13, 5509, 10.1158/1078-0432.CCR-07-0922 · DOI
  3. Baglio, 2016, Sensing of latent EBV infection through exosomal transfer of 5'pppRNA, PNAS, 113, E587, 10.1073/pnas.1518130113 · DOI
  4. Bailey, 1994, Fitting a mixture model by expectation maximization to discover motifs in biopolymers, Proceedings. International Conference on Intelligent Systems for Molecular Biology, 2, 28
  5. Bartel, 2004, MicroRNAs: genomics, biogenesis, mechanism, and function, Cell, 116, 281, 10.1016/s0092-8674(04)00045-5 · DOI
  6. Bobrie, 2012, Diverse subpopulations of vesicles secreted by different intracellular mechanisms are present in exosome preparations obtained by differential ultracentrifugation, Journal of Extracellular Vesicles, 1, 18397, 10.3402/jev.v1i0.18397 · DOI
  7. Boyle, 2004, GO::TermFinder--open source software for accessing gene ontology information and finding significantly enriched gene ontology terms associated with a list of genes, Bioinformatics, 20, 3710, 10.1093/bioinformatics/bth456 · DOI · Paper page
  8. Caby, 2005, Exosomal-like vesicles are present in human blood plasma, International Immunology, 17, 879, 10.1093/intimm/dxh267 · DOI
  9. Cardinali, 2003, La protein is associated with terminal oligopyrimidine mRNAs in actively translating polysomes, Journal of Biological Chemistry, 278, 35145, 10.1074/jbc.M300722200 · DOI
  10. Cha, 2015, KRAS-dependent sorting of miRNA to exosomes, eLife, 4, 10.7554/eLife.07197 · DOI
  11. Cocucci, 2009, Shedding microvesicles: artefacts no more, Trends in Cell Biology, 19, 43, 10.1016/j.tcb.2008.11.003 · DOI · Paper page
  12. Colombo, 2014, Biogenesis, secretion, and intercellular interactions of exosomes and other extracellular vesicles, Annual Review of Cell and Developmental Biology, 30, 255, 10.1146/annurev-cellbio-101512-122326 · DOI · Paper page
  13. Coulouarn, 2009, Loss of miR-122 expression in liver Cancer correlates with suppression of the hepatic phenotype and gain of metastatic properties, Oncogene, 28, 3526, 10.1038/onc.2009.211 · DOI
  14. Crosio, 2000, La protein has a positive effect on the translation of TOP mRNAs in vivo, Nucleic Acids Research, 28, 2927, 10.1093/nar/28.15.2927 · DOI
  15. Demory Beckler, 2013, Proteomic Analysis of Exosomes from Mutant KRAS Colon Cancer Cells Identifies Intercellular Transfer of Mutant KRAS, Molecular & Cellular Proteomics, 12, 343, 10.1074/mcp.M112.022806 · DOI
  16. Dickman, 2017, Selective extracellular vesicle exclusion of miR-142-3p by oral Cancer cells promotes both internal and extracellular malignant phenotypes, Oncotarget, 8, 15252, 10.18632/oncotarget.14862 · DOI
  17. Feist, 2015, Proteomic challenges: sample preparation techniques for microgram-quantity protein analysis from biological samples, International Journal of Molecular Sciences, 16, 3537, 10.3390/ijms16023537 · DOI
  18. Flores, 2014, Differential RISC association of endogenous human microRNAs predicts their inhibitory potential, Nucleic Acids Research, 42, 4629, 10.1093/nar/gkt1393 · DOI
  19. Gibbings, 2009, Multivesicular bodies associate with components of miRNA effector complexes and modulate miRNA activity, Nature Cell Biology, 11, 1143, 10.1038/ncb1929 · DOI
  20. Gorur, 2017, COPII-coated membranes function as transport carriers of intracellular procollagen I, The Journal of Cell Biology, 216, 1745, 10.1083/jcb.201702135 · DOI
  21. Gould, 2019, 'A shared pathway of exosome biogenesis operates at plasma and endosome membranes', 10.1101/545228 · DOI
  22. Harding, 1983, Receptor-mediated endocytosis of transferrin and recycling of the transferrin receptor in rat reticulocytes, The Journal of Cell Biology, 97, 329, 10.1083/jcb.97.2.329 · DOI · Paper page
  23. Horlbeck, 2016, Compact and highly active next-generation libraries for CRISPR-mediated gene repression and activation, eLife, 5, 10.7554/eLife.19760 · DOI · Paper page
  24. Hsu, 2010, Regulation of exosome secretion by Rab35 and its GTPase-activating proteins TBC1D10A-C, The Journal of Cell Biology, 189, 223, 10.1083/jcb.200911018 · DOI
  25. Hsu, 2017, Hypoxic lung cancer-secreted exosomal miR-23a increased angiogenesis and vascular permeability by targeting prolyl hydroxylase and tight junction protein ZO-1, Oncogene, 36, 4929, 10.1038/onc.2017.105 · DOI
  26. Intine, 2003, Differential phosphorylation and subcellular localization of La RNPs associated with precursor tRNAs and translation-related mRNAs, Molecular Cell, 12, 1301, 10.1016/S1097-2765(03)00429-5 · DOI
  27. Jeppesen, 2019, Reassessment of exosome composition, Cell, 177, 428, 10.1016/j.cell.2019.02.029 · DOI · Paper page
  28. Kim, 2015, HISAT: a fast spliced aligner with low memory requirements, Nature Methods, 12, 357, 10.1038/nmeth.3317 · DOI · Paper page
  29. Koppers-Lalic, 2014, Nontemplated nucleotide additions distinguish the small RNA composition in cells from exosomes, Cell Reports, 8, 1649, 10.1016/j.celrep.2014.08.027 · DOI · Paper page
  30. Langmead, 2012, Fast gapped-read alignment with bowtie 2, Nature Methods, 9, 357, 10.1038/nmeth.1923 · DOI · Paper page
  31. Li, 2009, The sequence alignment/Map format and SAMtools, Bioinformatics, 25, 2078, 10.1093/bioinformatics/btp352 · DOI · Paper page
  32. Liang, 2013, Characterization and proteomic analysis of ovarian cancer-derived exosomes, Journal of Proteomics, 80, 171, 10.1016/j.jprot.2012.12.029 · DOI
  33. Meckes, 2013, Modulation of B-cell exosome proteins by gamma herpesvirus infection, PNAS, 110, E2925, 10.1073/pnas.1303906110 · DOI
  34. Mittelbrunn, 2011, Unidirectional transfer of microRNA-loaded exosomes from T cells to antigen-presenting cells, Nature Communications, 2, 10.1038/ncomms1285 · DOI
  35. Mohr, 2013, Thermostable group II intron reverse transcriptase fusion proteins and their use in cDNA synthesis and next-generation RNA sequencing, RNA, 19, 958, 10.1261/rna.039743.113 · DOI
  36. Montecalvo, 2012, Mechanism of transfer of functional microRNAs between mouse dendritic cells via exosomes, Blood, 119, 756, 10.1182/blood-2011-02-338004 · DOI · Paper page
  37. Mukherjee, 2016, Reversible HuR-microRNA binding controls extracellular export of miR-122 and augments stress response, EMBO Reports, 17, 1184, 10.15252/embr.201541930 · DOI · Paper page
  38. Ostenfeld, 2014, Cellular disposal of miR23b by RAB27-dependent exosome release is linked to acquisition of metastatic properties, Cancer Research, 74, 5758, 10.1158/0008-5472.CAN-13-3512 · DOI
  39. Ostrowski, 2010, Rab27a and Rab27b control different steps of the exosome secretion pathway, Nature Cell Biology, 12, 19, 10.1038/ncb2000 · DOI
  40. Pan, 1985, Electron microscopic evidence for externalization of the transferrin receptor in vesicular form in sheep reticulocytes, The Journal of Cell Biology, 101, 942, 10.1083/jcb.101.3.942 · DOI
  41. Pegtel, 2010, Functional delivery of viral miRNAs via exosomes, PNAS, 107, 6328, 10.1073/pnas.0914843107 · DOI
  42. Peinado, 2017, Pre-metastatic niches: organ-specific homes for metastases, Nature Reviews Cancer, 17, 302, 10.1038/nrc.2017.6 · DOI · Paper page
  43. Peritz, 2006, Immunoprecipitation of mRNA-protein complexes, Nature Protocols, 1, 577, 10.1038/nprot.2006.82 · DOI
  44. Petz, 2012, PDGF enhances IRES-mediated translation of laminin B1 by cytoplasmic accumulation of La during epithelial to mesenchymal transition, Nucleic Acids Research, 40, 9738, 10.1093/nar/gks760 · DOI
  45. Petz, 2012, La enhances IRES-mediated translation of laminin B1 during malignant epithelial to mesenchymal transition, Nucleic Acids Research, 40, 290, 10.1093/nar/gkr717 · DOI
  46. Pisitkun, 2004, Identification and proteomic profiling of exosomes in human urine, PNAS, 101, 13368, 10.1073/pnas.0403453101 · DOI
  47. Qin, 2016, High-throughput sequencing of human plasma RNA by using thermostable group II intron reverse transcriptases, RNA, 22, 111, 10.1261/rna.054809.115 · DOI
  48. Rana, 2013, Exosomal tumor microRNA modulates premetastatic organ cells, Neoplasia, 15, 10.1593/neo.122010 · DOI
  49. Rinke, 1985, Association of the lupus antigen La with a subset of U6 snRNA molecules, Nucleic Acids Research, 13, 2617, 10.1093/nar/13.7.2617 · DOI
  50. Rio, 2014, Electrophoretic mobility shift assays for RNA-protein complexes, Cold Spring Harbor Protocols, 2014, 435, 10.1101/pdb.prot080721 · DOI
  51. Rodríguez, 2014, Different exosome cargo from plasma/bronchoalveolar lavage in non-small-cell lung Cancer, Genes, Chromosomes and Cancer, 22, 713, 10.1002/gcc.22181 · DOI
  52. Santangelo, 2016, The RNA-Binding protein SYNCRIP is a component of the hepatocyte exosomal machinery controlling MicroRNA sorting, Cell Reports, 17, 799, 10.1016/j.celrep.2016.09.031 · DOI · Paper page
  53. Shurtleff, 2016, Y-box protein 1 is required to sort microRNAs into exosomes in cells and in a cell-free reaction, eLife, 5, 10.7554/eLife.19276 · DOI · Paper page
  54. Shurtleff, 2017, Broad role for YBX1 in defining the small noncoding RNA composition of exosomes, PNAS, 114, E8987, 10.1073/pnas.1712108114 · DOI
  55. Shurtleff, 2018, Extracellular vesicles and Cancer: caveat lector, Annual Review of Cancer Biology, 2, 395, 10.1146/annurev-cancerbio-030617-050519 · DOI
  56. Sirkis, 2017, Neurodegeneration-associated mutant TREM2 proteins abortively cycle between the ER and ER-Golgi intermediate compartment, Molecular Biology of the Cell, 28, 2723, 10.1091/mbc.e17-06-0423 · DOI
  57. Skottvoll, 2018, Comparison of ultracentrifugation and a commercial kit for isolation of exosomes derived from glioblastoma and breast Cancer cell lines, 10.1101/274910 · DOI
  58. Sommer, 2011, The RNA-binding protein La contributes to cell proliferation and CCND1 expression, Oncogene, 30, 434, 10.1038/onc.2010.425 · DOI
  59. Sommer, 2011, Implication of RNA-binding protein La in proliferation, migration and invasion of lymph node-metastasized hypopharyngeal SCC cells, PLOS ONE, 6, 10.1371/journal.pone.0025402 · DOI
  60. Squadrito, 2014, Endogenous RNAs modulate microRNA sorting to exosomes and transfer to acceptor cells, Cell Reports, 8, 1432, 10.1016/j.celrep.2014.07.035 · DOI · Paper page
  61. Stefano, 1984, Purified lupus antigen La recognizes an oligouridylate stretch common to the 3' termini of RNA polymerase III transcripts, Cell, 36, 145, 10.1016/0092-8674(84)90083-7 · DOI
  62. Swanson, 2006, Retrovirus RNA trafficking: from chromatin to invasive genomes, Traffic, 7, 1440, 10.1111/j.1600-0854.2006.00488.x · DOI
  63. Szczepanski, 2011, Blast-derived microvesicles in sera from patients with acute myeloid leukemia suppress natural killer cell function via membrane-associated transforming growth factor-beta1, Haematologica, 96, 1302, 10.3324/haematol.2010.039743 · DOI
  64. Tan, 2009, Expanded RNA-binding activities of mammalian argonaute 2, Nucleic Acids Research, 37, 7533, 10.1093/nar/gkp812 · DOI
  65. Tominaga, 2015, Brain metastatic Cancer cells release microRNA-181c-containing extracellular vesicles capable of destructing blood-brain barrier, Nature Communications, 6, 10.1038/ncomms7716 · DOI · Paper page
  66. Tosar, 2015, Assessment of small RNA sorting into different extracellular fractions revealed by high-throughput sequencing of breast cell lines, Nucleic Acids Research, 43, 5601, 10.1093/nar/gkv432 · DOI · Paper page
  67. Trotta, 2003, BCR/ABL activates mdm2 mRNA translation via the La antigen, Cancer Cell, 3, 145, 10.1016/S1535-6108(03)00020-5 · DOI
  68. Van Deun, 2014, The impact of disparate isolation methods for extracellular vesicles on downstream RNA profiling, Journal of Extracellular Vesicles, 3, 24858, 10.3402/jev.v3.24858 · DOI
  69. van Niekerk, 2007, Sumoylation in axons triggers retrograde transport of the RNA-binding protein la, PNAS, 104, 12913, 10.1073/pnas.0611562104 · DOI
  70. Vella, 2007, Packaging of prions into exosomes is associated with a novel pathway of PrP processing, The Journal of Pathology, 211, 582, 10.1002/path.2145 · DOI
  71. Villarroya-Beltri, 2013, Sumoylated hnRNPA2B1 controls the sorting of miRNAs into exosomes through binding to specific motifs, Nature Communications, 4, 10.1038/ncomms3980 · DOI · Paper page
  72. Wang, 2012, MiR-122 inhibits cell proliferation and tumorigenesis of breast Cancer by targeting IGF1R, PLOS ONE, 7, 10.1371/journal.pone.0047053 · DOI
  73. Wei, 2016, Fetal bovine serum RNA interferes with the cell culture derived extracellular RNA, Scientific Reports, 6, 10.1038/srep31175 · DOI
  74. Willms, 2016, Cells release subpopulations of exosomes with distinct molecular and biological properties, Scientific Reports, 6, 10.1038/srep22519 · DOI
  75. Wolin, 2002, The La protein, Annual Review of Biochemistry, 71, 375, 10.1146/annurev.biochem.71.090501.150003 · DOI
  76. Wu, 2012, De novo sequencing of circulating miRNAs identifies novel markers predicting clinical outcome of locally advanced breast Cancer, Journal of Translational Medicine, 10, 10.1186/1479-5876-10-42 · DOI

Cited by

Sorted by citations

Metadata

Authors
Temoche-Diaz, M. M., Shurtleff, M. J., Nottingham, R. M., Yao, J., Fadadu, R. P., Lambowitz, A. M., & Schekman, R.
Affiliations
  • Department of Plant and Microbial Biology, University of California, Berkeley, Berkeley, United States
  • Department of Molecular Biosciences, Institute for Cellular and Molecular Biology, University of Texas, Austin, United States
  • Department of Molecular and Cellular Biology, Howard Hughes Medical Institute, University of California, Berkeley, Berkeley, United States
Venue
eLife
Published
2019-08-22
Volume
8
ISSN
2050-084X
Cited by
227
References
12
Language
en
Funders
  • Howard Hughes Medical Institute
  • National Institutes of Health (R01 GM37949)

About these checks

Registry, retraction, Cites and statistics results are computed, not judged, with one exception: a printed reference that no index lists is read once by a model before it counts as a citation error. Claims are extracted by a model and kept only when their quote appears verbatim in the text; each cited source is then checked, with a model’s help, for whether it says what the claim relies on. Those verdicts can be wrong — read the claim’s quote and the cited source before relying on one.

Statistics and arithmetic are recomputed, not judged.

Confidence bands are shown only for fields calibrated on our annotated test set. None is calibrated yet, so no band is shown.

What counts as a claim ›How we measure confidence ›How we check this ›

Are you an author, or do you see a problem with this page? Request a review