

The DOI matches its Crossref record; 11 of the 11 references it cites were found in a registry or an index.
microRNA‐132 is overexpressed in glia in temporal lobe epilepsy and reduces the expression of pro‐epileptogenic factors in human cultured astrocytes
Abstract
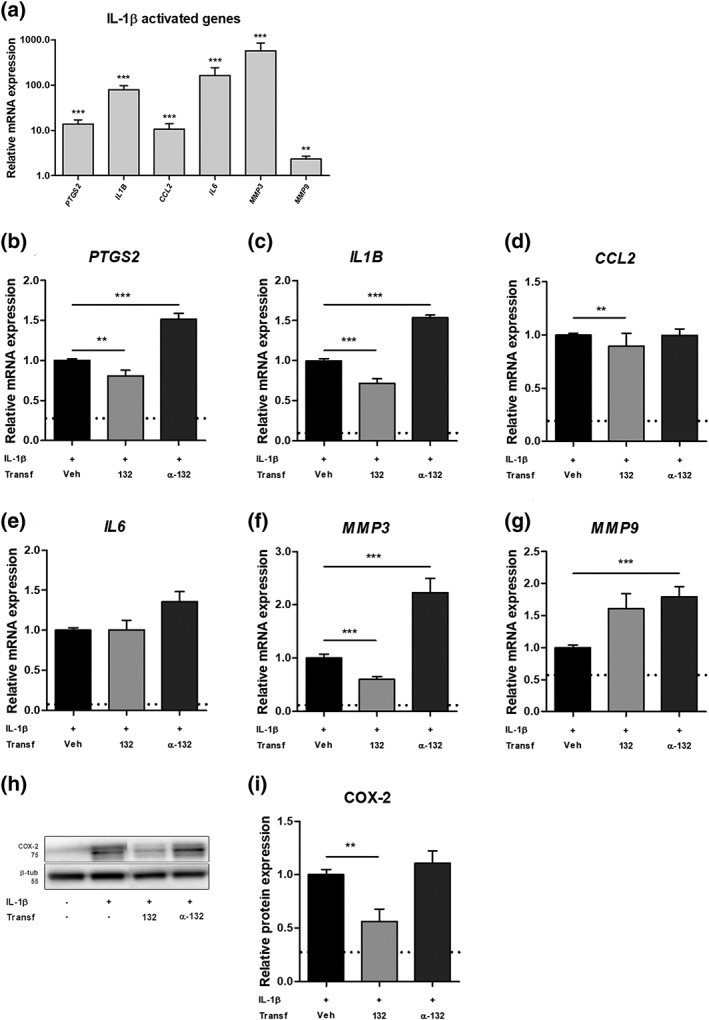
Temporal lobe epilepsy (TLE) is a chronic neurological disease in humans, which is refractory to pharmacological treatment in about 30% of the patients. Reactive glial cells are thought to play a major role during the development of epilepsy (epileptogenesis) via regulation of brain inflammation and remodeling of the extracellular matrix (ECM). These processes can be regulated by microRNAs (miRs), a class of small non‐coding RNAs, which can control entire gene networks at a post‐transcriptional level. The expression of miRs is known to change dynamically during epileptogenesis. miR‐132 is one of the most commonly upregulated miRs in animal TLE models with important roles shown in neurons. However, the possible role of miR‐132 in glia remains largely unknown. The aim of this study was to characterize the cell‐type specific expression of miR‐132 in the hippocampus of patients with TLE and during epileptogenesis in a rat TLE model. Furthermore, the potential role of miR‐132 was investigated by transfection of human primary cultured astrocytes that were stimulated with the cytokines IL‐1β or TGF‐β1. We showed an increased expression of miR‐132 in the human and rat epileptogenic hippocampus, particularly in glial cells. Transfection of miR‐132 in human primary astrocytes reduced the expression of pro‐epileptogenic COX‐2, IL‐1β, TGF‐β2, CCL2, and MMP3. This suggests that miR‐132, particularly in astrocytes, represents a potential therapeutic target that warrants further in vivo investigation.
Overview
The claims and statistics of this paper haven’t been checked yet.
Run the check — free, no account needed. It reads the open-access text and checks the sources it cites.
Integrity signals
Registry
Cites
Statistics
Figures
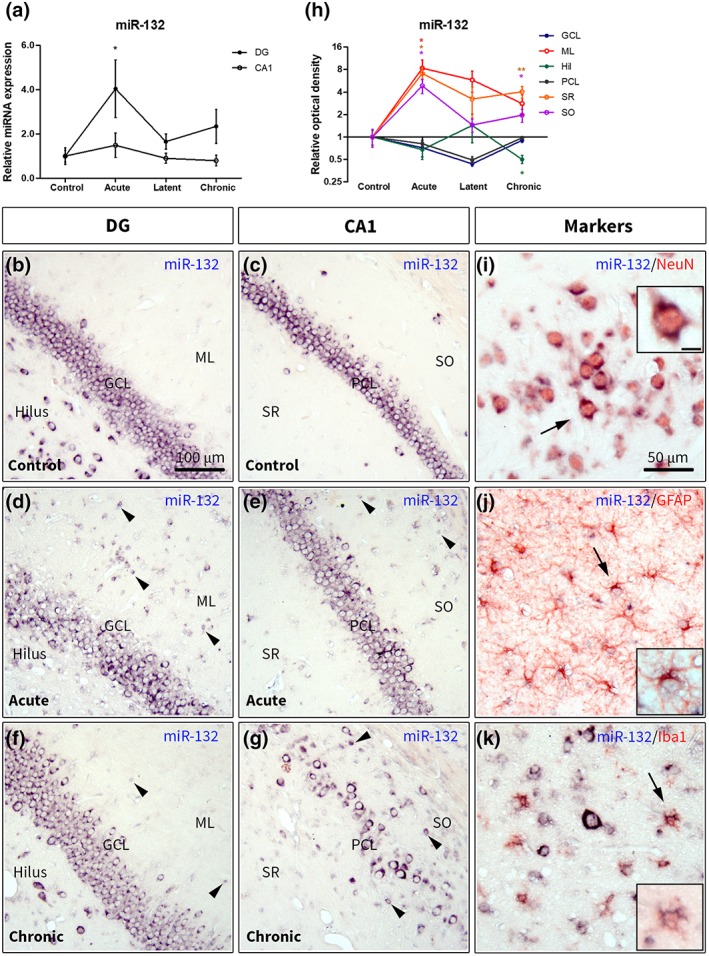
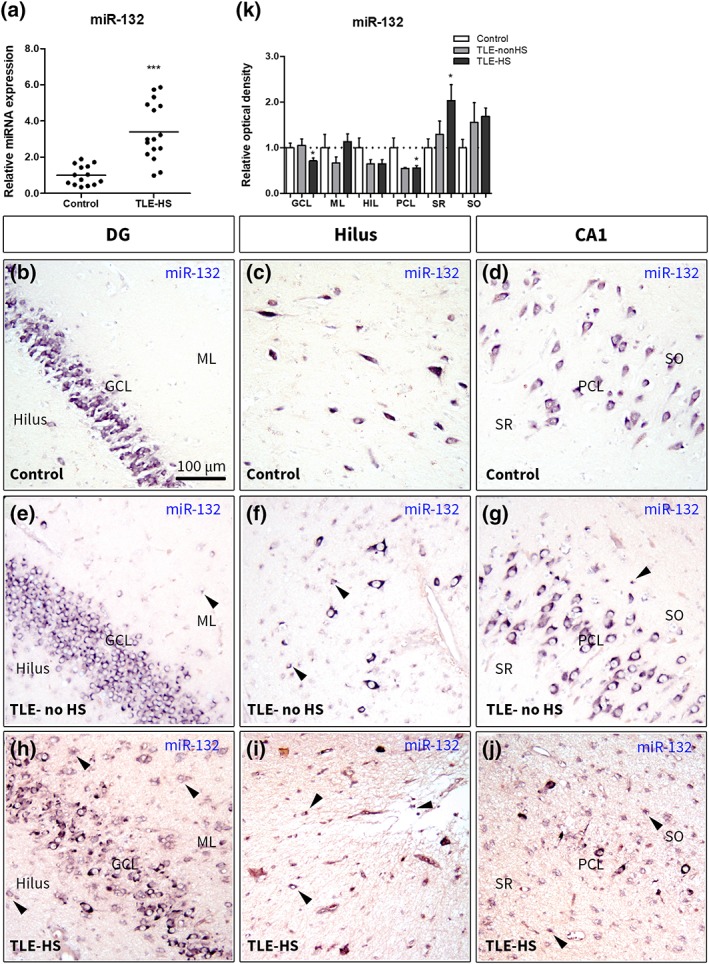
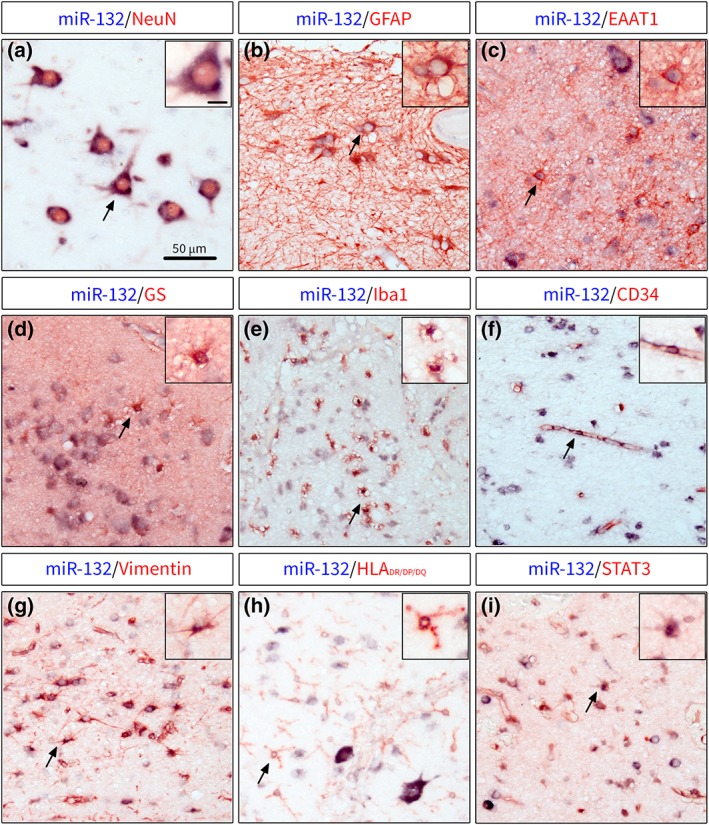
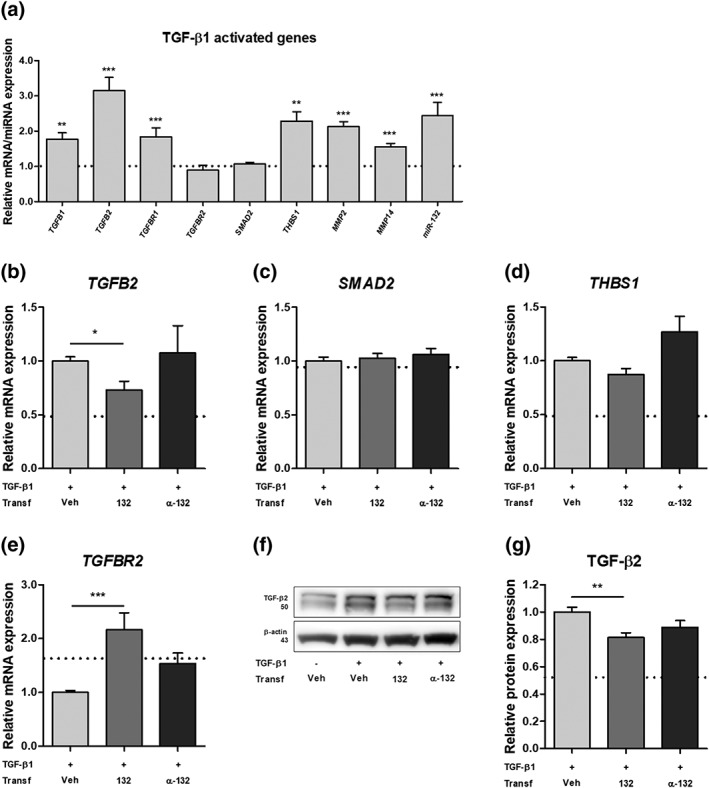
Verification
Claims the paper makes
The claims and statistics of this paper haven’t been checked yet.
Run the check — free, no account needed. It reads the open-access text and checks the sources it cites.
Claims other papers make about this one
Each is checked against this paper’s own text: does it say what the citing paper says it does?
The source backs part of the claim, not all of it — or backs it for a different population, condition or comparison.
In the citing paper
“Interestingly, treatment with LPS also induced an increase in miR-132 levels per se (Supplementary Fig. 1G), as shown before in astrocytes and murine microglia [41, 50].”
From microRNA-132 attenuates inflammation in induced pluripotent stem cell-derived microglia from Alzheimer’s disease patients (2026) · cites this paper as [41]
Experimental — accuracy not yet measuredThe source backs part of the claim, not all of it — or backs it for a different population, condition or comparison.
In the citing paper
“Anti-inflammatory properties of miR-132 have been demonstrated in multiple independent in vitro and in vivo studies, including its direct targeting of acetylcholinesterase (which leads to increased levels of acetylcholine and, thereby, inhibits the release of pro-inflammatory cytokines), and its regulation over key inflammatory pathways, like TLR4 and NF-kB, which we also observed in our study [41”
From microRNA-132 attenuates inflammation in induced pluripotent stem cell-derived microglia from Alzheimer’s disease patients (2026) · cites this paper as [41]
Experimental — accuracy not yet measuredIn the citing paper
“miR-132, classified as a ‘NeurimmiR’, operates at the interface of both immune and neuronal functions [18, 40, 41].”
From microRNA-132 attenuates inflammation in induced pluripotent stem cell-derived microglia from Alzheimer’s disease patients (2026) · cites this paper as [41]
Self-check
Percentages, sums and reported differences re-computed from the paper’s own numbers.
The self-check needs the paper’s full text.
Citations
Cites
Neurotoxic reactive astrocytes are induced by activated microglia
Liddelow, S. A., Guttenplan, K. A., Clarke, L. E., Bennett, F. C., Bohlen, C. J., Schirmer, L., Bennett, M. L., Münch, A. E., Chung, W.-S., Peterson, T. C., et al. (2017) · Nature · doi:10.1038/nature21029 · Cited by 7,971
Astrocytes: Biology and pathology
Sofroniew, M. V., & Vinters, H. V. (2010) · Acta Neuropathologica · doi:10.1007/s00401-009-0619-8 · Cited by 5,196
Astrocyte scar formation aids central nervous system axon regeneration
Anderson, M. A., Burda, J. E., Ren, Y., Ao, Y., O’Shea, T. M., Kawaguchi, R., Coppola, G., Khakh, B. S., Deming, T. J., & Sofroniew, M. V. (2016) · Nature · doi:10.1038/nature17623 · Cited by 1,851
Astrocyte barriers to neurotoxic inflammation
Sofroniew, M. V. (2015) · Nature Reviews Neuroscience · doi:10.1038/nrn3898 · Cited by 1,202
Pathophysiology of the brain extracellular matrix: a new target for remyelination
Lau, L. W., Cua, R., Keough, M. B., Haylock-Jacobs, S., & Yong, V. W. (2013) · Nature reviews. Neuroscience · doi:10.1038/nrn3550 · Cited by 549
Neurons secrete miR-132-containing exosomes to regulate brain vascular integrity
Xu, B., Zhang, Y., Du, X.-F., Li, J., Zi, H.-X., Bu, J.-W., Yan, Y., Han, H., & Du, J.-L. (2017) · Cell Research · doi:10.1038/cr.2017.62 · Cited by 354
MicroRNA-146a: A Key Regulator of Astrocyte-Mediated Inflammatory Response
Iyer, A., Zurolo, E., Prabowo, A., Fluiter, K., Spliet, W. G. M., van Rijen, P. C., Gorter, J. A., & Aronica, E. (2012) · PLoS ONE · doi:10.1371/journal.pone.0044789 · Cited by 330
Self-citationImportant role of matrix metalloproteinase 9 in epileptogenesis
Wilczynski, G. M., Konopacki, F. A., Wilczek, E., Lasiecka, Z., Gorlewicz, A., Michaluk, P., Wawrzyniak, M., Malinowska, M., Okulski, P., Kolodziej, L. R., et al. (2008) · The Journal of Cell Biology · doi:10.1083/jcb.200708213 · Cited by 292
Losartan prevents acquired epilepsy via TGF‐β signaling suppression
Bar‐Klein, G., Cacheaux, L. P., Kamintsky, L., Prager, O., Weissberg, I., Schoknecht, K., Cheng, P., Kim, S. Y., Wood, L., Heinemann, U., et al. (2014) · Annals of Neurology · doi:10.1002/ana.24147 · Cited by 270
Jovičić, A., Roshan, R., Moisoi, N., Pradervand, S., Moser, R., Pillai, B., & Luthi-Carter, R. (2013) · The Journal of Neuroscience · doi:10.1523/jneurosci.0600-12.2013 · Cited by 251
Research works printed but not linked: 56
- 10.7554/eLife.05005 · DOI · Paper page
- 10.1038/nature02871 · DOI · Paper page
- 10.1038/nm.2186 · DOI · Paper page
- 10.1111/j.1460-9568.2010.07122.x · DOI · Paper page
- 10.1016/j.jneuroim.2004.11.015 · DOI · Paper page
- 10.1002/glia.22312 · DOI
- Aten S., 2016, The miR‐132/212 locus: A complex regulator of neuronal plasticity, gene expression and cognition, RNA & Disease, 3
- 10.1016/j.cell.2018.03.006 · DOI · Paper page
- 10.1073/pnas.1701201114 · DOI
- 10.1056/NEJMoa1703784 · DOI
- 10.1111/epi.12220 · DOI
- 10.1371/journal.pone.0076051 · DOI
- 10.1016/j.neulet.2017.01.017 · DOI
- 10.1111/epi.13823 · DOI
- 10.1523/JNEUROSCI.0430-09.2009 · DOI
- Cao D. D., 2016, MicroRNAs: Key regulators in the central nervous system and their implication in neurological diseases, International Journal of Molrcular Science, 17
- 10.1002/glia.22675 · DOI
- 10.1016/S0197-0186(02)00101-8 · DOI
- 10.1016/j.nbd.2013.10.026 · DOI · Paper page
- 10.1016/j.yebeh.2015.04.047 · DOI · Paper page
- 10.1523/JNEUROSCI.2766-06.2006 · DOI · Paper page
- 10.1046/j.1460-9568.2001.01428.x · DOI
- 10.1111/j.1528-1167.2007.01290.x · DOI
- 10.1371/journal.pone.0015497 · DOI
- 10.1002/glia.22311 · DOI
- 10.1016/j.eplepsyres.2008.12.006 · DOI
- 10.1093/brain/awl317 · DOI · Paper page
- 10.1016/j.ajpath.2011.07.036 · DOI
- 10.1007/s11064-013-1209-7 · DOI
- 10.1007/s12031-015-0574-x · DOI · Paper page
- 10.1186/s12974-018-1245-y · DOI · Paper page
- 10.1038/s41598-017-11510-8 · DOI
- 10.1007/s12031-014-0368-6 · DOI
- 10.1016/j.immuni.2017.06.006 · DOI · Paper page
- 10.1016/j.seizure.2011.01.003 · DOI
- 10.1038/nrd4126 · DOI
- 10.1002/hipo.20646 · DOI
- 10.1016/j.neulet.2011.10.025 · DOI
- 10.1007/s12031-013-9953-3 · DOI
- 10.1101/cshperspect.a022822 · DOI
- 10.1177/0271678X16655551 · DOI · Paper page
- 10.4238/gmr.15017798 · DOI
- 10.1093/nar/gkp045 · DOI · Paper page
- 10.1016/j.immuni.2009.09.019 · DOI · Paper page
- 10.1016/0003-2697(85)90442-7 · DOI · Paper page
- 10.1016/j.molmed.2011.06.009 · DOI · Paper page
- Scheppingen J., 2016, Expression of microRNAs miR21, miR146a, and miR155 in tuberous sclerosis complex cortical tubers and their regulation in human astrocytes and SEGA‐derived cell cultures, Glia, 64, 1066
- 10.1002/glia.23302 · DOI
- 10.1111/nan.12444 · DOI
- 10.1111/j.1535-7511.2007.00165.x · DOI
- 10.1111/j.1528-1167.2008.01490.x · DOI · Paper page
- 10.1093/nar/gkv403 · DOI
- 10.1073/pnas.0508448102 · DOI · Paper page
- 10.1073/pnas.0803072105 · DOI · Paper page
- 10.1016/j.nbd.2015.02.029 · DOI
- 10.1523/JNEUROSCI.6221-11.2012 · DOI · Paper page
Cited by
Sorted by citations
Penning, A., Snoeck, S., Ormaechea, O. R., Ayyildiz, D., Polzer, O., Buitrago-Arango, M., Capobianco, R., de Winter, F., Balusu, S., Verhaagen, J., et al. (2026) · Acta Neuropathologica Communications · doi:10.1186/s40478-026-02228-8 · Cited by 6
Metadata
- Authors
- Korotkov, A., Broekaart, D. W. M., Banchaewa, L., Pustjens, B., van Scheppingen, J., Anink, J. J., Baayen, J. C., Idema, S., Gorter, J. A., van Vliet, E. A., & Aronica, E.
- Affiliations
- Amsterdam UMC, University of Amsterdam Department of (Neuro)Pathology, Amsterdam Neuroscience, Meibergdreef 9 Amsterdam the Netherlands
- Amsterdam UMC, Vrije Universiteit Amsterdam, Department of Neurosurgery, Amsterdam Neuroscience, De Boelelaan 1117 Amsterdam the Netherlands
- Swammerdam Institute for Life Sciences, Center for Neuroscience, University of Amsterdam Amsterdam the Netherlands
- ORCID
- Venue
- Glia
- Publisher
- Wiley
- Published
- 2019-08-13
- Volume
- 68
- Issue
- 1
- Pages
- 60-75
- ISSN
- 0894-1491
- 1098-1136
- PMC
- PMC6899748
- Cited by
- 70
- References
- 11
- Language
- en
- Funders
- Epilepsiefonds (16‐05)
- FP7 Health (602102)
- H2020 Marie Skłodowska-Curie Actions (642881)
About these checks
Registry, retraction, Cites and statistics results are computed, not judged, with one exception: a printed reference that no index lists is read once by a model before it counts as a citation error. Claims are extracted by a model and kept only when their quote appears verbatim in the text; each cited source is then checked, with a model’s help, for whether it says what the claim relies on. Those verdicts can be wrong — read the claim’s quote and the cited source before relying on one.
Statistics and arithmetic are recomputed, not judged.
Confidence bands are shown only for fields calibrated on our annotated test set. None is calibrated yet, so no band is shown.
What counts as a claim ›How we measure confidence ›How we check this ›
Are you an author, or do you see a problem with this page? Request a review
