

The DOI matches its Crossref record; 6 of the 6 references it cites were found in a registry or an index.
Active cargo loading into extracellular vesicles: Highlights the heterogeneous encapsulation behaviour
Abstract
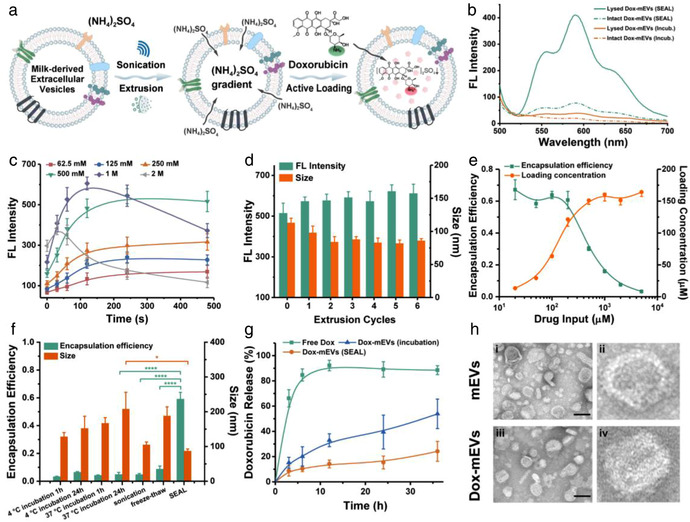
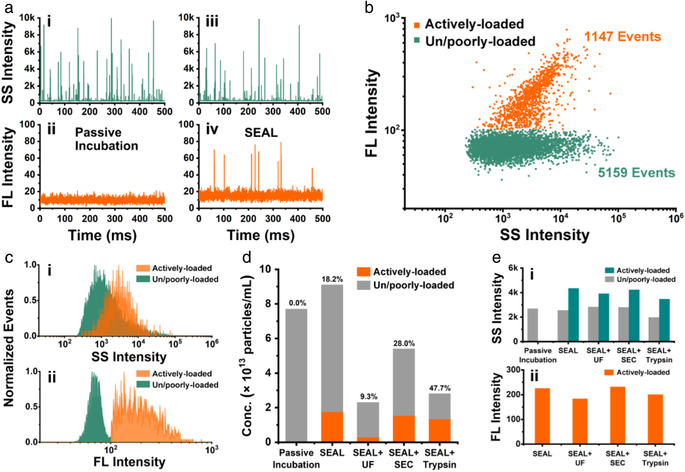
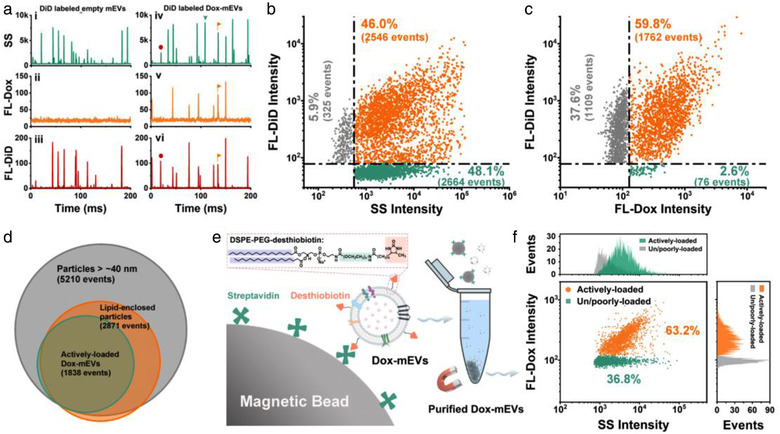
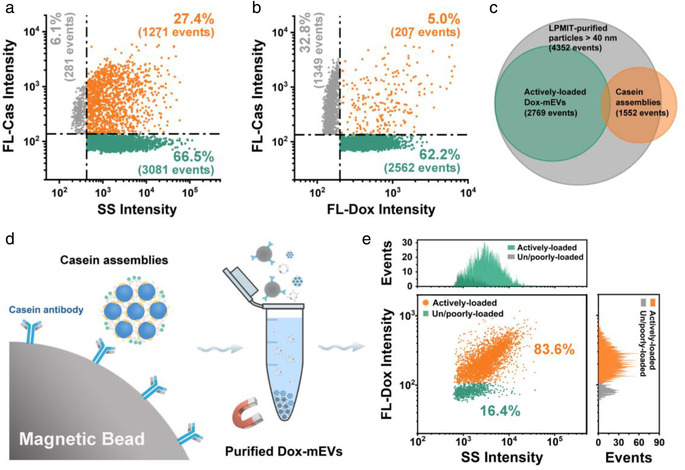
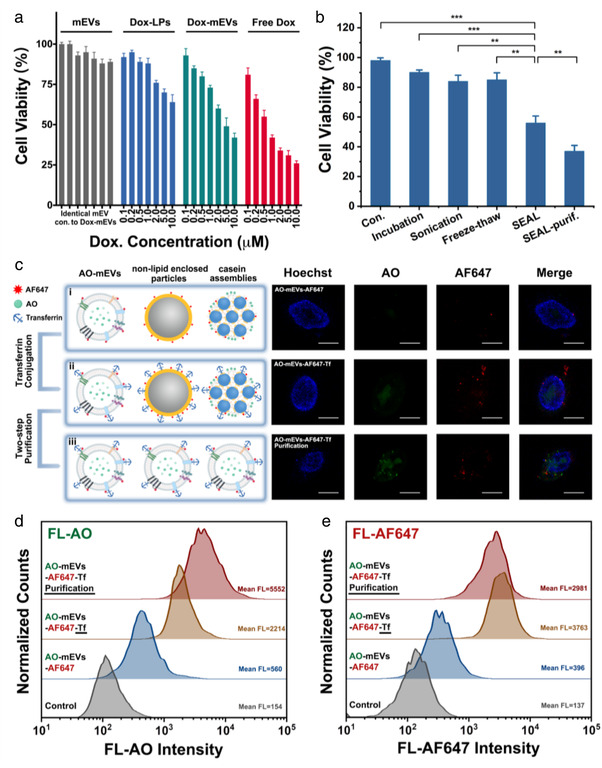
Extracellular vesicles (EVs) have demonstrated unique advantages in serving as nanocarriers for drug delivery, yet the cargo encapsulation efficiency is far from expectation, especially for hydrophilic chemotherapeutic drugs. Besides, the intrinsic heterogeneity of EVs renders it difficult to evaluate drug encapsulation behaviour. Inspired by the active drug loading strategy of liposomal nanomedicines, here we report the development of a method, named “Sonication and Extrusion‐assisted Active Loading” (SEAL), for effective and stable drug encapsulation of EVs. Using doxorubicin‐loaded milk‐derived EVs (Dox‐mEVs) as the model system, sonication was applied to temporarily permeabilize the membrane, facilitating the influx of ammonium sulfate solution into the lumen to establish the transmembrane ion gradient essential for active loading. Along with extrusion to downsize large mEVs, homogenize particle size and reshape the nonspherical or multilamellar vesicles, SEAL showed around 10‐fold enhancement of drug encapsulation efficiency compared with passive loading. Single‐particle analysis by nano‐flow cytometry was further employed to reveal the heterogeneous encapsulation behaviour of Dox‐mEVs which would otherwise be overlooked by bulk‐based approaches. Correlation analysis between doxorubicin auto‐fluorescence and the fluorescence of a lipophilic dye DiD suggested that only the lipid‐enclosed particles were actively loadable. Meanwhile, immunofluorescence analysis revealed that more than 85% of the casein positive particles was doxorubicin free. These findings further inspired the development of the lipid‐probe‐ and immuno‐mediated magnetic isolation techniques to selectively remove the contaminants of non‐lipid enclosed particles and casein assemblies, respectively. Finally, the intracellular assessments confirmed the superior performance of SEAL‐prepared mEV formulations, and demonstrated the impact of encapsulation heterogeneity on therapeutic outcome. The as‐developed cargo‐loading approach and nano‐flow cytometry‐based characterization method will provide an instructive insight in the development of EV‐based delivery systems.
Overview
The claims and statistics of this paper haven’t been checked yet.
Run the check — free, no account needed. It reads the open-access text and checks the sources it cites.
Integrity signals
Registry
Cites
Statistics
Figures
Verification
Claims the paper makes
The claims and statistics of this paper haven’t been checked yet.
Run the check — free, no account needed. It reads the open-access text and checks the sources it cites.
Claims other papers make about this one
Each is checked against this paper’s own text: does it say what the citing paper says it does?
The cited source says what the claim attributes to it.
In the citing paper
“Furthermore, the medication transport efficiency of exosomes as vehicles remains an unresolved issue [280].”
From Emerging role of exosomes in cancer therapy: progress and challenges (2025) · cites this paper as [280]
Self-check
Percentages, sums and reported differences re-computed from the paper’s own numbers.
The self-check needs the paper’s full text.
Citations
Cites
The biology , function , and biomedical applications of exosomes
Kalluri, R., & LeBleu, V. S. (2020) · Science · doi:10.1126/science.aau6977 · Cited by 10,770
Doxil® — The first FDA-approved nano-drug: Lessons learned
Barenholz, Y. (. (2012) · Journal of Controlled Release · doi:10.1016/j.jconrel.2012.03.020 · Cited by 4,792
Pegtel, D. M., & Gould, S. J. (2019) · Annual Review of Biochemistry · doi:10.1146/annurev-biochem-013118-111902 · Cited by 2,682
Exosomes facilitate therapeutic targeting of oncogenic KRAS in pancreatic cancer
Kamerkar, S., LeBleu, V. S., Sugimoto, H., Yang, S., Ruivo, C. F., Melo, S. A., Lee, J. J., & Kalluri, R. (2017) · Nature · doi:10.1038/nature22341 · Cited by 2,639
Evidence-Based Clinical Use of Nanoscale Extracellular Vesicles in Nanomedicine
Fais, S., O’Driscoll, L., Borras, F. E., Buzas, E., Camussi, G., Cappello, F., Carvalho, J., Cordeiro da Silva, A., Del Portillo, H., El Andaloussi, S., et al. (2016) · ACS Nano · doi:10.1021/acsnano.5b08015 · Cited by 481
Extracellular vesicles: A bright star of nanomedicine
Wu, P., Zhang, B., Ocansey, D. K. W., Xu, W., & Qian, H. (2021) · Biomaterials · doi:10.1016/j.biomaterials.2020.120467 · Cited by 368
Research works printed but not linked: 56
- 10.1016/j.tibtech.2018.11.012 · DOI
- 10.3390/pharmaceutics10040218 · DOI
- 10.1016/j.jconrel.2015.07.030 · DOI · Paper page
- 10.1186/s12951-018-0403-9 · DOI
- 10.1016/j.jconrel.2016.01.046 · DOI
- 10.1016/j.bios.2019.02.016 · DOI
- 10.1039/D0NR06309F · DOI
- 10.1021/acsami.7b01867 · DOI
- 10.1016/j.molmed.2018.01.006 · DOI · Paper page
- 10.1146/annurev-food-022811-101214 · DOI
- 10.1021/acs.accounts.9b00109 · DOI
- 10.1016/j.cis.2012.01.002 · DOI
- 10.1080/07388551.2020.1785385 · DOI
- 10.1016/j.addr.2020.04.004 · DOI
- 10.1016/j.jconrel.2016.02.037 · DOI
- 10.1016/j.jconrel.2014.11.029 · DOI
- 10.3390/ijms18061122 · DOI · Paper page
- 10.2147/IJN.S131786 · DOI
- 10.1002/cyto.a.24173 · DOI
- 10.1517/17425247.2011.566552 · DOI
- 10.1016/j.jconrel.2019.06.006 · DOI
- 10.1016/j.jconrel.2016.09.016 · DOI
- 10.1016/j.cell.2019.02.029 · DOI · Paper page
- 10.1016/j.nano.2015.10.012 · DOI · Paper page
- 10.1038/aps.2017.178 · DOI
- 10.1016/j.jconrel.2018.09.001 · DOI
- 10.1016/j.actbio.2018.12.045 · DOI
- 10.7150/thno.30853 · DOI
- 10.1016/j.biomaterials.2019.119475 · DOI
- 10.1016/j.biomaterials.2020.119925 · DOI
- 10.1038/s41568-020-00299-w · DOI
- 10.1038/s41598-017-01731-2 · DOI
- 10.1002/0471142956.cy1314s73 · DOI
- 10.1016/j.jconrel.2014.07.042 · DOI · Paper page
- 10.1007/s11095-014-1573-2 · DOI
- 10.1039/C7NR08360B · DOI
- 10.1016/j.addr.2021.04.012 · DOI · Paper page
- 10.3390/ijms20061349 · DOI
- 10.1021/acs.chemrev.7b00534 · DOI
- 10.2147/IJN.S132780 · DOI
- 10.1080/20013078.2018.1440132 · DOI
- 10.1073/pnas.1324135111 · DOI
- 10.1016/j.biomaterials.2018.03.015 · DOI
- 10.1016/j.biomaterials.2018.03.004 · DOI
- 10.1016/j.biomaterials.2013.11.083 · DOI
- 10.1021/acsnano.7b07782 · DOI
- 10.1016/j.addr.2016.02.006 · DOI · Paper page
- 10.1038/nrm.2017.125 · DOI · Paper page
- 10.7150/thno.37097 · DOI
- 10.1038/s41551-017-0058 · DOI
- 10.1016/j.bios.2020.112056 · DOI
- 10.1021/acsnano.7b00200 · DOI
- 10.1080/03639045.2018.1539743 · DOI
- 10.1002/jev2.12030 · DOI
- 10.1016/j.biopha.2020.110237 · DOI · Paper page
- 10.1021/nn505162u · DOI
Cited by
Sorted by citations
Emerging role of exosomes in cancer therapy: progress and challenges
Li, J., Wang, J., & Chen, Z. (2025) · Molecular Cancer · doi:10.1186/s12943-024-02215-4 · Cited by 297
Self-citationLiang, Y., Iqbal, Z., Lu, J., Wang, J., Zhang, H., Chen, X., Duan, L., & Xia, J. (2023) · Molecular Therapy · doi:10.1016/j.ymthe.2022.10.008 · Cited by 162
Self-citationTanaka, M., Araujo, A. C., Valenti, V. E., Guiguer, E. L., Catharin, V. C. S., Gualhardi, C. M., de Souza Bastos Mazuqueli Pereira, E., de Alvares Goulart, R., de Argolo Haber, R. S., de Carvalho, A. C. A., et al. (2026) · International Journal of Molecular Sciences · doi:10.3390/ijms27052370 · Cited by 13
Metadata
- Authors
- Chen, C., Sun, M., Wang, J., Su, L., Lin, J., & Yan, X.
- Venue
- Journal of Extracellular Vesicles
- Publisher
- Wiley
- Published
- 2021-10-31
- Volume
- 10
- Issue
- 13
- ISSN
- 2001-3078
- PMC
- PMC8558234
- Cited by
- 163
- References
- 6
- Language
- en
- Funders
- Natural Science Foundation of Fujian Province (2019J05097)
- National Natural Science Foundation of China (21627811, 21934004)
About these checks
Registry, retraction, Cites and statistics results are computed, not judged, with one exception: a printed reference that no index lists is read once by a model before it counts as a citation error. Claims are extracted by a model and kept only when their quote appears verbatim in the text; each cited source is then checked, with a model’s help, for whether it says what the claim relies on. Those verdicts can be wrong — read the claim’s quote and the cited source before relying on one.
Statistics and arithmetic are recomputed, not judged.
Confidence bands are shown only for fields calibrated on our annotated test set. None is calibrated yet, so no band is shown.
What counts as a claim ›How we measure confidence ›How we check this ›
Are you an author, or do you see a problem with this page? Request a review
