

The DOI matches its Crossref record; 97 of the 98 references it cites were found in a registry or an index.
Distribution of axon diameters in cortical white matter: an electron-microscopic study on three human brains and a macaque.
Open accessAbstract
The aim of this study was to obtain information on the axonal diameters of cortico-cortical fibres in the human brain, connecting distant regions of the same hemisphere via the white matter. Samples for electron microscopy were taken from the region of the superior longitudinal fascicle and from the transitional white matter between temporal and frontal lobe where the uncinate and inferior occipitofrontal fascicle merge. We measured the inner diameter of cross sections of myelinated axons. For comparison with data from the literature on the human corpus callosum, we also took samples from that region. For comparison with well-fixed material, we also included samples from corresponding regions of a monkey brain (Macaca mulatta). Fibre diameters in human brains ranged from 0.16 to 9 μm. Distributions of diameters were similar in the three systems of cortico-cortical fibres investigated, both in humans and the monkey, with most of the average values below 1 μm diameter and a small population of much thicker fibres. Within individual human brains, the averages were larger in the superior longitudinal fascicle than in the transitional zone between temporal and frontal lobe. An asymmetry between left and right could be found in one of the human brains, as well as in the monkey brain. A correlation was also found between the thickness of the myelin sheath and the inner axon diameter for axons whose calibre was greater than about 0.6 μm. The results are compared to white matter data in other mammals and are discussed with respect to conduction velocity, brain size, cognition, as well as diffusion weighted imaging studies.
Overview
The claims and statistics of this paper haven’t been checked yet.
Run the check — free, no account needed. It reads the open-access text and checks the sources it cites.
Integrity signals
Registry
Cites
Statistics
Figures
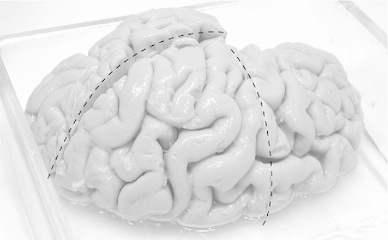
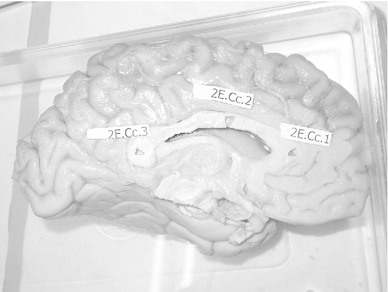
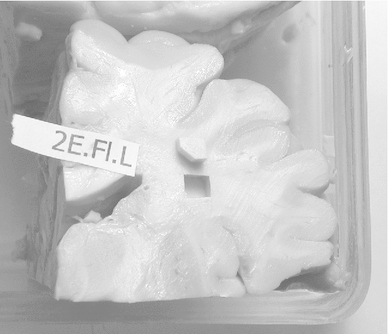
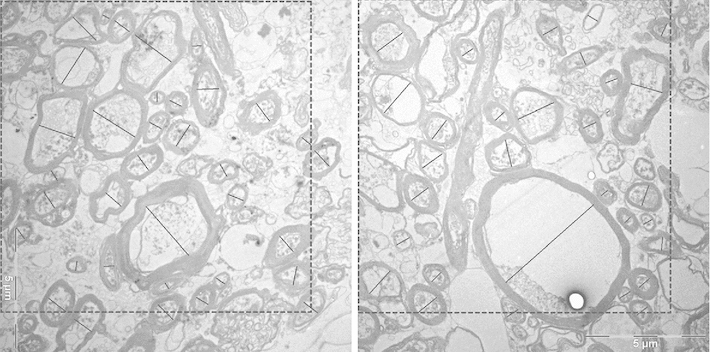
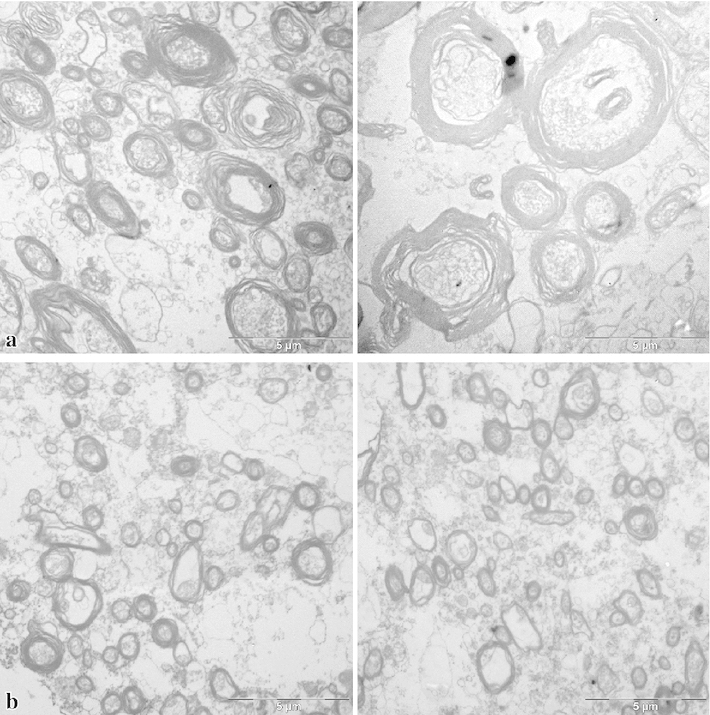
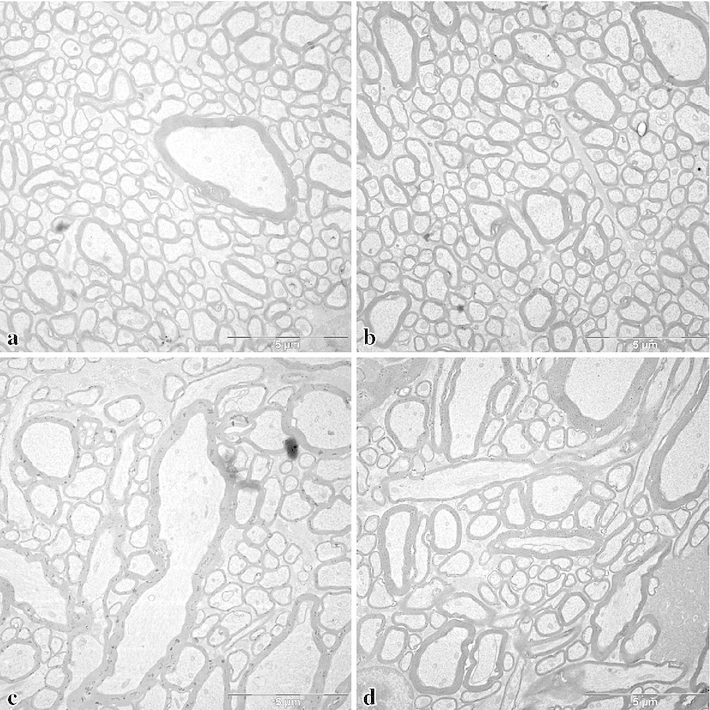
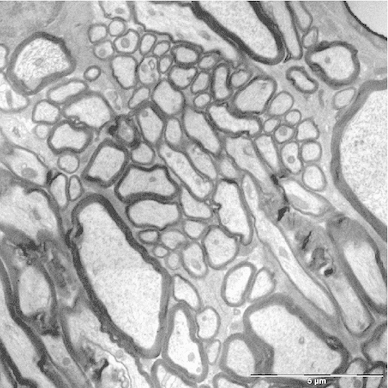
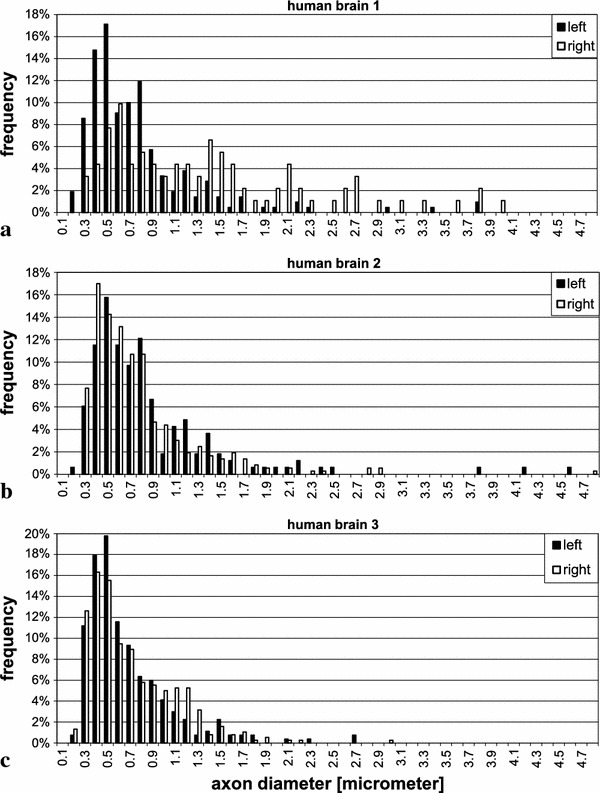
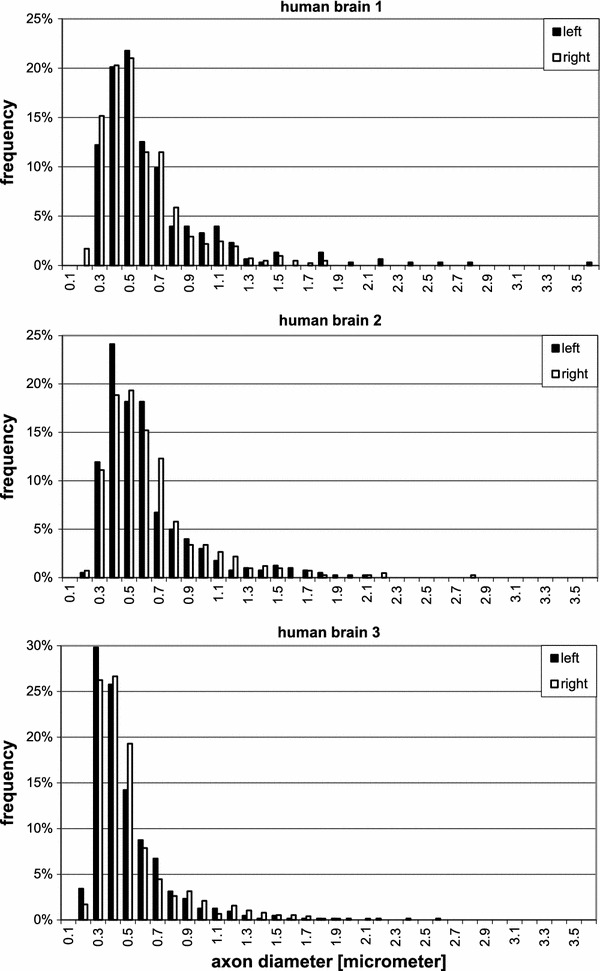
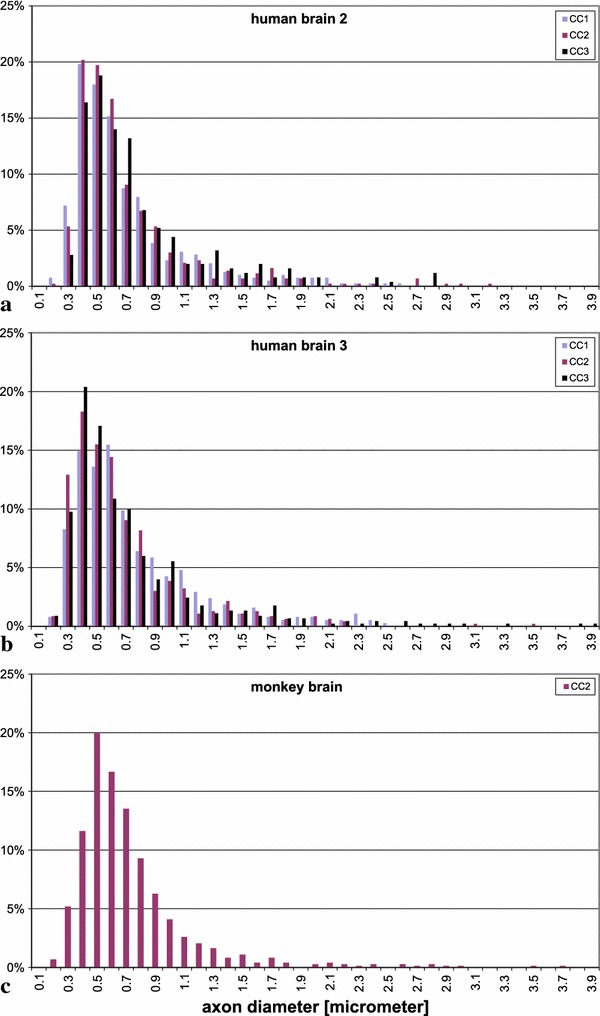
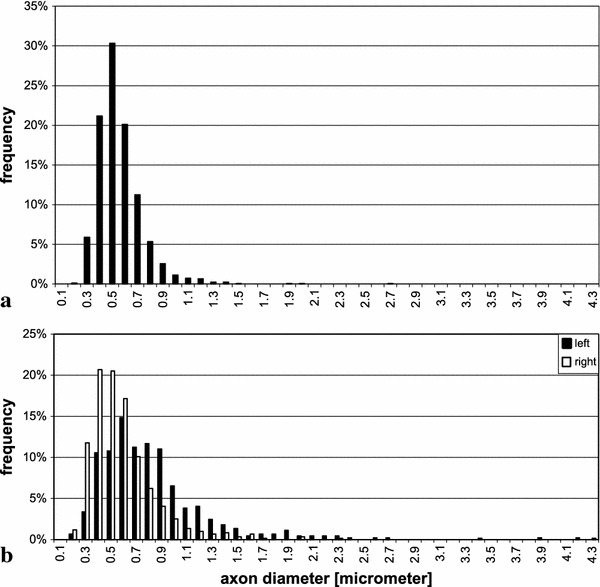
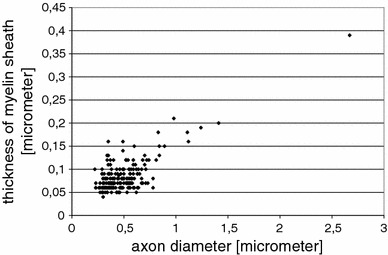
Verification
Claims the paper makes
The claims and statistics of this paper haven’t been checked yet.
Run the check — free, no account needed. It reads the open-access text and checks the sources it cites.
Claims other papers make about this one
Each is checked against this paper’s own text: does it say what the citing paper says it does?
The source backs part of the claim, not all of it — or backs it for a different population, condition or comparison.
In the citing paper
“For example, certain axonal and dendritic domains are less than 0.50 μm in diameter (Shepherd and Harris, 1998), and myelinated axons at three different sites of the corpus callosum in the human brain are estimated to have axon diameters of ≥0.50 μm, in 70–90% of cases (range 0.16–3.73 μm, mean 0.73 ± 0.55 μm) (Liewald et al., 2014).”
From Human Brain/Cloud Interface (2019) · cites this paper as Liewald et al., 2014
Experimental — accuracy not yet measured
Self-check
Percentages, sums and reported differences re-computed from the paper’s own numbers.
The self-check needs the paper’s full text.
Citations
Cites
The structure of the nervous system of the nematode Caenorhabditis elegans
White, J. G., Southgate, E., Thomson, J. N., & Brenner, S. (1986) · Philosophical Transactions of the Royal Society of London. B, Biological Sciences · doi:10.1098/rstb.1986.0056 · Cited by 5,589
Fiber Tract–based Atlas of Human White Matter Anatomy
Wakana, S., Jiang, H., Nagae‐Poetscher, L. M., van Zijl, P. C. M., & Mori, S. (2004) · Radiology · doi:10.1148/radiol.2301021640 · Cited by 2,023
The Fine Structure of the Nervous System.
Tennyson, V. M. (1970) · Archives of Neurology · doi:10.1001/archneur.1970.00480240094019 · Cited by 1,946
Lectu re Notes in Biomathematics
Levin, S. A. (1983) · Cited by 1,568
Fiber tract-based atlas of human white matter anatomy
Wakana, S. (2006) · Medical Entomology and Zoology · Cited by 1,531
Fiber composition of the human corpus callosum
Aboitiz, F., Scheibel, A. B., Fisher, R. S., & Eran Zaidel, B. (1992) · Brain Research · doi:10.1016/0006-8993(92)90178-c · Cited by 1,467
(2009) · Elsevier eBooks · doi:10.1016/c2009-1-03742-3 · Cited by 1,335
The Human Central Nervous System
Nieuwenhuys, R., Voogd, J., & van Huijzen, C. (2008) · doi:10.1007/978-3-540-34686-9 · Cited by 1,262
The Central Nervous System of Vertebrates
Nieuwenhuys, R., ten Donkelaar, H. J., & Nicholson, C. (1998) · doi:10.1007/978-3-642-18262-4 · Cited by 1,249
Cortex: Statistics and Geometry of Neuronal Connectivity
Braitenberg, V., & Schüz, A. (1998) · doi:10.1007/978-3-662-03733-1 · Cited by 1,178
Self-citationMakris, N., Kennedy, D. N., McInerney, S., Sorensen, A. G., Wang, R., Caviness, V. S., & Pandya, D. N. (2005) · Cerebral Cortex · doi:10.1093/cercor/bhh186 · Cited by 1,146
Enforcement of Temporal Fidelity in Pyramidal Cells by Somatic Feed-Forward Inhibition
Pouille, F., & Scanziani, M. (2001) · Science · doi:10.1126/science.1060342 · Cited by 1,097
Polychronization: Computation with Spikes
Izhikevich, E. M. (2005) · Neural Computation · doi:10.1162/089976606775093882 · Cited by 1,082
The Fine Structure of the Nervous System
Afifi, A. K. (1991) · Neurology · doi:10.1212/wnl.41.9.1535-b · Cited by 1,052
The Underpinnings of the BOLD Functional Magnetic Resonance Imaging Signal
Logothetis, N. K. (2003) · Journal of Neuroscience · doi:10.1523/jneurosci.23-10-03963.2003 · Cited by 1,024
Self-citationCONDUCTION VELOCITY AND DIAMETER OF NERVE FIBERS
Hursh, J. B. (1939) · American Journal of Physiology-Legacy Content · doi:10.1152/ajplegacy.1939.127.1.131 · Cited by 916
Scaling Brain Size, Keeping Timing: Evolutionary Preservation of Brain Rhythms
Buzsáki, G., Logothetis, N., & Singer, W. (2013) · Neuron · doi:10.1016/j.neuron.2013.10.002 · Cited by 886
Self-citationAxcaliber: A method for measuring axon diameter distribution from diffusion MRI
Assaf, Y., Blumenfeld‐Katzir, T., Yovel, Y., & Basser, P. J. (2008) · Magnetic Resonance in Medicine · doi:10.1002/mrm.21577 · Cited by 849
Duvernoy, H. M. (1999) · Springer eBooks · doi:10.1007/978-3-7091-6792-2 · Cited by 759
A universal scaling law between gray matter and white matter of cerebral cortex
Zhang, K., & Sejnowski, T. J. (2000) · Proceedings of the National Academy of Sciences · doi:10.1073/pnas.090504197 · Cited by 723
Orientationally invariant indices of axon diameter and density from diffusion MRI
Alexander, D. C., Hubbard, P. L., Hall, M. G., Moore, E. A., Ptito, M., Parker, G. J. M., & Dyrby, T. B. (2010) · NeuroImage · doi:10.1016/j.neuroimage.2010.05.043 · Cited by 683
Ringo, J. L., Doty, R. W., Demeter, S., & Simard, P. Y. (1994) · Cerebral Cortex · doi:10.1093/cercor/4.4.331 · Cited by 648
(1976) · Annals of Internal Medicine · doi:10.7326/0003-4819-85-1-141_2 · Cited by 636
Distinct Profiles of Myelin Distribution Along Single Axons of Pyramidal Neurons in the Neocortex
Tomassy, G. S., Berger, D. R., Chen, H.-H., Kasthuri, N., Hayworth, K. J., Vercelli, A., Seung, H. S., Lichtman, J. W., & Arlotta, P. (2014) · Science · doi:10.1126/science.1249766 · Cited by 600
Horizontal Propagation of Visual Activity in the Synaptic Integration Field of Area 17 Neurons
Bringuier, V., Chavane, F., Glaeser, L., & Frégnac, Y. (1999) · Science · doi:10.1126/science.283.5402.695 · Cited by 507
AXON DIAMETERS IN RELATION TO THE SPIKE DIMENSIONS AND THE CONDUCTION VELOCITY IN MAMMALIAN A FIBERS
Gasser, H. S., & Grundfest, H. (1939) · American Journal of Physiology-Legacy Content · doi:10.1152/ajplegacy.1939.127.2.393 · Cited by 452
Cytological and quantitative characteristics of four cerebral commissures in the rhesus monkey
LaMantia, A., & RAKIC, P. T. (1990) · The Journal of Comparative Neurology · doi:10.1002/cne.902910404 · Cited by 428
Cell assemblies in the cerebral cortex
Palm, G., Knoblauch, A., Hauser, F., & Schüz, A. (2014) · Biological Cybernetics · doi:10.1007/s00422-014-0596-4 · Cited by 405
Self-citationGeneral Organization of Callosal Connections in the Cerebral Cortex
Innocenti, G. M. (1986) · Cerebral cortex · doi:10.1007/978-1-4613-2149-1_9 · Cited by 399
The Cortical Connectivity of the Prefrontal Cortex in the Monkey Brain
Yeterian, E., Pandya, D., Tomaiuolo, F., & Petrides, M. (2011) · Cortex; a journal devoted to the study of the nervous system and behavior · doi:10.1016/j.cortex.2011.03.004 · Cited by 382
Makris, N., Worth, A. J., Papadimitriou, G., Stakes, J. W., Caviness, V. S., Kennedy, D. N., Pandya, D. Ν., Kaplan, E., Sorensen, A. G., Wu, O., et al. (1997) · Annals of Neurology · doi:10.1002/ana.410420617 · Cited by 377
Ungerleider, L. G., Gaffan, D., & Pelak, V. S. (1989) · Experimental Brain Research · doi:10.1007/bf00248903 · Cited by 357
Changes in Prefrontal Axons May Disrupt the Network in Autism
Zikopoulos, B., & Barbas, H. (2010) · The Journal of Neuroscience · doi:10.1523/jneurosci.2257-10.2010 · Cited by 357
Cortico-Hippocampal Interplay and the Representation of Contexts in the Brain
Miller, R. J. (1991) · Studies of brain function · doi:10.1007/978-3-662-21732-0 · Cited by 339
Self-citationWhite Matter Asymmetry in the Human Brain: A Diffusion Tensor MRI Study
Büchel, C., Raedler, T. J., Sommer, M., Sach, M., Weiller, C., & Koch, M. (2004) · Cerebral Cortex · doi:10.1093/cercor/bhh055 · Cited by 335
Why do axons differ in caliber?
Perge, J., Niven, J., Mugnaini, E., Balasubramanian, V., & Sterling, P. (2012) · Journal of Neuroscience · doi:10.1523/jneurosci.4254-11.2012 · Cited by 318
Cell Assemblies in the Cerebral Cortex
Braitenberg, V. (1978) · Lecture notes in biomathematics · doi:10.1007/978-3-642-93083-6_9 · Cited by 312
Functional Trade-Offs in White Matter Axonal Scaling
Wang, S. S. ‐., Shultz, J. R., Burish, M. J., Harrison, K. H., Hof, P. R., Towns, L. C., WAGERS, M. W., & Wyatt, K. D. (2008) · Journal of Neuroscience · doi:10.1523/jneurosci.5559-05.2008 · Cited by 304
Park, H.-J., Westin, C.-F., Kubicki, M., Maier, S. E., Niznikiewicz, M., Baer, A., Frumin, M., Kikinis, R., Jolesz, F. A., McCarley, R. W., et al. (2004) · NeuroImage · doi:10.1016/j.neuroimage.2004.04.036 · Cited by 295
Role of Delays in Shaping Spatiotemporal Dynamics of Neuronal Activity in Large Networks
Roxin, A., Brunel, N., & Hansel, D. (2005) · Physical Review Letters · doi:10.1103/physrevlett.94.238103 · Cited by 290
The intrinsic, association and commissural connections of area 17 of the visual cortex
Fisken, R. A., Garey, L. J., & Powell, T. P. S. (1975) · Philosophical transactions of the Royal Society of London. Series B, Biological sciences · doi:10.1098/rstb.1975.0099 · Cited by 261
Mohajerani, M. H., McVea, D. A., Fingas, M., & Murphy, T. H. (2010) · Journal of Neuroscience · doi:10.1523/jneurosci.6437-09.2010 · Cited by 256
DeFelipe, J., Conley, M., & Jones, E. G. (1986) · Journal of Neuroscience · doi:10.1523/jneurosci.06-12-03749.1986 · Cited by 248
Caminiti, R., Carducci, F., Piervincenzi, C., Battaglia‐Mayer, A., Confalone, G., Visco‐Comandini, F., Pantano, P., & Innocenti, G. M. (2013) · Journal of Neuroscience · doi:10.1523/jneurosci.0761-13.2013 · Cited by 221
Oscillatory Event-Related Brain Dynamics
Pantev, C., Elbert, T. R., & Lütkenhöner, B. (1994) · Springer eBooks · doi:10.1007/978-1-4899-1307-4 · Cited by 198
How the Optic Nerve Allocates Space, Energy Capacity, and Information
Perge, J. A., Koch, K., Miller, R., Sterling, P., & Balasubramanian, V. (2009) · Journal of Neuroscience · doi:10.1523/jneurosci.5200-08.2009 · Cited by 192
Self-citationEvolution amplified processing with temporally dispersed slow neuronal connectivity in primates.
Caminiti, R., Ghaziri, H., Galuske, R., Hof, P. R., & Innocenti, G. M. (2009) · Proceedings of the National Academy of Sciences · doi:10.1073/pnas.0907655106 · Cited by 189
The development of the corpus callosum in cats: A light‐ and electron‐ microscopic study
Berbel, P. J., & Innocenti, G. M. (1988) · The Journal of Comparative Neurology · doi:10.1002/cne.902760109 · Cited by 169
Horizontal synaptic connections in monkey prefrontal cortex: An in vitro electrophysiological study
Gonzalez-Burgos, G. (2000) · Cerebral Cortex · doi:10.1093/cercor/10.1.82 · Cited by 169
Contrast and stability of the axon diameter index from microstructure imaging with diffusion MRI
Dyrby, T., S⊘gaard, L. V., Hall, M., Ptito, M., & Alexander, D. (2012) · Magnetic Resonance in Medicine · doi:10.1002/mrm.24501 · Cited by 162
Species Differences and Similarities in the Fine Structure of the Mammalian Corpus callosum
Olivares, R., Montiel, J. F., & Aboitiz, F. (2001) · Brain Behavior and Evolution · doi:10.1159/000047229 · Cited by 153
Theoretical Approaches to Complex Systems
Heim, R., & Palm, G. (1978) · Springer eBooks · doi:10.1007/978-3-642-93083-6.pdf · Cited by 153
Hildebrand, C., & Hahn, R. G. (1978) · Journal of the Neurological Sciences · doi:10.1016/0022-510x(78)90147-8 · Cited by 148
Rolheiser, T. M., Stamatakis, E. A., & TYLER, L. K. (2011) · Journal of Neuroscience · doi:10.1523/jneurosci.2725-11.2011 · Cited by 145
The Diameter of Cortical Axons Depends Both on the Area of Origin and Target
Innocenti, G. M., Vercelli, A., & Caminiti, R. (2013) · Cerebral Cortex · doi:10.1093/cercor/bht070 · Cited by 138
A biologically motivated and analytically soluble model of collective oscillations in the cortex
Wulfram Gerstner, B., Ritz, R., & van Hemmen, J. L. (1993) · Biological Cybernetics · doi:10.1007/bf00201861 · Cited by 127
The patterns and synaptic properties of horizontal intracortical connections in the rat motor cortex
Aroniadou, V. A., & Keller, A. (1993) · Journal of Neurophysiology · doi:10.1152/jn.1993.70.4.1553 · Cited by 127
Brain size and the evolution of mind
Jerison, H. J. (1989) · Biodiversity Heritage Library (Smithsonian Institution) · doi:10.5281/zenodo.16400392 · Cited by 122
Some additional parametric variations between peripheral nerve fibre populations.
Williams, P. L., & Wendell‐Smith, C. P. (1971) · PubMed · Cited by 113
The Human Cortical White Matter
Braitenberg, V., & Sch√ºz, A. (2002) · Conceptual advances in brain research · doi:10.1201/9780203299296.ch16 · Cited by 112
Self-citationAreal Differences in Diameter and Length of Corticofugal Projections
Tomasi, S., Caminiti, R., & Innocenti, G. M. (2012) · Cerebral Cortex · doi:10.1093/cercor/bhs011 · Cited by 106
Das Zentralnervensystem in Zahlen und Tabellen
Blinkov, S. M., & Glezer, I. I. (1968) · Medical Entomology and Zoology · Cited by 94
Structural basis of cortical synchronization. II. Effects of cortical lesions
Munk, M., Nowak, L. G., Nelson, J. I., & Bullier, J. (1995) · Journal of Neurophysiology · doi:10.1152/jn.1995.74.6.2401 · Cited by 84
The Human Cortical White Matter
Schüz, A., & Braitenberg, V. (2010) · Taylor & Francis eBooks · doi:10.4324/9780203219911_chapter_16 · Cited by 78
Self-citationDistribution and properties of commissural and other neurons in cat sensorimotor cortex
Miller, R. J. (1975) · The Journal of Comparative Neurology · doi:10.1002/cne.901640307 · Cited by 76
Self-citationCharacteristics of interhemispheric impulse conduction between prelunate gyri of the rhesus monkey
Swadlow, H. A., Rosene, D. L., & Waxman, S. G. (1978) · Experimental Brain Research · doi:10.1007/bf00235567 · Cited by 71
Brain extracellular space fixed for electron microscopy
Cragg, B. G. (1979) · Neuroscience Letters · doi:10.1016/0304-3940(79)96130-5 · Cited by 71
Axonal Velocity Distributions in Neural Field Equations
Bojak, I., & Liley, D. T. J. (2010) · PLoS Computational Biology · doi:10.1371/journal.pcbi.1000653 · Cited by 71
Basic Connectivity of the Cerebral Cortex and some Considerations on the Corpus Callosum
Schüz, A., & Preiβl, H. (1996) · Neuroscience & Biobehavioral Reviews · doi:10.1016/0149-7634(95)00069-0 · Cited by 67
Self-citation(2000) · CRC Press eBooks · doi:10.1201/9781482284102 · Cited by 65
Overcoming the failure of electronmicroscopy to preserve the brain's extracellular space
Cragg, B. G. (1979) · Trends in Neurosciences · doi:10.1016/0166-2236(79)90062-6 · Cited by 64
The Human Brain: A Photographic Guide
Damasio, A. R. (1981) · Archives of Neurology · doi:10.1001/archneur.1981.00510060101030 · Cited by 63
A biologically motivated and analytically soluble model of collective oscillations in the cortex
Ritz, R., Wulfram Gerstner, B., Fuentes, U., & van Hemmen, J. L. (1994) · Biological Cybernetics · doi:10.1007/bf00239622 · Cited by 57
Axonal Conduction Time and Human Cerebral Laterality: A Psycological Theory
Miller, R. J. (1996) · Cited by 55
Self-citationThe cholinergic innervation of the rat cerebral cortex shows two distinct phases in development
Dori, I., & Parnavelas, J. G. (1989) · Experimental Brain Research · doi:10.1007/bf00247899 · Cited by 54
A detailed morphometrical analysis of the pyramidal tract of the rat
Leenen, L. P. H., Meek, J., Posthuma, P. R., & Nieuwenhuys, R. (1985) · Brain Research · doi:10.1016/0006-8993(85)91413-1 · Cited by 54
Nicholson, C., & Hrabětová, S. (2006) · Frontiers in neuroengineering series/Frontiers in neuroengineering · doi:10.1201/9781420005868.ch10 · Cited by 46
Giant neural systems in the inner retina and optic nerve of small whales
Dawson, W. W., Hawthorne, M. N., Jenkins, R. L., & Goldston, R. T. (1982) · The Journal of Comparative Neurology · doi:10.1002/cne.902050102 · Cited by 45
Partadiredja, G., Miller, R. J., & Oorschot, D. E. (2003) · Journal of Neurocytology · doi:10.1023/b:neur.0000021910.65920.41 · Cited by 44
Self-citationLiu, X., & Schumann, C. M. (2014) · Acta Neuropathologica Communications · doi:10.1186/2051-5960-2-42 · Cited by 43
Small-Diameter Nonmyelinated Axons in the Primate Corpus Callosum
Swadlow, H. A., Waxman, S. G., & Geschwind, N. (1980) · Archives of Neurology · doi:10.1001/archneur.1980.00500510072016 · Cited by 43
Modeling distributed axonal delays in mean-field brain dynamics
Roberts, J. A., & Robinson, P. A. (2008) · Physical Review E · doi:10.1103/physreve.78.051901 · Cited by 39
Axonal projections and conduction properties of olfactory peduncle neurons in the rat
Moyano, H. F., & Molina, J. C. (1980) · Experimental Brain Research · doi:10.1007/bf00237113 · Cited by 37
Miller, R. J. (1987) · Psychobiology · doi:10.3758/bf03327275 · Cited by 35
Self-citationBianchi, M., & Panerai, A. E. (1995) · Brain Research Bulletin · doi:10.1016/0361-9230(94)00174-y · Cited by 34
Hoffmeister, B., Jänig, W., & Lisney, S. J. W. (1991) · Neuroscience · doi:10.1016/0306-4522(91)90402-a · Cited by 34
The Human Brain: A Photographic Guide
Gluhbegovic, N., & Williams, T. H. (1980) · Cited by 32
Information Flow along Neocortical Axons
Swadlow, H. A. (2010) · Taylor & Francis eBooks · doi:10.4324/9780203304570_chapter_4 · Cited by 28
Sultan, F. R. (2000) · Neuroscience Letters · doi:10.1016/s0304-3940(99)00984-2 · Cited by 26
What is the Contribution of Axonal Conduction Delay to Temporal Structure in Brain Dynamics?
Miller, R. J. (1994) · Springer eBooks · doi:10.1007/978-1-4899-1307-4_6 · Cited by 20
Self-citationCowley, A. R. (1983) · PubMed Central · Cited by 17
Schüz, A., & Gp, D. (1995) · PubMed · Cited by 16
Self-citationA Neurodynamic Theory of Schizophrenia (and Related Disorders)
Jellinger, K. A. (2009) · European Journal of Neurology · doi:10.1111/j.1468-1331.2008.02482.x · Cited by 14
Brain Connectivity and Brain Size
Schüz, A., & Sultan, F. R. (2009) · Elsevier eBooks · doi:10.1016/b978-008045046-9.00937-2 · Cited by 8
Self-citationAxonal conduction time and human cerebral laterality : a psychobiological theory/ by Robert Miller
Miller, R. J. (1996) · Harwood Academic Publishers eBooks · Cited by 8
Self-citationQuantitative Analysis of the Optic Nerve of the Horse(Thoroughbred).
Guo, X., Aoyama, M., & Sugita, S. (2001) · Journal of Veterinary Medical Science · doi:10.1292/jvms.63.971 · Cited by 6
Research works printed but not linked: 5
- Aboitiz F, Ide A, Olivares R (2003) Corpus callosum morphology in relation to cerebral asymmetries in the postmortem human. In: Zaidel E, Iacoboni M (eds) The parallel brain: the cognitive neuroscience of the corpus callosum. MIT Press, Cambridge, pp 33–46
- Allman J (1999) Evolving brains. Scientific American Library, New York
- Bürgel U (1999) Kartierung langer Faserbahnen im adulten menschlichen Gehirn. Geschlechtsunterschiede, Lateralisation und Variabilität. Dissertation at the Faculty of Medicine, Heinrich-Heine-Universität Düsseldorf
- Häggqvist G (1936) Analyse der Faserverteilung in einem Rückenmarkquerschnitt (Th 3). Z Mikrosk Anat Forsch 39:1–34
- Palay LS, Chan-Palay V (1974) Cereb Cortex. Springer, Berlin
Cited by
Sorted by citations
The Human Connectome Project's neuroimaging approach
Glasser, M. F., Smith, S. M., Marcus, D. S., Andersson, J. L. R., Auerbach, E. J., Behrens, T. E. J., Coalson, T. S., Harms, M. P., Jenkinson, M., Moeller, S., et al. (2016) · Nature Neuroscience · doi:10.1038/nn.4361 · Cited by 1,090
Investigating white matter fibre density and morphology using fixel-based analysis.
Raffelt, D. A., Tournier, J.-D., Smith, R. E., Vaughan, D. N., Jackson, G., Ridgway, G. R., & Connelly, A. (2017) · NeuroImage · doi:10.1016/j.neuroimage.2016.09.029 · Cited by 620
“However, most white matter voxels are known to contain crossing fibres (Jeurissen et al., 2012), and voxel-averaged measures such as FA are not fibre-specific (or even erroneous) in such regions, which confounds interpretation of apparent differences (Douaud et al., 2011; Pierpaoli et al., 2001;…”
BackgroundQuantifying brain microstructure with diffusion MRI: Theory and parameter estimation
Novikov, D. S., Fieremans, E., Jespersen, S. N., & Kiselev, V. G. (2019) · NMR in Biomedicine · doi:10.1002/nbm.3998 · Cited by 581
MRI in traumatic spinal cord injury: from clinical assessment to neuroimaging biomarkers
Freund, P., Seif, M., Weiskopf, N., Friston, K. J., Fehlings, M. G., Thompson, A. J., & Curt, A. E. P. (2019) · The Lancet Neurology · doi:10.1016/s1474-4422(19)30138-3 · Cited by 225
Noninvasive quantification of axon radii using diffusion MRI
Veraart, J., Nunes, D., Rudrapatna, U. S., Fieremans, E., Jones, D. K., Novikov, D. S., & Shemesh, N. (2020) · eLife · doi:10.7554/elife.49855 · Cited by 185
Metadata
- Authors
- Liewald, D., Miller, R., Logothetis, N., Wagner, H.-J., & Schüz, A.
- Affiliations
- Max Planck Institute for Biological Cybernetics (DE)
- University of Otago (NZ)
- University of Tübingen (DE)
- Corresponding author
- Schüz, Almut
- Venue
- Biological Cybernetics
- Published
- 2014-08-21
- Volume
- 108
- Issue
- 5
- Pages
- 541-557
- ISSN
- 0340-1200 (ISSN-L)
- 1432-0770
- PMC
- PMC4228120
- OpenAlex
- W2046529900
- Cited by
- 322
- References
- 98
- Citations by year
- 2026: 16 · 2025: 28 · 2024: 25 · 2023: 36 · 2022: 39 · 2021: 37 · 2020: 39 · 2019: 35 · 2018: 28 · 2017: 14 · 2016: 21 · 2015: 4
- FWCI
- 10.17
- Type
- journal article
- Language
- en
- Open access
- hybrid
- doi.org
- Locations
- Biological Cybernetics (publishedVersion, cc-by)
- Europe PMC (PubMed Central) (publishedVersion, cc-by)
- PubMed Central (publishedVersion, cc-by)
- PubMed (publishedVersion)
- MPG.PuRe (Max Planck Society) (submittedVersion, other-oa)
- Max Planck Digital Library (submittedVersion)
- Topics
- Health Sciences › Medicine › Radiology, Nuclear Medicine and Imaging › Advanced Neuroimaging Techniques and Applications
- Health Sciences › Medicine › Anatomy › Classical Anatomy and Histology
- Life Sciences › Neuroscience › Cognitive Neuroscience › Visual perception and processing mechanisms
- Keywords
- axon diameter, cortical white matter, superior longitudinal fasciculus, corpus callosum, myelinated axons, myelin thickness, hemispheric lateralization, human brain, macaque brain, conduction velocity, diffusion-weighted imaging
- MeSH terms
- Aged, Aged, 80 and over, Animals, Axons, Cerebral Cortex, Humans, Functional Laterality, Macaca mulatta, Male, Myelin Sheath, Electron Microscope Tomography, White Matter
About these checks
Registry, retraction, Cites and statistics results are computed, not judged, with one exception: a printed reference that no index lists is read once by a model before it counts as a citation error. Claims are extracted by a model and kept only when their quote appears verbatim in the text; each cited source is then checked, with a model’s help, for whether it says what the claim relies on. Those verdicts can be wrong — read the claim’s quote and the cited source before relying on one.
Statistics and arithmetic are recomputed, not judged.
Confidence bands are shown only for fields calibrated on our annotated test set. None is calibrated yet, so no band is shown.
What counts as a claim ›How we measure confidence ›How we check this ›
Are you an author, or do you see a problem with this page? Request a review
