

The DOI matches its Crossref record; 53 of the 54 references it cites were found in a registry or an index; 2 of the 29 sources its claims cite were checked for support.
Understanding Heterogeneity in Clinical Cohorts Using Normative Models: Beyond Case-Control Studies
Open accessAbstract
BACKGROUND: Despite many successes, the case-control approach is problematic in biomedical science. It introduces an artificial symmetry whereby all clinical groups (e.g., patients and control subjects) are assumed to be well defined, when biologically they are often highly heterogeneous. By definition, it also precludes inference over the validity of the diagnostic labels. In response, the National Institute of Mental Health Research Domain Criteria proposes to map relationships between symptom dimensions and broad behavioral and biological domains, cutting across diagnostic categories. However, to date, Research Domain Criteria have prompted few methods to meaningfully stratify clinical cohorts. METHODS: We introduce normative modeling for parsing heterogeneity in clinical cohorts, while allowing predictions at an individual subject level. This approach aims to map variation within the cohort and is distinct from, and complementary to, existing approaches that address heterogeneity by employing clustering techniques to fractionate cohorts. To demonstrate this approach, we mapped the relationship between trait impulsivity and reward-related brain activity in a large healthy cohort (N = 491). RESULTS: We identify participants who are outliers within this distribution and show that the degree of deviation (outlier magnitude) relates to specific attention-deficit/hyperactivity disorder symptoms (hyperactivity, but not inattention) on the basis of individualized patterns of abnormality. CONCLUSIONS: Normative modeling provides a natural framework to study disorders at the individual participant level without dichotomizing the cohort. Instead, disease can be considered as an extreme of the normal range or as-possibly idiosyncratic-deviation from normal functioning. It also enables inferences over the degree to which behavioral variables, including diagnostic labels, map onto biology.
Overview
AI snapshot
Written from the paper’s full text.
TL;DR
The paper introduces normative modeling with Gaussian process regression to parse heterogeneity in clinical cohorts without dichotomizing into case-control groups. In 491 healthy Human Connectome Project participants, it maps delay discounting to reward-related brain activity and shows that deviation magnitude relates to ADHD hyperactivity but not inattention.
Key findings
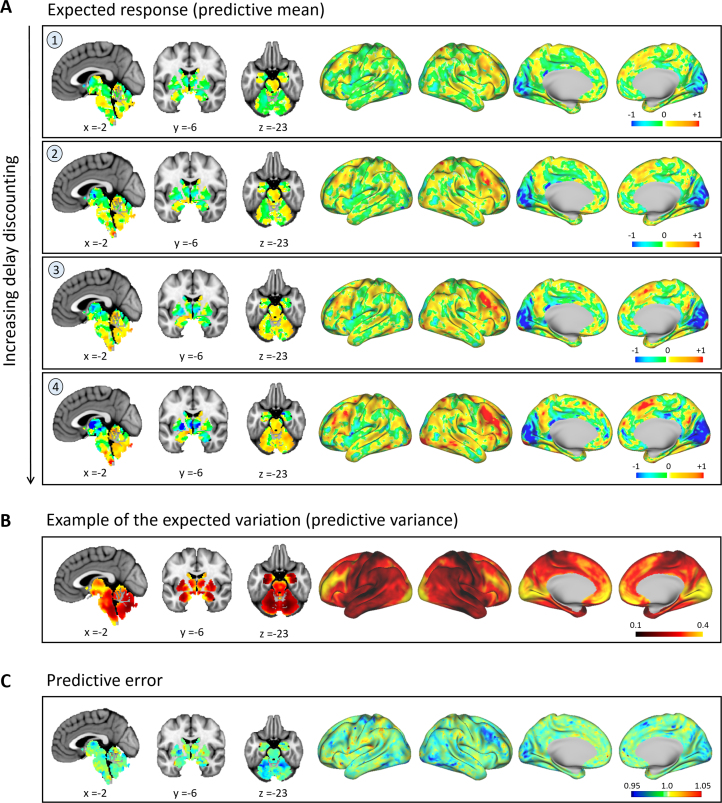
- The normative model predicted that participants who discount rewards more strongly also more strongly engage a network of cortical and subcortical regions; this network overlaps with, but is not identical to, the gambling-task network.
- Most participants fit the normative model well, including many with high hyperactivity (>8); none of these showed brainordinates deviating from the norm (p < .05, false discovery rate corrected) or were outliers under extreme value distributions (all p > .05).
- Negative deviance correlated with hyperactivity for the top 1% of maximal deviation (r = .91, p = .03, n = 5), top 5% (r = .53, p = .007, n = 25), 10% (r = .31, p = .03, n = 50), 15% (r = .36, p = .002, n = 74), and 20% (r = .22, p = .03, n = 99); positive deviance did not correlate with hyperactivity (all p > .4).
- Deviance was not associated with inattention (all p > .2); 22 participants had normative probability maps with brain regions deviating from the normative model (p < .05, false discovery rate corrected), and no brain region deviated in more than three participants.
Methods
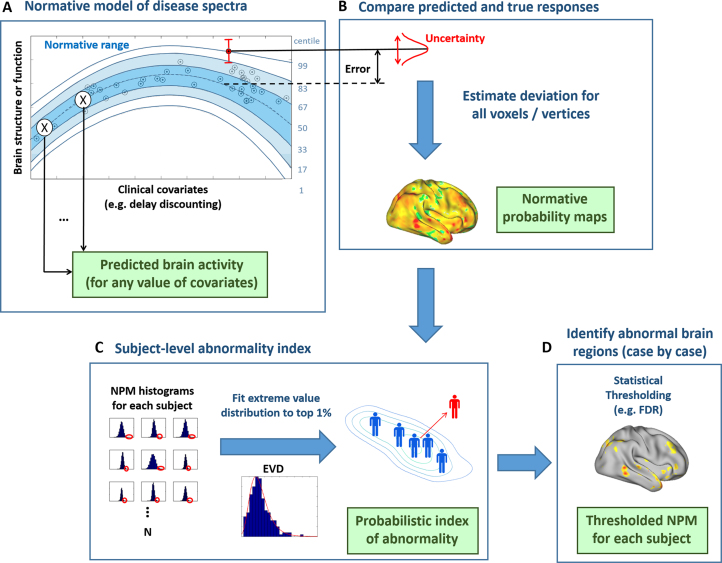
- Gaussian process regression was used to build normative models independently for each brain region, predicting reward-related functional MRI activity from delay discounting; normative probability map Z scores and extreme value statistics summarized subject-level abnormality.
- The sample was 491 healthy Human Connectome Project participants (288 females; mean age 27 years, range 22–36 years) who completed an incentive processing gambling task, the Achenbach Adult Self-Report, and a delay discounting task; ADHD symptom means were 3.03 for inattention, 2.37 for hyperactivity, and 5.40 for total scores.
- Model estimation used 10-fold cross-validation accommodating family structure; analyses related deviations to inattention and hyperactivity, with additional checks excluding high head motion and regressing out motion-related components.
Limitations
- The paper states three areas for future work: evaluating stability of abnormality indices over time, handling extremely large data sets because Gaussian process models scale poorly computationally, and improving model accuracy by modeling spatial correlations.
- The paper notes that head motion is an important source of artifactual variation in functional MRI; it reports excluding high-motion subjects and repeating analyses after motion correction, with conclusions remaining valid.
- Evident from the text: the demonstration uses a single healthy cohort and relates deviations to self-reported ADHD symptoms rather than a clinical ADHD cohort, so clinical validation and longitudinal stability are not established here.
Model-written summary. Check it against the paper before relying on it.
Integrity signals
Registry
Cites
Statistics
Figures
Verification
Claims the paper makes
36 Own interpretation · 21 Own result · 20 Not checked yet · 11 No basis given · 2 Own method · 1 Partly supported · accuracy not yet measured
A result the paper reports from its own data — it cites no other source for it, so there is none to check. The quote shows it is in the paper.
In the paper
“Furthermore, a strong positive correlation (r = .91, p = .03) was found between the negative deviance and hyperactivity for the 1% of participants showing maximal deviation (n = 5).”
§ Understanding Heterogeneity in Clinical Cohorts Using Normative Models: Beyond Case-Control Studies > Results > Clinical Correlates of Abnormality Index
boostedcorrelationaln = 5 ·- Asserted: passes — The authors put it forward as true.
- Checkable: passes — It can be checked against evidence.
- Load-bearing: passes — The paper’s conclusions depend on it.
- Based: passes — The paper gives a reason why it holds.
A result the paper reports from its own data — it cites no other source for it, so there is none to check. The quote shows it is in the paper.
In the paper
“The degree of deviation was not only informative about the most extreme subjects because the correlation persisted into the bulk of the population, remaining significant for the participants having negative deviance in the top 5% (r = .53, p = .007, n = 25), 10% (r = .31, p = .03, n = 50), 15% (r = .36, p = .002, n = 74), and 20% (r = .22, p = .03, n = 99) of the cohort.”
§ Understanding Heterogeneity in Clinical Cohorts Using Normative Models: Beyond Case-Control Studies > Results > Clinical Correlates of Abnormality Index
plaincorrelationaln = 99 ·- Asserted: passes — The authors put it forward as true.
- Checkable: passes — It can be checked against evidence.
- Load-bearing: passes — The paper’s conclusions depend on it.
- Based: passes — The paper gives a reason why it holds.
A result the paper reports from its own data — it cites no other source for it, so there is none to check. The quote shows it is in the paper.
In the paper
“and, as expected, corresponds to the regions that the normative model predicted accurately under cross-validation (Figure 4C).”
§ Understanding Heterogeneity in Clinical Cohorts Using Normative Models: Beyond Case-Control Studies > Results > Overview of Normative Model
plaincorrelational- Asserted: passes — The authors put it forward as true.
- Checkable: passes — It can be checked against evidence.
- Load-bearing: unclear — It is unclear whether the paper’s conclusions depend on it.
- Based: passes — The paper gives a reason why it holds.
A result the paper reports from its own data — it cites no other source for it, so there is none to check. The quote shows it is in the paper.
In the paper
“Subjects with the highest absolute deviance did not show high inattention (Supplemental Figure S2)”
§ Understanding Heterogeneity in Clinical Cohorts Using Normative Models: Beyond Case-Control Studies > Results > Clinical Correlates of Abnormality Index
plain- Asserted: passes — The authors put it forward as true.
- Checkable: passes — It can be checked against evidence.
- Load-bearing: passes — The paper’s conclusions depend on it.
- Based: passes — The paper gives a reason why it holds.
A result the paper reports from its own data — it cites no other source for it, so there is none to check. The quote shows it is in the paper.
In the paper
“The patterns of abnormality were highly individualized with low overlap between subjects; no brain region deviated in more than three participants (Supplemental Figure S4), pointing toward significant heterogeneity of the imaging phenotype within this cohort.”
§ Understanding Heterogeneity in Clinical Cohorts Using Normative Models: Beyond Case-Control Studies > Results > Deviating Subjects
plainn = 3- Asserted: passes — The authors put it forward as true.
- Checkable: passes — It can be checked against evidence.
- Load-bearing: passes — The paper’s conclusions depend on it.
- Based: passes — The paper gives a reason why it holds.
A result the paper reports from its own data — it cites no other source for it, so there is none to check. The quote shows it is in the paper.
In the paper
“In contrast, deviance was not associated with inattention.”
§ Understanding Heterogeneity in Clinical Cohorts Using Normative Models: Beyond Case-Control Studies > Results > Clinical Correlates of Abnormality Index
plain- Asserted: passes — The authors put it forward as true.
- Checkable: passes — It can be checked against evidence.
- Load-bearing: passes — The paper’s conclusions depend on it.
- Based: passes — The paper gives a reason why it holds.
A result the paper reports from its own data — it cites no other source for it, so there is none to check. The quote shows it is in the paper.
In the paper
“These participants score in the 99th and 97th percentiles for hyperactivity within the cohort.”
§ Understanding Heterogeneity in Clinical Cohorts Using Normative Models: Beyond Case-Control Studies > Results > Clinical Correlates of Abnormality Index
plain- Asserted: passes — The authors put it forward as true.
- Checkable: passes — It can be checked against evidence.
- Load-bearing: unclear — It is unclear whether the paper’s conclusions depend on it.
- Based: passes — The paper gives a reason why it holds.
A result the paper reports from its own data — it cites no other source for it, so there is none to check. The quote shows it is in the paper.
In the paper
“To illustrate, we map the relationship between trait impulsivity and reward-related brain activity in a large, healthy sample.”
§ Understanding Heterogeneity in Clinical Cohorts Using Normative Models: Beyond Case-Control Studies > Abstract > Conclusions
plaincorrelational- Asserted: passes — The authors put it forward as true.
- Checkable: passes — It can be checked against evidence.
- Load-bearing: passes — The paper’s conclusions depend on it.
- Based: passes — The paper gives a reason why it holds.
A result the paper reports from its own data — it cites no other source for it, so there is none to check. The quote shows it is in the paper.
In the paper
“None of the corresponding positive deviance scores correlated with hyperactivity (all p > .4).”
§ Understanding Heterogeneity in Clinical Cohorts Using Normative Models: Beyond Case-Control Studies > Results > Clinical Correlates of Abnormality Index
plain- Asserted: passes — The authors put it forward as true.
- Checkable: passes — It can be checked against evidence.
- Load-bearing: passes — The paper’s conclusions depend on it.
- Based: passes — The paper gives a reason why it holds.
In the paper
“It is also consistent with the network engaged by delay discounting (41)”
§ Understanding Heterogeneity in Clinical Cohorts Using Normative Models: Beyond Case-Control Studies > Results > Overview of Normative Model
What the sources say
- Not checked yetcites [41] Wesley, 2014, Remember the future II: Meta-analyses and functional overlap of working memory and delay discounting, Biol Psychiatry source
plaincorrelational- Asserted: passes — The authors put it forward as true.
- Checkable: passes — It can be checked against evidence.
- Load-bearing: unclear — It is unclear whether the paper’s conclusions depend on it.
- Based: passes — The paper gives a reason why it holds.
- It may state two separate claims as one. 22
- Probably not a substantial claim. 28
The cited sources support only part of this claim — read each source’s verdict below.
In the paper
“However, to date, Research Domain Criteria have prompted few methods to meaningfully stratify clinical cohorts.”
- Also stated in: § Conclusions · plain
“The RDoC initiative has prompted considerable discussion (4, 5) but to date has led to few methods to study heterogeneity within clinical cohorts.”
§ Understanding Heterogeneity in Clinical Cohorts Using Normative Models: Beyond Case-Control Studies > Abstract > Background
What the sources say
- Partly supportedcites [4] Cuthbert, 2014, The RDoC framework: Facilitating transition from ICD/DSM to dimensional approaches that integrate neuroscience and psychopathology, World Psychiatry sourceExperimental — accuracy not yet measured
In “RDoC and Treatment Development” (page unavailable), the paper says that distinguishing treatment-relevant subtypes requires valid measures and that, for its fear-response example, there are multiple candidates but no validated methods. This supports a limited concern about cohort stratification, but the paper does not assess how many stratification methods the RDoC initiative has prompted overall. (LLM, conf=0.78)
- Could not verifycites [5] Weinberger, 2014, RDoCs redux, World Psychiatry sourceExperimental — accuracy not yet measured
The commentary “RDoCs redux” (page unavailable) questions whether RDoC dimensions can improve psychiatric diagnosis, but it does not assess how many methods RDoC has prompted or whether those methods stratify clinical cohorts. Searches for stratification, clinical subgroups, and methods found no passage addressing that specific claim. (LLM, conf=0.72)
plain- Asserted: passes — The authors put it forward as true.
- Checkable: passes — It can be checked against evidence.
- Load-bearing: passes — The paper’s conclusions depend on it.
- Based: passes — The paper gives a reason why it holds.
It may state two separate claims as one.
- Also stated in: § Conclusions · plain
A result the paper reports from its own data — it cites no other source for it, so there is none to check. The quote shows it is in the paper.
In the paper
“and neither the positive nor negative deviance correlated with inattention (all p > .2).”
§ Understanding Heterogeneity in Clinical Cohorts Using Normative Models: Beyond Case-Control Studies > Results > Clinical Correlates of Abnormality Index
plain- Asserted: passes — The authors put it forward as true.
- Checkable: passes — It can be checked against evidence.
- Load-bearing: passes — The paper’s conclusions depend on it.
- Based: passes — The paper gives a reason why it holds.
It may state two separate claims as one.
In the paper
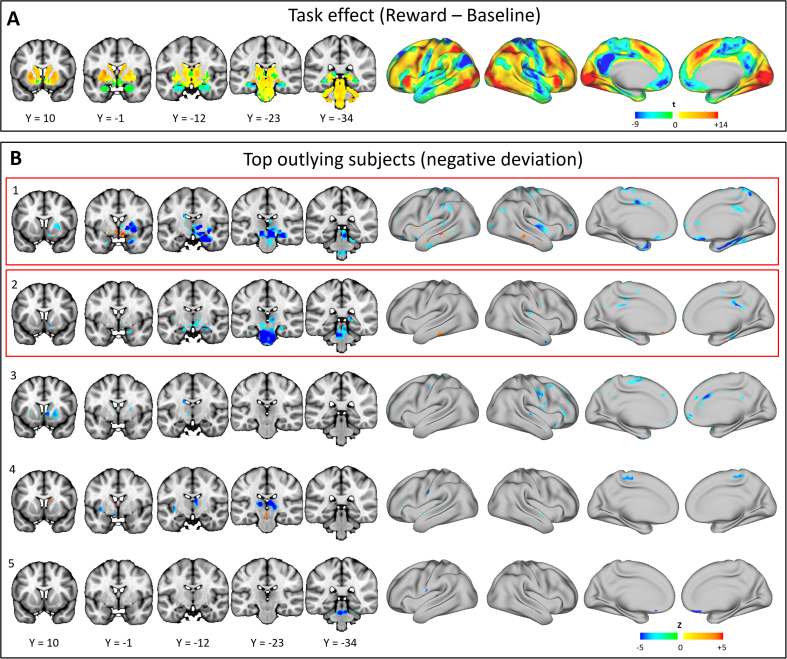
“This network overlaps with, but is not identical to, the network activated by the gambling task [Figure 6 in Barch et al. (39); see also Figure 6A later on].”
§ Understanding Heterogeneity in Clinical Cohorts Using Normative Models: Beyond Case-Control Studies > Results > Overview of Normative Model
What the sources say
- Not checked yetcites Barch et al. (39) Barch, 2013, Function in the human connectome: Task-fMRI and individual differences in behavior, Neuroimage source
plaincorrelational- Asserted: passes — The authors put it forward as true.
- Checkable: passes — It can be checked against evidence.
- Load-bearing: unclear — It is unclear whether the paper’s conclusions depend on it.
- Based: passes — The paper gives a reason why it holds.
It may state two separate claims as one.
A result the paper reports from its own data — it cites no other source for it, so there is none to check. The quote shows it is in the paper.
In the paper
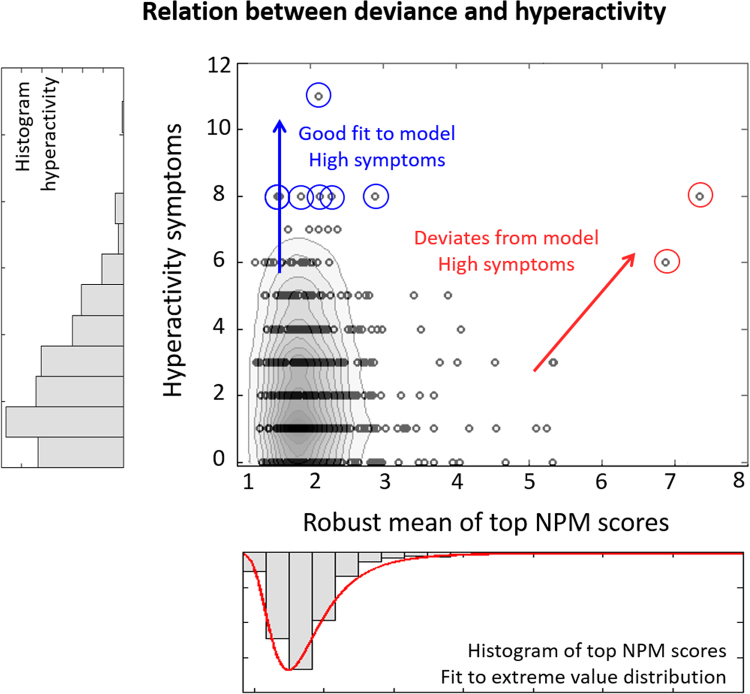
“Second, not all participants fit this pattern; other subjects have high hyperactivity but deviate from the normative model (Figure 5, red circles).”
§ Understanding Heterogeneity in Clinical Cohorts Using Normative Models: Beyond Case-Control Studies > Results > Clinical Correlates of Abnormality Index
plain- Asserted: passes — The authors put it forward as true.
- Checkable: passes — It can be checked against evidence.
- Load-bearing: passes — The paper’s conclusions depend on it.
- Based: passes — The paper gives a reason why it holds.
It may state two separate claims as one.
A result the paper reports from its own data — it cites no other source for it, so there is none to check. The quote shows it is in the paper.
In the paper
“We related the degree of deviance to ADHD symptoms and showed that participants scoring highly for hyperactivity were either at the extreme of a normal spectrum of functioning or had reward-related brain responses that differed from the normal pattern.”
- Also stated in: § Discussion · plain
“We identified two distinct mechanisms through which participants have high hyperactivity: participants either fit the normative model well, suggesting they are at the extreme of a normal axis of variation, or showed patterns of abnormality that were highly individualized but still meaningfully related to symptoms.”
§ Understanding Heterogeneity in Clinical Cohorts Using Normative Models: Beyond Case-Control Studies > Discussion
plaincorrelational- Asserted: passes — The authors put it forward as true.
- Checkable: passes — It can be checked against evidence.
- Load-bearing: passes — The paper’s conclusions depend on it.
- Based: passes — The paper gives a reason why it holds.
It may state two separate claims as one.
- Rests on an assumption: The healthy cohort used to construct the normative model is representative of the normal population.
- Also stated in: § Discussion · plain
A result the paper reports from its own data — it cites no other source for it, so there is none to check. The quote shows it is in the paper.
In the paper
“First, most participants fit the normative model well, including many participants having high hyperactivity.”
§ Understanding Heterogeneity in Clinical Cohorts Using Normative Models: Beyond Case-Control Studies > Results > Clinical Correlates of Abnormality Index
plain- Asserted: passes — The authors put it forward as true.
- Checkable: passes — It can be checked against evidence.
- Load-bearing: passes — The paper’s conclusions depend on it.
- Based: passes — The paper gives a reason why it holds.
It may state two separate claims as one.
A result the paper reports from its own data — it cites no other source for it, so there is none to check. The quote shows it is in the paper.
In the paper
“In the latter case, the degree of deviation correlated with hyperactivity, but not inattention, well into the middle of the population distribution on the basis of idiosyncratic patterns of abnormality.”
- Also stated in: § Discussion · plain
“We also showed domain specificity because the degree of abnormality correlated with hyperactivity but not inattention.”
§ Understanding Heterogeneity in Clinical Cohorts Using Normative Models: Beyond Case-Control Studies > Discussion
plaincorrelational- Asserted: passes — The authors put it forward as true.
- Checkable: passes — It can be checked against evidence.
- Load-bearing: passes — The paper’s conclusions depend on it.
- Based: passes — The paper gives a reason why it holds.
It may state two separate claims as one.
- Rests on an assumption: The healthy cohort used to construct the normative model is representative of the normal population.
- Also stated in: § Discussion · plain
A result the paper reports from its own data — it cites no other source for it, so there is none to check. The quote shows it is in the paper.
In the paper
“The normative model provided a good fit for these participants because none showed brainordinates deviating from the norm (p < .05, false discovery rate corrected), and none would be considered an outlier under the extreme value distributions fit to the positive, negative, or absolute deviations (all p > .05).”
§ Understanding Heterogeneity in Clinical Cohorts Using Normative Models: Beyond Case-Control Studies > Results > Clinical Correlates of Abnormality Index
plain- Asserted: passes — The authors put it forward as true.
- Checkable: passes — It can be checked against evidence.
- Load-bearing: passes — The paper’s conclusions depend on it.
- Based: passes — The paper gives a reason why it holds.
It may state two separate claims as one.
A result the paper reports from its own data — it cites no other source for it, so there is none to check. The quote shows it is in the paper.
In the paper
“However, the cost for this data set was acceptable (a few seconds per brain location).”
§ Understanding Heterogeneity in Clinical Cohorts Using Normative Models: Beyond Case-Control Studies > Discussion
plain- Asserted: passes — The authors put it forward as true.
- Checkable: passes — It can be checked against evidence.
- Load-bearing: fails — The paper’s conclusions may not depend on it.
- Based: passes — The paper gives a reason why it holds.
Probably not a substantial claim. The paper’s conclusions may not depend on it.
In the paper
“For larger data sets, there are many solutions; in preliminary work, we found that an alternative approach [Bayesian polynomial regression (49)] scales well at a small cost to accuracy.”
§ Understanding Heterogeneity in Clinical Cohorts Using Normative Models: Beyond Case-Control Studies > Discussion
What the sources say
- Not checked yetcites [49] Bishop, 2006
plaincorrelational- Asserted: passes — The authors put it forward as true.
- Checkable: passes — It can be checked against evidence.
- Load-bearing: fails — The paper’s conclusions may not depend on it.
- Based: passes — The paper gives a reason why it holds.
Probably not a substantial claim. The paper’s conclusions may not depend on it.
A conclusion the paper draws from its own results — it cites no other source for it, so there is none to check. The quote shows it is in the paper.
In the paper
“4) diagnostic labels to be used as predictor variables, enabling inferences over the labels just as any other variable.”
§ Understanding Heterogeneity in Clinical Cohorts Using Normative Models: Beyond Case-Control Studies > Abstract > Conclusions
plaincorrelational- Asserted: passes — The authors put it forward as true.
- Checkable: passes — It can be checked against evidence.
- Load-bearing: passes — The paper’s conclusions depend on it.
- Based: unclear — It is unclear why the paper says it holds.
It may state two separate claims as one.
- The authors state this as an assumption: Determining where each subject lies within the population range is required because variation associated with most disorders overlaps with normal variation.
The paper states this without a source or data behind it here, so there is nothing to check it against. The quote shows it is in the paper.
In the paper
“5) finally, it is unclear whether healthy participants should be clustered separately or in combination with patients.”
§ Understanding Heterogeneity in Clinical Cohorts Using Normative Models: Beyond Case-Control Studies > Abstract > Conclusions
plain- Asserted: passes — The authors put it forward as true.
- Checkable: passes — It can be checked against evidence.
- Load-bearing: passes — The paper’s conclusions depend on it.
- Based: fails — The paper may give no reason why it holds.
Probably not a substantial claim. The paper may give no reason why it holds.
In the paper
“In response to this problem, the National Institute of Mental Health launched the Research Domain Criteria (RDoC) initiative (2), which encourages researchers to link symptom dimensions with biological systems, cutting across diagnostic classifications.”
§ Understanding Heterogeneity in Clinical Cohorts Using Normative Models: Beyond Case-Control Studies > Abstract > Conclusions
What the sources say
- Not checked yetcites [2] Insel, 2010, Research Domain Criteria (RDoC): Toward a new classification framework for research on mental disorders, Am J Psychiatry source
plaincorrelational- Asserted: passes — The authors put it forward as true.
- Checkable: passes — It can be checked against evidence.
- Load-bearing: passes — The paper’s conclusions depend on it.
- Based: passes — The paper gives a reason why it holds.
Probably not a substantial claim.
In the paper
“Some reports have suggested that disease variation may be nested within normal variation (7).”
§ Understanding Heterogeneity in Clinical Cohorts Using Normative Models: Beyond Case-Control Studies > Abstract > Conclusions
What the sources say
- Not checked yetcites [7] Fair, 2012, Distinct neuropsychological subgroups in typically developing youth inform heterogeneity in children with ADHD, Proc Natl Acad Sci U S A source
hedgedcorrelational- Asserted: fails — The authors may not put it forward as true.
- Checkable: passes — It can be checked against evidence.
- Load-bearing: fails — The paper’s conclusions may not depend on it.
- Based: passes — The paper gives a reason why it holds.
Probably not a substantial claim. The authors may not put it forward as true. The paper’s conclusions may not depend on it.
In the paper
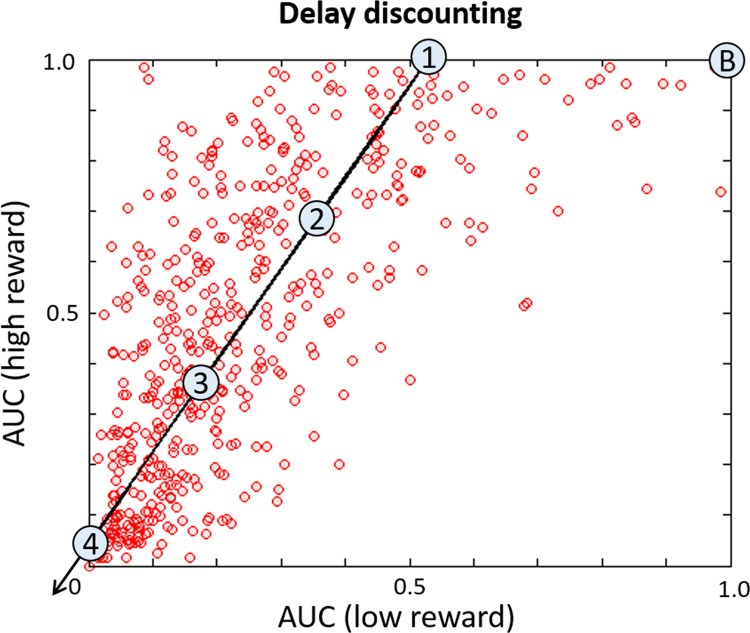
“We use delay discounting to quantify impulsivity, which measures the degree to which individuals devalue future rewards relative to immediate rewards (22)”
§ Understanding Heterogeneity in Clinical Cohorts Using Normative Models: Beyond Case-Control Studies > Abstract > Conclusions
What the sources say
- Not checked yetcites [22] Ainslie, 1975, Specious reward—behavioral theory of impulsiveness and impulse control, Psychol Bull source
plain- Asserted: passes — The authors put it forward as true.
- Checkable: passes — It can be checked against evidence.
- Load-bearing: passes — The paper’s conclusions depend on it.
- Based: passes — The paper gives a reason why it holds.
Probably not a substantial claim.
A conclusion the paper draws from its own results — it cites no other source for it, so there is none to check. The quote shows it is in the paper.
In the paper
“In contrast to clustering approaches, we propose a normative modeling approach that models biological variation across either 1) the entire study population (including all clinical groups) or 2) a large healthy sample.”
§ Understanding Heterogeneity in Clinical Cohorts Using Normative Models: Beyond Case-Control Studies > Abstract > Conclusions
plain- Asserted: passes — The authors put it forward as true.
- Checkable: passes — It can be checked against evidence.
- Load-bearing: passes — The paper’s conclusions depend on it.
- Based: passes — The paper gives a reason why it holds.
Probably not a substantial claim. It may state two separate claims as one.
- The authors state this as an assumption: Understanding healthy variation is a prerequisite to understanding disease variation.
The paper states this without a source or data behind it here, so there is nothing to check it against. The quote shows it is in the paper.
In the paper
“4) it may be difficult to choose a unique optimal number of clusters (e.g., different metrics may yield different optimal numbers of clusters or may not identify a unique maximum)”
§ Understanding Heterogeneity in Clinical Cohorts Using Normative Models: Beyond Case-Control Studies > Abstract > Conclusions
hedged- Asserted: passes — The authors put it forward as true.
- Checkable: passes — It can be checked against evidence.
- Load-bearing: passes — The paper’s conclusions depend on it.
- Based: passes — The paper gives a reason why it holds.
Probably not a substantial claim.
The paper states this without a source or data behind it here, so there is nothing to check it against. The quote shows it is in the paper.
In the paper
“This does not match the clinical view of disease, where disorders in individual patients manifest as deviations from a normal pattern of functioning.”
§ Understanding Heterogeneity in Clinical Cohorts Using Normative Models: Beyond Case-Control Studies > Abstract > Conclusions
plain- Asserted: passes — The authors put it forward as true.
- Checkable: fails — It may be too vague to check against evidence.
- Load-bearing: passes — The paper’s conclusions depend on it.
- Based: fails — The paper may give no reason why it holds.
Probably not a substantial claim. It may be too vague to check against evidence. The paper may give no reason why it holds.
In the paper
“2) some participants may not clearly belong to any class, or some classes may become unmanageably small (8)”
§ Understanding Heterogeneity in Clinical Cohorts Using Normative Models: Beyond Case-Control Studies > Abstract > Conclusions
What the sources say
- Not checked yetcites [8] van Hulst, 2015, Distinct neuropsychological profiles within ADHD: A latent class analysis of cognitive control, reward sensitivity and timing, Psychol Med source
hedged- Asserted: passes — The authors put it forward as true.
- Checkable: passes — It can be checked against evidence.
- Load-bearing: passes — The paper’s conclusions depend on it.
- Based: passes — The paper gives a reason why it holds.
It may state two separate claims as one.
A conclusion the paper draws from its own results — it cites no other source for it, so there is none to check. The quote shows it is in the paper.
In the paper
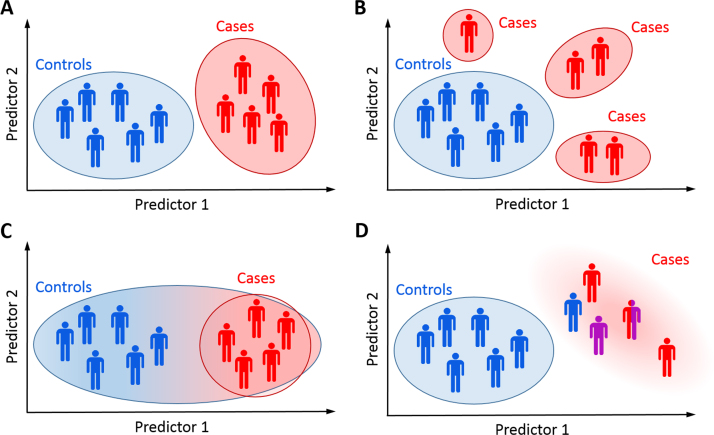
“This approach is fundamentally different from, and complementary to, clustering (Figure 1).”
§ Understanding Heterogeneity in Clinical Cohorts Using Normative Models: Beyond Case-Control Studies > Abstract > Conclusions
plain- Asserted: passes — The authors put it forward as true.
- Checkable: passes — It can be checked against evidence.
- Load-bearing: passes — The paper’s conclusions depend on it.
- Based: passes — The paper gives a reason why it holds.
It may state two separate claims as one.
In the paper
“The ultimate aim of RDoC is to find “new ways of classifying psychiatric diseases based on multiple dimensions of biology and behavior” (http://www.nimh.nih.gov/research-priorities/rdoc/index.shtml)—reducing heterogeneity in clinical cohorts; improving the neurobiological validity of disease classifications; and enabling more effective, personalized treatments.”
§ Understanding Heterogeneity in Clinical Cohorts Using Normative Models: Beyond Case-Control Studies > Abstract > Conclusions
What the sources say
- Not checked yetcites [2] Insel, 2010, Research Domain Criteria (RDoC): Toward a new classification framework for research on mental disorders, Am J Psychiatry source
plaindirect- Asserted: passes — The authors put it forward as true.
- Checkable: passes — It can be checked against evidence.
- Load-bearing: passes — The paper’s conclusions depend on it.
- Based: passes — The paper gives a reason why it holds.
Probably not a substantial claim. It may state two separate claims as one.
In the paper
“These objectives are also consistent with the European roadmap for mental health research (3).”
§ Understanding Heterogeneity in Clinical Cohorts Using Normative Models: Beyond Case-Control Studies > Abstract > Conclusions
What the sources say
- Not checked yetcites [3] Schumann, 2014, Stratified medicine for mental disorders, Eur Neuropsychopharmacol source
plaincorrelational- Asserted: passes — The authors put it forward as true.
- Checkable: passes — It can be checked against evidence.
- Load-bearing: fails — The paper’s conclusions may not depend on it.
- Based: passes — The paper gives a reason why it holds.
Probably not a substantial claim. The paper’s conclusions may not depend on it.
A conclusion the paper draws from its own results — it cites no other source for it, so there is none to check. The quote shows it is in the paper.
In the paper
“The abnormality indices we propose provide a way to assess this information quantitatively in relation to biology.”
§ Understanding Heterogeneity in Clinical Cohorts Using Normative Models: Beyond Case-Control Studies > Discussion
plaincorrelational- Asserted: passes — The authors put it forward as true.
- Checkable: passes — It can be checked against evidence.
- Load-bearing: passes — The paper’s conclusions depend on it.
- Based: passes — The paper gives a reason why it holds.
Probably not a substantial claim.
The paper states this without a source or data behind it here, so there is nothing to check it against. The quote shows it is in the paper.
In the paper
“The case-control approach to studying brain disorders has been successful for detecting group effects, for example, between patients and control subjects.”
§ Understanding Heterogeneity in Clinical Cohorts Using Normative Models: Beyond Case-Control Studies > Abstract > Conclusions
plaincorrelational- Asserted: passes — The authors put it forward as true.
- Checkable: passes — It can be checked against evidence.
- Load-bearing: passes — The paper’s conclusions depend on it.
- Based: fails — The paper may give no reason why it holds.
Probably not a substantial claim. The paper may give no reason why it holds.
A conclusion the paper draws from its own results — it cites no other source for it, so there is none to check. The quote shows it is in the paper.
In the paper
“Alternatively, normative modeling might indicate that disease is nested within the healthy range (Figure 1C).”
§ Understanding Heterogeneity in Clinical Cohorts Using Normative Models: Beyond Case-Control Studies > Discussion
hedgedcorrelational- Asserted: passes — The authors put it forward as true.
- Checkable: passes — It can be checked against evidence.
- Load-bearing: fails — The paper’s conclusions may not depend on it.
- Based: passes — The paper gives a reason why it holds.
Probably not a substantial claim. The paper’s conclusions may not depend on it.
None of the sources cited for this claim have been checked yet.
In the paper
“Alternatively, Gaussian process regression can be extended to directly predict multivariate phenotypes, as we demonstrated previously (43, 44).”
§ Understanding Heterogeneity in Clinical Cohorts Using Normative Models: Beyond Case-Control Studies > Discussion
What the sources say
- Not checked yetcites [43] Marquand, 2014, Bayesian multi-task learning for decoding multi-subject neuroimaging data, Neuroimage source
- Not checked yetcites [44] Marquand AF, Williams SCR, Doyle OM, Rosa MJ (2014). Full Bayesian multi‐task learning for multi‐output brain decoding and accommodating missing data. In: Proceedings of the 2014 International Workshop on Pattern Recognition in Neuroimaging, Tübingen, Germany. New York: IEEE Press, 1–4. source
boosteddirect- Asserted: passes — The authors put it forward as true.
- Checkable: passes — It can be checked against evidence.
- Load-bearing: fails — The paper’s conclusions may not depend on it.
- Based: passes — The paper gives a reason why it holds.
Probably not a substantial claim. The paper’s conclusions may not depend on it.
A conclusion the paper draws from its own results — it cites no other source for it, so there is none to check. The quote shows it is in the paper.
In the paper
“Second, we can begin to make statements about the quality of different measures, which can be compared in terms of predictive power.”
§ Understanding Heterogeneity in Clinical Cohorts Using Normative Models: Beyond Case-Control Studies > Discussion
plaincorrelational- Asserted: passes — The authors put it forward as true.
- Checkable: fails — It may be too vague to check against evidence.
- Load-bearing: passes — The paper’s conclusions depend on it.
- Based: fails — The paper may give no reason why it holds.
Probably not a substantial claim. It may be too vague to check against evidence. The paper may give no reason why it holds. It may state two separate claims as one.
In the paper
“One important source of artifactual variation in functional MRI is head motion (47).”
§ Understanding Heterogeneity in Clinical Cohorts Using Normative Models: Beyond Case-Control Studies > Discussion
What the sources say
- Not checked yetcites [47] Van Dijk, 2012, The influence of head motion on intrinsic functional connectivity MRI, Neuroimage source
plaindirect- Asserted: passes — The authors put it forward as true.
- Checkable: passes — It can be checked against evidence.
- Load-bearing: passes — The paper’s conclusions depend on it.
- Based: passes — The paper gives a reason why it holds.
Probably not a substantial claim.
A conclusion the paper draws from its own results — it cites no other source for it, so there is none to check. The quote shows it is in the paper.
In the paper
“Third, existing diagnostic labels can be included as covariates just as any other variable.”
§ Understanding Heterogeneity in Clinical Cohorts Using Normative Models: Beyond Case-Control Studies > Discussion
plain- Asserted: passes — The authors put it forward as true.
- Checkable: passes — It can be checked against evidence.
- Load-bearing: passes — The paper’s conclusions depend on it.
- Based: passes — The paper gives a reason why it holds.
Probably not a substantial claim.
A conclusion the paper draws from its own results — it cites no other source for it, so there is none to check. The quote shows it is in the paper.
In the paper
“Instead, disease can be considered as an extreme of the normal range or as—possibly idiosyncratic—deviation from normal functioning.”
§ Understanding Heterogeneity in Clinical Cohorts Using Normative Models: Beyond Case-Control Studies > Abstract > Conclusions
hedged- Asserted: passes — The authors put it forward as true.
- Checkable: fails — It may be too vague to check against evidence.
- Load-bearing: passes — The paper’s conclusions depend on it.
- Based: passes — The paper gives a reason why it holds.
Probably not a substantial claim. It may be too vague to check against evidence. It may state two separate claims as one.
- The authors state this as an assumption: Disease may, but may not necessarily, occur as an extreme deviation from a normal pattern.
A conclusion the paper draws from its own results — it cites no other source for it, so there is none to check. The quote shows it is in the paper.
In the paper
“This inclusion permits inference over the proportion of biological variance the labels explain and therefore how appropriate a case-control analysis is for the chosen measures.”
§ Understanding Heterogeneity in Clinical Cohorts Using Normative Models: Beyond Case-Control Studies > Discussion
plaincorrelational- Asserted: passes — The authors put it forward as true.
- Checkable: passes — It can be checked against evidence.
- Load-bearing: passes — The paper’s conclusions depend on it.
- Based: passes — The paper gives a reason why it holds.
It may state two separate claims as one.
A conclusion the paper draws from its own results — it cites no other source for it, so there is none to check. The quote shows it is in the paper.
In the paper
“This mapping breaks the symmetry inherent in the case-control approach in that the primary interest is in how each individual differs from the population.”
§ Understanding Heterogeneity in Clinical Cohorts Using Normative Models: Beyond Case-Control Studies > Discussion
plaindirect- Asserted: passes — The authors put it forward as true.
- Checkable: passes — It can be checked against evidence.
- Load-bearing: passes — The paper’s conclusions depend on it.
- Based: passes — The paper gives a reason why it holds.
Probably not a substantial claim.
A conclusion the paper draws from its own results — it cites no other source for it, so there is none to check. The quote shows it is in the paper.
In the paper
“A particular strength is its flexibility; it can integrate multiple measures characterizing different cognitive domains, quantifying the relationship between each domain with biology and symptoms.”
§ Understanding Heterogeneity in Clinical Cohorts Using Normative Models: Beyond Case-Control Studies > Discussion
plaincorrelational- Asserted: passes — The authors put it forward as true.
- Checkable: passes — It can be checked against evidence.
- Load-bearing: passes — The paper’s conclusions depend on it.
- Based: passes — The paper gives a reason why it holds.
It may state two separate claims as one.
What the paper did — it cites no source for this, so there is none to check. The quote shows it is in the paper.
In the paper
“To ensure unbiased estimates of generalizability, model estimation was performed under 10-fold cross-validation, where data were repeatedly partitioned into training and test sets across subjects, in a way that accommodated the family structure of the data (Supplement).”
§ Understanding Heterogeneity in Clinical Cohorts Using Normative Models: Beyond Case-Control Studies > Methods and Materials > Data Sample
plain- Asserted: passes — The authors put it forward as true.
- Checkable: passes — It can be checked against evidence.
- Load-bearing: passes — The paper’s conclusions depend on it.
- Based: passes — The paper gives a reason why it holds.
Probably not a substantial claim. It may state two separate claims as one.
A conclusion the paper draws from its own results — it cites no other source for it, so there is none to check. The quote shows it is in the paper.
In the paper
“The extreme value distribution provides a mechanism to understand how these deviations relate to clinical symptoms.”
§ Understanding Heterogeneity in Clinical Cohorts Using Normative Models: Beyond Case-Control Studies > Results > Deviating Subjects
plaincorrelational- Asserted: passes — The authors put it forward as true.
- Checkable: passes — It can be checked against evidence.
- Load-bearing: passes — The paper’s conclusions depend on it.
- Based: fails — The paper may give no reason why it holds.
Probably not a substantial claim. The paper may give no reason why it holds.
In the paper
“Head motion is unlikely to underlie the effects we report because we excluded subjects having a high degree of head motion and repeated the analysis after regressing out motion-related components using a similar approach to Pruim et al. (48).”
§ Understanding Heterogeneity in Clinical Cohorts Using Normative Models: Beyond Case-Control Studies > Discussion
What the sources say
- Not checked yetcites [48] Pruim, 2015, ICA-AROMA: A robust ICA-based strategy for removing motion artifacts from fMRI data, Neuroimage source
hedged- Asserted: passes — The authors put it forward as true.
- Checkable: passes — It can be checked against evidence.
- Load-bearing: passes — The paper’s conclusions depend on it.
- Based: passes — The paper gives a reason why it holds.
It may state two separate claims as one.
The paper states this without a source or data behind it here, so there is nothing to check it against. The quote shows it is in the paper.
In the paper
“By definition, it also precludes inference over the validity of the diagnostic labels.”
§ Understanding Heterogeneity in Clinical Cohorts Using Normative Models: Beyond Case-Control Studies > Abstract > Background
plaindirect- Asserted: passes — The authors put it forward as true.
- Checkable: passes — It can be checked against evidence.
- Load-bearing: passes — The paper’s conclusions depend on it.
- Based: passes — The paper gives a reason why it holds.
Probably not a substantial claim.
A conclusion the paper draws from its own results — it cites no other source for it, so there is none to check. The quote shows it is in the paper.
In the paper
“Normative modeling is compatible with the objectives of RDoC because it allows different axes of variation to be studied independently of the diagnostic labels.”
§ Understanding Heterogeneity in Clinical Cohorts Using Normative Models: Beyond Case-Control Studies > Discussion
plaindirect- Asserted: passes — The authors put it forward as true.
- Checkable: passes — It can be checked against evidence.
- Load-bearing: passes — The paper’s conclusions depend on it.
- Based: passes — The paper gives a reason why it holds.
Probably not a substantial claim.
A conclusion the paper draws from its own results — it cites no other source for it, so there is none to check. The quote shows it is in the paper.
In the paper
“Alternatively, the normative model can be fit directly to the heterogeneous cohort to find outliers within the cohort.”
§ Understanding Heterogeneity in Clinical Cohorts Using Normative Models: Beyond Case-Control Studies > Discussion
plain- Asserted: passes — The authors put it forward as true.
- Checkable: passes — It can be checked against evidence.
- Load-bearing: fails — The paper’s conclusions may not depend on it.
- Based: passes — The paper gives a reason why it holds.
Probably not a substantial claim. The paper’s conclusions may not depend on it.
A conclusion the paper draws from its own results — it cites no other source for it, so there is none to check. The quote shows it is in the paper.
In the paper
“A limitation for Gaussian process models is a poor computational scaling to large numbers of data points.”
§ Understanding Heterogeneity in Clinical Cohorts Using Normative Models: Beyond Case-Control Studies > Discussion
plaindirect- Asserted: passes — The authors put it forward as true.
- Checkable: passes — It can be checked against evidence.
- Load-bearing: fails — The paper’s conclusions may not depend on it.
- Based: passes — The paper gives a reason why it holds.
Probably not a substantial claim. The paper’s conclusions may not depend on it.
A conclusion the paper draws from its own results — it cites no other source for it, so there is none to check. The quote shows it is in the paper.
In the paper
“In conclusion, we demonstrated a normative modeling approach for mapping 1) associations between brain function and behavior and 2) the overall deviation of each subject from the normative model.”
§ Understanding Heterogeneity in Clinical Cohorts Using Normative Models: Beyond Case-Control Studies > Discussion
boostedcorrelational- Asserted: passes — The authors put it forward as true.
- Checkable: passes — It can be checked against evidence.
- Load-bearing: passes — The paper’s conclusions depend on it.
- Based: passes — The paper gives a reason why it holds.
It may state two separate claims as one.
- Rests on an assumption: The healthy cohort used to construct the normative model is representative of the normal population.
A conclusion the paper draws from its own results — it cites no other source for it, so there is none to check. The quote shows it is in the paper.
In the paper
“Instead, disease can be considered as an extremum of the normal range or as—possibly idiosyncratic—deviation from normal functioning.”
§ Understanding Heterogeneity in Clinical Cohorts Using Normative Models: Beyond Case-Control Studies > Discussion
plain- Asserted: passes — The authors put it forward as true.
- Checkable: fails — It may be too vague to check against evidence.
- Load-bearing: passes — The paper’s conclusions depend on it.
- Based: passes — The paper gives a reason why it holds.
Probably not a substantial claim. It may be too vague to check against evidence. It may state two separate claims as one.
None of the sources cited for this claim have been checked yet.
In the paper
“There are also many more recent innovations in machine learning for scaling Gaussian process regression to very large data sets (50, 51, 52).”
§ Understanding Heterogeneity in Clinical Cohorts Using Normative Models: Beyond Case-Control Studies > Discussion
What the sources say
- Not checked yetcites [50] Snelson E, Ghahramani Z (2006): Sparse Gaussian Processes using Pseudo-inputs. Proceedings of the 2005 Conference. In: Weiss Y, Scholkopf B, Platt J, editors. Advances in Neural Information Processing Systems 18. Cambridge, MA: The MIT Press.
- Not checked yetcites [51] Filippone M, Engler R (2015): Enabling scalable stochastic gradient-based inference for Gaussian processes by employing the Unbiased LInear System SolvEr (ULISSE). ArXiv:1501.05427v3 [stat.ME].
- Not checked yetcites [52] Saatci, 2011
plain- Asserted: passes — The authors put it forward as true.
- Checkable: passes — It can be checked against evidence.
- Load-bearing: fails — The paper’s conclusions may not depend on it.
- Based: passes — The paper gives a reason why it holds.
Probably not a substantial claim. The paper’s conclusions may not depend on it.
What the paper did — it cites no source for this, so there is none to check. The quote shows it is in the paper.
In the paper
“All conclusions remained valid, and our subjects that were outliers remained outliers.”
§ Understanding Heterogeneity in Clinical Cohorts Using Normative Models: Beyond Case-Control Studies > Discussion
plain- Asserted: passes — The authors put it forward as true.
- Checkable: passes — It can be checked against evidence.
- Load-bearing: passes — The paper’s conclusions depend on it.
- Based: passes — The paper gives a reason why it holds.
It may state two separate claims as one.
The authors state this as an assumption.
Understanding healthy variation is a prerequisite to understanding disease variation.
“Our approach is predicated on the assertions that 1) understanding healthy variation is a prerequisite to understanding disease variation”
The authors state this as an assumption.
Determining where each subject lies within the population range is required because variation associated with most disorders overlaps with normal variation.
“that this requires 2) the ability to determine where each subject lies within the population range because variation associated with most disorders overlaps with normal variation.”
The authors state this as an assumption.
Disease may, but may not necessarily, occur as an extreme deviation from a normal pattern.
“In this study, we consider that disease may—but may not necessarily—occur as an extreme deviation from a normal pattern.”
The paper relies on this without support.
The healthy cohort used to construct the normative model is representative of the normal population.
“We used normative models constructed from spectra of clinically relevant variables (delay discounting) to predict reward-related brain activity in a large, healthy cohort.”
Claims other papers make about this one
Each is checked against this paper’s own text: does it say what the citing paper says it does?
The cited source says what the claim attributes to it.
In the citing paper
“Newer hybrid models, such as normative modeling (19,59–61) or the functional random forest (FRF) (18,62), may overcome these limitations and enable new inferences from psychopathology studies.”
From Methods and challenges for assessing heterogeneity (2020) · cites this paper as [19]
In the citing paper
“From the homo- geneity assumption, the comorbidity (17) and heterogeneity (18,19) problems emerge and limit psychiatric research (20–26).”
From Methods and challenges for assessing heterogeneity (2020) · cites this paper as [19]
In the citing paper
“The investigators found one sub- type, where dorsolateral prefrontal activity predicted high hy- peractive symptoms and another subtype unrelated to such activity.”
From Methods and challenges for assessing heterogeneity (2020) · cites this paper as [19]
In the citing paper
“Several studies incorporated normative models to address comorbidity and heterogeneity in clinical and nonclinical co- horts (19,60,61).”
From Methods and challenges for assessing heterogeneity (2020) · cites this paper as [19]
In the citing paper
“Using data from 491 subjects within the Hu- man Connectome Project, investigators constructed normative models to identify impulsivity subtypes tied to self-reported hyperactive symptoms (19).”
From Methods and challenges for assessing heterogeneity (2020) · cites this paper as [19]
Citations
Cites
1 retracted
Karalunas, S. L., Fair, D., Musser, E. D., Aykes, K., Iyer, S. P., & Nigg, J. T. (2014) · JAMA Psychiatry · doi:10.1001/jamapsychiatry.2014.763 · Cited by 340
RetractedBook Review: Pattern Recognition and Machine Learning
Nasrabadi, N. M. (2007) · Journal of Electronic Imaging · doi:10.1117/1.2819119 · Cited by 22,066
Gaussian Processes for Machine Learning
Rasmussen, C. E., & Williams, C. K. I. (2005) · doi:10.7551/mitpress/3206.001.0001 · Cited by 11,705
Pattern Recognition and Machine Learning
(2006) · doi:10.1007/978-0-387-45528-0 · Cited by 9,824
An Introduction to Statistical Modeling of Extreme Values
Coles, S. (2001) · Springer Series in Statistics · doi:10.1007/978-1-4471-3675-0 · Cited by 7,352
Insel, T., Cuthbert, B., Garvey, M., Heinssen, R., Pine, D. S., Quinn, K., Sanislow, C., & Wang, P. (2010) · American Journal of Psychiatry · doi:10.1176/appi.ajp.2010.09091379 · Cited by 7,067
The WU-Minn Human Connectome Project: An overview
Van Essen, D. C., Smith, S. M., Barch, D. M., Behrens, T. E. J., Yacoub, E., & Ugurbil, K. (2013) · NeuroImage · doi:10.1016/j.neuroimage.2013.05.041 · Cited by 5,651
The minimal preprocessing pipelines for the Human Connectome Project
Glasser, M. F., Sotiropoulos, S. N., Wilson, J. A., Coalson, T. S., Fischl, B., Andersson, J. L., Xu, J., Jbabdi, S., Webster, M., Polimeni, J. R., et al. (2013) · NeuroImage · doi:10.1016/j.neuroimage.2013.04.127 · Cited by 5,253
Probability theory the logic of science
Jaynes, E. T., & Bretthorst, G. L. (2003) · Cited by 4,600
Specious reward: A behavioral theory of impulsiveness and impulse control.
Ainslie, G. (1975) · Psychological Bulletin · doi:10.1037/h0076860 · Cited by 2,708
Cited by
Sorted by citations
Brain charts for the human lifespan
Bethlehem, R. A. I., Seidlitz, J., White, S. R., Vogel, J. W., Anderson, K. M., Adamson, C., Adler, S., Alexopoulos, G. S., Anagnostou, E., Areces-Gonzalez, A., et al. (2022) · Nature · doi:10.1038/s41586-022-04554-y · Cited by 1,794
Machine Learning Approaches for Clinical Psychology and Psychiatry
Dwyer, D. B., Falkai, P., & Koutsouleris, N. (2018) · Annual Review of Clinical Psychology · doi:10.1146/annurev-clinpsy-032816-045037 · Cited by 966
Clark, L. A., Cuthbert, B., Lewis-Fernández, R., Narrow, W. E., & Reed, G. M. (2017) · Psychological Science in the Public Interest · doi:10.1177/1529100617727266 · Cited by 688
Mapping the heterogeneous phenotype of schizophrenia and bipolar disorder using normative models
Wolfers, T., Doan, N. T., Kaufmann, T., Alnæs, D., Moberget, T., Agartz, I., Buitelaar, J. K., Ueland, T., Melle, I., Franke, B., et al. (2018) · JAMA Psychiatry · doi:10.1001/jamapsychiatry.2018.2467 · Cited by 508
Self-citationThe Heterogeneity Problem: Approaches to Identify Psychiatric Subtypes
Feczko, E., Miranda-Dominguez, O., Marr, M., Graham, A. M., Nigg, J. T., & Fair, D. A. (2019) · Trends in Cognitive Sciences · doi:10.1016/j.tics.2019.03.009 · Cited by 443
Conceptualizing mental disorders as deviations from normative functioning
Marquand, A. F., Kia, S. M., Zabihi, M., Wolfers, T., Buitelaar, J. K., & Beckmann, C. F. (2019) · Molecular Psychiatry · doi:10.1038/s41380-019-0441-1 · Cited by 433
Self-citationCommon Dysfunction of Large-Scale Neurocognitive Networks Across Psychiatric Disorders
Sha, Z., Wager, T. D., Mechelli, A., & He, Y. (2019) · Biological Psychiatry · doi:10.1016/j.biopsych.2018.11.011 · Cited by 367
Loth, E., Charman, T., Mason, L., Tillmann, J., Jones, E. J. H., Wooldridge, C., Ahmad, J., Auyeung, B., Brogna, C., Ambrosino, S., et al. (2017) · Molecular Autism · doi:10.1186/s13229-017-0146-8 · Cited by 299
Self-citationSchulz, M.-A., Yeo, B. T. T., Vogelstein, J. T., Mourao-Miranada, J., Kather, J. N., Kording, K., Richards, B., & Bzdok, D. (2020) · Nature Communications · doi:10.1038/s41467-020-18037-z · Cited by 315
Regional, circuit and network heterogeneity of brain abnormalities in psychiatric disorders
Segal, A., Parkes, L., Aquino, K. M., Kia, S. M., Wolfers, T., Franke, B., Hoogman, M., Beckmann, C. F., Westlye, L. T., Andreassen, O. A., et al. (2023) · Nature Neuroscience · doi:10.1038/s41593-023-01404-6 · Cited by 279
Self-citationMarquand, A. F., Wolfers, T., Mennes, M., Buitelaar, J. K., & Beckmann, C. F. (2016) · Biological Psychiatry Cognitive Neuroscience and Neuroimaging · doi:10.1016/j.bpsc.2016.04.002 · Cited by 267
Self-citationCharting brain growth and aging at high spatial precision
Rutherford, S., Fraza, C., Dinga, R., Kia, S. M., Wolfers, T., Zabihi, M., Berthet, P., Worker, A., Verdi, S., Andrews, D., et al. (2022) · eLife · doi:10.7554/elife.72904 · Cited by 214
Self-citationModern views of machine learning for precision psychiatry
Chen, Z. S., Kulkarni, P., Galatzer‐Levy, I. R., Bigio, B., Nasca, C., & Zhang, Y. (2022) · Patterns · doi:10.1016/j.patter.2022.100602 · Cited by 247
Wolfers, T., Beckmann, C. F., Hoogman, M., Buitelaar, J. K., Franke, B., & Marquand, A. F. (2019) · Psychological Medicine · doi:10.1017/s0033291719000084 · Cited by 205
Self-citationDissecting the Heterogeneous Cortical Anatomy of Autism Spectrum Disorder Using Normative Models
Zabihi, M., Oldehinkel, M., Wolfers, T., Frouin, V., Goyard, D., Loth, E., Charman, T., Tillmann, J., Banaschewski, T., Dumas, G., et al. (2018) · Biological Psychiatry Cognitive Neuroscience and Neuroimaging · doi:10.1016/j.bpsc.2018.11.013 · Cited by 204
Self-citationResearch Domain Criteria (RDoC): Progress and Potential
Cuthbert, B. N. (2022) · Current Directions in Psychological Science · doi:10.1177/09637214211051363 · Cited by 208
Winter, N. R., Leenings, R., Ernsting, J., Sarink, K., Fisch, L., Emden, D., Blanke, J., Goltermann, J., Opel, N., Barkhau, C., et al. (2022) · JAMA Psychiatry · doi:10.1001/jamapsychiatry.2022.1780 · Cited by 185
Evidence for embracing normative modeling
Rutherford, S. E., Barkema, P., Tso, I. F., Sripada, C., Beckmann, C. F., Ruhé, H. G., & Marquand, A. F. (2023) · eLife · doi:10.7554/elife.85082 · Cited by 192
Self-citationToward Neurosubtypes in Autism
Hong, S., Vogelstein, J. T., Gozzi, A., Bernhardt, B. C., Yeo, B. T. T., Milham, M. P., & Martino, A. D. (2020) · Biological Psychiatry · doi:10.1016/j.biopsych.2020.03.022 · Cited by 175
Towards a brain‐based predictome of mental illness
Rashid, B., & Calhoun, V. D. (2020) · Human Brain Mapping · doi:10.1002/hbm.25013 · Cited by 166
Lv, J., Biase, M. A. D., Cash, R. F. H., Cocchi, L., Cropley, V., Klauser, P., Tian, Y., Bayer, J., Schmaal, L., Karayumak, S. C., et al. (2020) · Molecular Psychiatry · doi:10.1038/s41380-020-00882-5 · Cited by 157
How Local and Global Metacognition Shape Mental Health
Seow, T. X. F., Rouault, M., Gillan, C. M., & Fleming, S. M. (2021) · Biological Psychiatry · doi:10.1016/j.biopsych.2021.05.013 · Cited by 159
Oldehinkel, M., Mennes, M., Marquand, A. F., Charman, T., Tillmann, J., Ecker, C., Dell’Acqua, F., Brandeis, D., Banaschewski, T., Baumeister, S., et al. (2018) · Biological Psychiatry Cognitive Neuroscience and Neuroimaging · doi:10.1016/j.bpsc.2018.11.010 · Cited by 160
Self-citationLiu, Z., Palaniyappan, L. K., Wu, X., Zhang, K., Du, J., Zhao, Q., Xie, C., Tang, Y., Su, W., Wei, Y., et al. (2021) · Molecular Psychiatry · doi:10.1038/s41380-021-01229-4 · Cited by 146
Carcone, D., & Ruocco, A. C. (2017) · Frontiers in Cellular Neuroscience · doi:10.3389/fncel.2017.00046 · Cited by 159
Pinaya, W. H. L., Mechelli, A., & Sato, J. R. (2018) · Human Brain Mapping · doi:10.1002/hbm.24423 · Cited by 136
Warped Bayesian linear regression for normative modelling of big data
Fraza, C., Dinga, R., Beckmann, C. F., & Marquand, A. F. (2021) · NeuroImage · doi:10.1016/j.neuroimage.2021.118715 · Cited by 134
Self-citationSigcha, L., Costa, N., Pavón, I., Costa, S., Arezes, P., López, J. M., & De Arcas, G. (2020) · Sensors · doi:10.3390/s20071895 · Cited by 126
Wolfers, T., Floris, D. L., Dinga, R., van Rooij, D., Isakoglou, C., Kia, S. M., Zabihi, M., Llera, A., Chowdanayaka, R., Kumar, V., et al. (2019) · Neuroscience & Biobehavioral Reviews · doi:10.1016/j.neubiorev.2019.07.010 · Cited by 131
Self-citationSun, X., Sun, J., Lu, X., Dong, Q., Zhang, L., Wang, W., Liu, J., Ma, Q., Wang, X., Wei, D., et al. (2023) · Biological Psychiatry · doi:10.1016/j.biopsych.2023.05.021 · Cited by 129
Recommendations and future directions for supervised machine learning in psychiatry
Cearns, M., Hahn, T., & Baune, B. T. (2019) · Translational Psychiatry · doi:10.1038/s41398-019-0607-2 · Cited by 127
Covington, N. V., & Duff, M. C. (2021) · American Journal of Speech-Language Pathology · doi:10.1044/2020_ajslp-20-00081 · Cited by 141
Atypical Brain Asymmetry in Autism—A Candidate for Clinically Meaningful Stratification
Floris, D. L., Wolfers, T., Zabihi, M., Holz, N. E., Zwiers, M. P., Charman, T., Tillmann, J., Ecker, C., Dell’Acqua, F., Banaschewski, T., et al. (2020) · Biological Psychiatry Cognitive Neuroscience and Neuroimaging · doi:10.1016/j.bpsc.2020.08.008 · Cited by 123
Self-citationSystematic misestimation of machine learning performance in neuroimaging studies of depression
Flint, C., Cearns, M., Opel, N., Redlich, R., Mehler, D. M. A., Emden, D., Winter, N. R., Leenings, R., Eickhoff, S. B., Kircher, T., et al. (2021) · Neuropsychopharmacology · doi:10.1038/s41386-021-01020-7 · Cited by 120
Parkes, L., Satterthwaite, T. D., & Bassett, D. S. (2020) · Current Opinion in Neurobiology · doi:10.1016/j.conb.2020.10.016 · Cited by 116
Brain Subtyping Enhances The Neuroanatomical Discrimination of Schizophrenia
Dwyer, D., Cabral, C., Kambeitz‐Ilankovic, L., Sanfelici, R., Kambeitz, J. P., Calhoun, V. D., Falkai, P., Pantelis, C., Meisenzahl, E. M., & Koutsouleris, N. (2018) · Schizophrenia Bulletin · doi:10.1093/schbul/sby008 · Cited by 118
Xia, M., Si, T., Sun, X., Ma, Q., Liu, B., Wang, L., Meng, J., Chang, M., Huang, X., Chen, Z., et al. (2019) · NeuroImage · doi:10.1016/j.neuroimage.2019.01.074 · Cited by 113
Functional connectomics in depression: insights into therapies
Chai, Y., Sheline, Y. I., Oathes, D. J., Balderston, N. L., Rao, H., & Yu, M. (2023) · Trends in Cognitive Sciences · doi:10.1016/j.tics.2023.05.006 · Cited by 112
Beyond the average patient: how neuroimaging models can address heterogeneity in dementia
Verdi, S., Marquand, A. F., Schott, J. M., & Cole, J. H. (2021) · Brain · doi:10.1093/brain/awab165 · Cited by 106
Self-citationPitfalls in brain age analyses
Butler, E. R., Chen, A. A., Ramadan, R., Le, T. T., Ruparel, K., Moore, T. M., Satterthwaite, T. D., Zhang, F., Shou, H., Gur, R. C., et al. (2021) · Human Brain Mapping · doi:10.1002/hbm.25533 · Cited by 119
Mapping human brain charts cross-sectionally and longitudinally
Biase, M. A. D., Tian, Y., Bethlehem, R. A. I., Seidlitz, J., Alexander‐Bloch, A. F., Yeo, B. T. T., & Zalesky, A. (2023) · Proceedings of the National Academy of Sciences · doi:10.1073/pnas.2216798120 · Cited by 107
Bethlehem, R. A. I., Seidlitz, J., Romero-García, R., Trakoshis, S., Dumas, G., & Lombardo, M. V. (2020) · Communications Biology · doi:10.1038/s42003-020-01212-9 · Cited by 109
Parkes, L., Moore, T. M., Calkins, M. E., Cook, P. A., Cieslak, M., Roalf, D. R., Wolf, D. H., Gur, R. C., Gur, R. E., Satterthwaite, T. D., et al. (2021) · Translational Psychiatry · doi:10.1038/s41398-021-01342-6 · Cited by 104
Shan, X., Uddin, L. Q., Xiao, J., He, C., Ling, Z., Li, L., Huang, X., Chen, H., & Duan, X. (2022) · Biological Psychiatry · doi:10.1016/j.biopsych.2022.01.011 · Cited by 100
Methods and challenges for assessing heterogeneity
Feczko, E., & Fair, D. A. (2020) · Biological Psychiatry · doi:10.1016/j.biopsych.2020.02.015 · Cited by 96
Individualized Prediction of Reading Comprehension Ability Using Gray Matter Volume
Cui, Z., Su, M., Li, L., Shu, H., & Gong, G. (2017) · Cerebral Cortex · doi:10.1093/cercor/bhx061 · Cited by 96
Vieira, S., Gong, Q., Pinaya, W. H. L., Scarpazza, C., Tognin, S., Crespo‐Facorro, B., Tordesillas‐Gutiérrez, D., de la Foz, V. O., Setién‐Suero, E., Scheepers, F. E., et al. (2018) · Schizophrenia Bulletin · doi:10.1093/schbul/sby189 · Cited by 108
Fractionating autism based on neuroanatomical normative modeling
Zabihi, M., Floris, D. L., Kia, S. M., Wolfers, T., Tillmann, J., Llera, A., Moessnang, C., Banaschewski, T., Holt, R., Baron‐Cohen, S., et al. (2020) · Translational Psychiatry · doi:10.1038/s41398-020-01057-0 · Cited by 104
Self-citationRichard, G., Kolskår, K. K., Sanders, A., Kaufmann, T., Petersen, A., Doan, N. T., Sánchez, J. M., Alnæs, D., Ulrichsen, K. M., Dørum, E. S., et al. (2018) · PeerJ · doi:10.7717/peerj.5908 · Cited by 106
Evaluation of Brain-Body Health in Individuals With Common Neuropsychiatric Disorders
Tian, Y., Biase, M. A. D., Mosley, P. E., Lupton, M. K., Xia, Y., Fripp, J., Breakspear, M. J., Cropley, V., & Zalesky, A. (2023) · JAMA Psychiatry · doi:10.1001/jamapsychiatry.2023.0791 · Cited by 96
Toward personalized medicine in connectomic deep brain stimulation
Hollunder, B., Rajamani, N., Siddiqi, S., Finke, C., Kühn, A. A., Mayberg, H. S., Fox, M., Neudorfer, C., & Horn, A. (2021) · Progress in Neurobiology · doi:10.1016/j.pneurobio.2021.102211 · Cited by 89
Rommelse, N., Buitelaar, J. K., & Hartman, C. A. (2017) · Journal of Neural Transmission · doi:10.1007/s00702-016-1651-1 · Cited by 85
Self-citationDhamala, E., Yeo, B. T. T., & Holmes, A. J. (2023) · Biological Psychiatry · doi:10.1016/j.biopsych.2022.09.024 · Cited by 91
Parola, A., Lin, J. M., Simonsen, A., Bliksted, V., Zhou, Y., Wang, H., Inoue, L., Koelkebeck, K., & Fusaroli, R. (2022) · Schizophrenia Research · doi:10.1016/j.schres.2022.07.002 · Cited by 87
Defining Precision Medicine Approaches to Autism Spectrum Disorders: Concepts and Challenges
Loth, E., Murphy, D., & Spooren, W. P. J. M. (2016) · Frontiers in Psychiatry · doi:10.3389/fpsyt.2016.00188 · Cited by 94
Dimitrova, R., Pietsch, M., Ciarrusta, J., Fitzgibbon, S. P., Williams, L. Z. J., Christiaens, D., Cordero‐Grande, L., Batallé, D., Makropoulos, A., Schuh, A., et al. (2021) · NeuroImage · doi:10.1016/j.neuroimage.2021.118488 · Cited by 97
Wolfers, T., Rokicki, J., Alnæs, D., Berthet, P., Agartz, I., Kia, S. M., Kaufmann, T., Zabihi, M., Moberget, T., Melle, I. S., et al. (2021) · Human Brain Mapping · doi:10.1002/hbm.25386 · Cited by 84
Self-citationPinaya, W. H. L., Scarpazza, C., Garcia‐Dias, R., Vieira, S., Baecker, L., da Costa, P. F., Redolfi, A., Frisoni, G. B., Pievani, M., Calhoun, V. D., et al. (2021) · Scientific Reports · doi:10.1038/s41598-021-95098-0 · Cited by 97
Verdi, S., Kia, S. M., Yong, K. X. X., Tosun, D., Schott, J. M., Marquand, A. F., Cole, J. H., & Initiative, T. A. D. N. (2023) · Neurology · doi:10.1212/wnl.0000000000207298 · Cited by 84
Self-citationTranslational machine learning for psychiatric neuroimaging
Walter, M., Alizadeh, S., Jamalabadi, H., Lueken, U., Dannlowski, U., Walter, H., Olbrich, S., Čolić, L., Kambeitz, J. P., Koutsouleris, N., et al. (2018) · Progress in Neuro-Psychopharmacology and Biological Psychiatry · doi:10.1016/j.pnpbp.2018.09.014 · Cited by 84
Mohammadian Rad, N., Van Laarhoven, T., Furlanello, C., & Marchiori, E. (2018) · Sensors · doi:10.3390/s18103533 · Cited by 76
The definition and measurement of heterogeneity
Nunes, A., Trappenberg, T. P., & Alda, M. (2020) · Translational Psychiatry · doi:10.1038/s41398-020-00986-0 · Cited by 81
Towards robust and replicable sex differences in the intrinsic brain function of autism
Floris, D. L., Filho, J. O. A., Lai, M., Giavasis, S., Oldehinkel, M., Mennes, M., Charman, T., Tillmann, J., Dumas, G., Ecker, C., et al. (2021) · Molecular Autism · doi:10.1186/s13229-021-00415-z · Cited by 78
Self-citationVieira, S., Liang, X., Guiomar, R. N. R. M., & Mechelli, A. (2022) · Clinical Psychology Review · doi:10.1016/j.cpr.2022.102193 · Cited by 84
Closing the life-cycle of normative modeling using federated hierarchical Bayesian regression
Kia, S. M., Huijsdens, H., Rutherford, S. E., de Boer, A. A. A., Dinga, R., Wolfers, T., Berthet, P., Mennes, M., Andreassen, O. A., Westlye, L. T., et al. (2022) · PLoS ONE · doi:10.1371/journal.pone.0278776 · Cited by 95
Self-citationSchnack, H. G. (2017) · Schizophrenia Research · doi:10.1016/j.schres.2017.10.023 · Cited by 73
Johnson, M. H., Charman, T., Pickles, A. R., & Jones, E. J. H. (2021) · Journal of Child Psychology and Psychiatry · doi:10.1111/jcpp.13372 · Cited by 79
He, Y., Byrge, L. A., & Kennedy, D. P. (2020) · Human Brain Mapping · doi:10.1002/hbm.24879 · Cited by 66
Mental health in the UK Biobank: A roadmap to self‐report measures and neuroimaging correlates
Dutt, R., Hannon, K., Easley, T. O., Griffis, J. C., Zhang, W., & Bijsterbosch, J. D. (2021) · Human Brain Mapping · doi:10.1002/hbm.25690 · Cited by 71
Accommodating site variation in neuroimaging data using normative and hierarchical Bayesian models
Bayer, J., Dinga, R., Kia, S. M., Kottaram, A., Wolfers, T., Lv, J., Zalesky, A., Schmaal, L., & Marquand, A. F. (2022) · NeuroImage · doi:10.1016/j.neuroimage.2022.119699 · Cited by 76
Self-citationVoineskos, A. N., Hawco, C. S., Neufeld, N. H., Turner, J. A., Ameis, S. H., Anticevic, A., Buchanan, R. W., Cadenhead, K. S., Dazzan, P., Dickie, E. W., et al. (2024) · World Psychiatry · doi:10.1002/wps.21159 · Cited by 81
Koirala, S., Grimsrud, G. J., Mooney, M. A., Larsen, B., Feczko, E., Elison, J. T., Nelson, S. M., Nigg, J. T., Tervo‐Clemmens, B., & Fair, D. A. (2024) · Nature reviews. Neuroscience · doi:10.1038/s41583-024-00869-z · Cited by 78
Brain imaging-based machine learning in autism spectrum disorder: methods and applications
Xu, M., Calhoun, V. D., Jiang, R., Yan, W., & Jing Sui (Beijing Normal University), my correct affiliation is beijing normal university, N. Q. U. O. S. A. T. (2021) · Journal of Neuroscience Methods · doi:10.1016/j.jneumeth.2021.109271 · Cited by 77
Heterogeneity in Brain Microstructural Development Following Preterm Birth
Dimitrova, R., Pietsch, M., Christiaens, D., Ciarrusta, J., Wolfers, T., Batallé, D., Hughes, E., Hutter, J. M., Cordero‐Grande, L., Price, A. N., et al. (2020) · Cerebral Cortex · doi:10.1093/cercor/bhaa069 · Cited by 68
Self-citationSønderby, I. E., Ching, C. R. K., Thomopoulos, S. I., van der Meer, D., Sun, D., Villalon‐Reina, J. E., Agartz, I., Amunts, K., Arango, C., Armstrong, N. J., et al. (2022) · Human Brain Mapping · doi:10.1002/hbm.25354 · Cited by 67
Detecting microstructural deviations in individuals with deep diffusion MRI tractometry
Chamberland, M., Genc, S., Tax, C. M. W., Shastin, D., Koller, K., Raven, E. P., Cunningham, A. C., Doherty, J. L., van den Bree, M. B. M., Parker, G. D., et al. (2021) · Nature Computational Science · doi:10.1038/s43588-021-00126-8 · Cited by 67
Hierarchical Bayesian Regression for Multi-site Normative Modeling of Neuroimaging Data
Kia, S. M., Huijsdens, H., Dinga, R., Wolfers, T., Mennes, M., Andreassen, O. A., Westlye, L. T., Beckmann, C. F., & Marquand, A. F. (2020) · Lecture notes in computer science · doi:10.1007/978-3-030-59728-3_68 · Cited by 67
Self-citationPromises and pitfalls of deep neural networks in neuroimaging-based psychiatric research
Eitel, F., Schulz, M.-A., Seiler, M., Walter, H., & Ritter, K. (2021) · Experimental Neurology · doi:10.1016/j.expneurol.2021.113608 · Cited by 73
A spatio-temporal reference model of the aging brain
Huizinga, W., Poot, D. H. J., Vernooij, M. W., Roshchupkin, G. V., Bron, E. E., Ikram, M. A., Rueckert, D., Niessen, W. J., & Klein, S. (2017) · NeuroImage · doi:10.1016/j.neuroimage.2017.10.040 · Cited by 64
Lefebvre, A., Delorme, R., Delanoë, C., Amsellem, F., Beggiato, A., Germanaud, D., Bourgeron, T., Toro, R., & Dumas, G. (2018) · Frontiers in Neuroscience · doi:10.3389/fnins.2018.00662 · Cited by 58
Annual Research Review: Translational machine learning for child and adolescent psychiatry
Dwyer, D., & Koutsouleris, N. (2022) · Journal of Child Psychology and Psychiatry · doi:10.1111/jcpp.13545 · Cited by 71
Vaidya, N., Marquand, A. F., Nees, F., Siehl, S., & Schumann, G. (2024) · Molecular Psychiatry · doi:10.1038/s41380-024-02556-y · Cited by 79
Self-citationA stable and replicable neural signature of lifespan adversity in the adult brain
Holz, N. E., Zabihi, M., Kia, S. M., Monninger, M., Aggensteiner, P.-M., Siehl, S., Floris, D. L., Bokde, A. L. W., Desrivières, S., Flor, H., et al. (2023) · Nature Neuroscience · doi:10.1038/s41593-023-01410-8 · Cited by 70
Self-citationA perspective on brain-age estimation and its clinical promise
Gaser, C., Kalc, P., & Cole, J. H. (2024) · Nature Computational Science · doi:10.1038/s43588-024-00659-8 · Cited by 65
Maglanoc, L. A., Kaufmann, T., Jonassen, R., Hilland, E., Beck, D., Landrø, N. I., & Westlye, L. T. (2019) · Human Brain Mapping · doi:10.1002/hbm.24802 · Cited by 59
Dinga, R., Fraza, C., Bayer, J., Kia, S. M., Beckmann, C. F., & Marquand, A. F. (2021) · bioRxiv (Cold Spring Harbor Laboratory) · doi:10.1101/2021.06.14.448106 · Cited by 62
Self-citationBedford, S. A., Lai, M., Lombardo, M. V., Chakrabarti, B., Ruigrok, A. N. V., Suckling, J., Anagnostou, E. A., Lerch, J. P., Taylor, M. J., Nicolson, R., et al. (2024) · Biological Psychiatry · doi:10.1016/j.biopsych.2024.07.024 · Cited by 63
Brucar, L. R., Feczko, E., Fair, D. A., & Zilverstand, A. (2022) · Biological Psychiatry · doi:10.1016/j.biopsych.2022.12.020 · Cited by 60
The morphometric co‐atrophy networking of schizophrenia, autistic and obsessive spectrum disorders
Cauda, F., Nani, A., Costa, T., Palermo, S., Tatu, K., Manuello, J., Duca, S., Fox, P. T., & Keller, R. (2018) · Human Brain Mapping · doi:10.1002/hbm.23952 · Cited by 51
Modelling brain development to detect white matter injury in term and preterm born neonates
O’Muircheartaigh, J., Robinson, E. C., Pietsch, M., Wolfers, T., Aljabar, P., Cordero‐Grande, L., Teixeira, R. P. A. G., Božek, J., Schuh, A., Makropoulos, A., et al. (2019) · Brain · doi:10.1093/brain/awz412 · Cited by 54
Self-citationMultimodal phenotypic axes of Parkinson’s disease
Markello, R. D., Shafiei, G., Tremblay, C., Postuma, R. B., Dagher, A., & Mišić, B. (2021) · npj Parkinson s Disease · doi:10.1038/s41531-020-00144-9 · Cited by 54
Božek, J., Griffanti, L., Lau, S., & Jenkinson, M. (2023) · NeuroImage · doi:10.1016/j.neuroimage.2023.119864 · Cited by 62
Tobe, R. H., MacKay‐Brandt, A., Lim, R. W.-S., Kramer, M., Breland, M. M., Tu, L., Tian, Y., Trautman, K. D., Hu, C., Sangoi, R., et al. (2022) · Scientific Data · doi:10.1038/s41597-022-01329-y · Cited by 52
Functional Connectome–Based Predictive Modeling in Autism
Horien, C. L., Floris, D. L., Greene, A. S., Noble, S., Rolison, M. J., Tejavibulya, L., O’Connor, D. A., McPartland, J. C., Scheinost, D., Chawarska, K., et al. (2022) · Biological Psychiatry · doi:10.1016/j.biopsych.2022.04.008 · Cited by 49
Tunç, B., Yankowitz, L., Parker, D., Alappatt, J. A., Pandey, J., Schultz, R., & Verma, R. (2019) · Molecular Autism · doi:10.1186/s13229-019-0301-5 · Cited by 47
Social isolation is linked to classical risk factors of Alzheimer’s disease-related dementias
Shafighi, K., Villeneuve, S., Rosa Neto, P., Badhwar, A., Poirier, J., Sharma, V., Medina, Y. I., Silveira, P. P., Dube, L., Glahn, D., et al. (2023) · PLOS ONE · doi:10.1371/journal.pone.0280471 · Cited by 51
“In particular, classical tests for statistical significance would have only provided dichotomic statements in the form of p-values against the null hypothesis of no effect in the data [35, 36].”
BackgroundStructural insight into the individual variability architecture of the functional brain connectome
Sun, L., Liang, X., Duan, D., Liu, J., Chen, Y., Wang, X., Liao, X., Xia, M., Zhao, T., & Yong He, A. (2022) · NeuroImage · doi:10.1016/j.neuroimage.2022.119387 · Cited by 48
Saponaro, S., Lizzi, F., Serra, G., Mainas, F., Oliva, P., Giuliano, A., Calderoni, S., & Retico, A. (2024) · Brain Informatics · doi:10.1186/s40708-023-00217-4 · Cited by 50
Brain health in diverse settings: How age, demographics and cognition shape brain function
Hernandez, H., Báez, S., Medel, V., Moguilner, S., Cuadros, J., Santamaría‐García, H. A., Tagliazucchi, E., Valdes-Sosa, P. A., Lopera, F. J., Ochoa-Gómez, J. F., et al. (2024) · NeuroImage · doi:10.1016/j.neuroimage.2024.120636 · Cited by 42
Zhang, W., Groen, W. B., Mennes, M., Greven, C. U., Buitelaar, J. K., & Rommelse, N. N. J. (2017) · Psychological Medicine · doi:10.1017/s003329171700201x · Cited by 49
Self-citation
Metadata
- Authors
- Marquand, A. F., Rezek, I., Buitelaar, J., & Beckmann, C. F.
- Affiliations
- Radboud University Nijmegen (NL)
- Venue
- Biological Psychiatry
- Publisher
- Elsevier BV
- Published
- 2016-10
- Volume
- 80
- Issue
- 7
- Pages
- 552-561
- ISSN
- 0006-3223 (ISSN-L)
- PMC
- PMC5023321
- OpenAlex
- W2229782077
- Semantic Scholar
- 9b47bad4812d5be774f7917d33c0387cb880590c
- Cited by
- 683
- References
- 54
- Citations by year
- 2026: 125 · 2025: 131 · 2024: 91 · 2023: 63 · 2022: 62 · 2021: 89 · 2020: 36 · 2019: 32 · 2018: 29 · 2017: 17 · 2016: 8
- FWCI
- 40.80
- Type
- journal article
- Language
- en
- Open access
- hybrid
- doi.org
- Locations
- Biological Psychiatry (publishedVersion, cc-by)
- PubMed Central (publishedVersion, cc-by)
- PubMed (publishedVersion)
- Radboud Repository (Radboud University) (submittedVersion, cc-by)
- Radboud Repository (Radboud University) (submittedVersion, other-oa)
- Funders
- Eli Lilly and Company
- Wellcome Trust (024.001.006, 098369/Z/12/Z, 098369)
- European Commission (278948, 602805)
- Servier
- H. Lundbeck A/S
- Horizon 2020 Framework Programme (H2020/2014–2020, 643051, 603016, 642996, 024.001.006)
- Cilag
- Topics
- Social Sciences › Psychology › Experimental and Cognitive Psychology › Mental Health Research Topics
- Health Sciences › Medicine › Psychiatry and Mental health › Attention Deficit Hyperactivity Disorder
- Life Sciences › Neuroscience › Cognitive Neuroscience › Functional Brain Connectivity Studies
- Keywords
- normative modeling, clinical heterogeneity, Research Domain Criteria, personalized prediction, impulsivity, ADHD symptoms, hyperactivity, diagnostic labels, outlier detection
- MeSH terms
- Adult, Attention Deficit Disorder with Hyperactivity, Brain, Data Interpretation, Statistical, Female, Humans, Impulsive Behavior, Magnetic Resonance Imaging, Male, Reward, Models, Statistical, Cluster Analysis, Case-Control Studies, Young Adult, Functional Neuroimaging, Delay Discounting
About these checks
Registry, retraction, Cites and statistics results are computed, not judged, with one exception: a printed reference that no index lists is read once by a model before it counts as a citation error. Claims are extracted by a model and kept only when their quote appears verbatim in the text; each cited source is then checked, with a model’s help, for whether it says what the claim relies on. Those verdicts can be wrong — read the claim’s quote and the cited source before relying on one.
A language model drew the claims from the paper on 2026-10-08, under version 3 of the claim definition (model deepseek-v4.1-flash, prompt extract-v3).
A second model labelled each claim on 2026-10-08 (model jev-1.13-20260917, definition revision gold-guideline-v0.2).
Cited sources are checked with a language model’s help (gpt-6-sol).
Statistics and arithmetic are recomputed, not judged.
Confidence bands are shown only for fields calibrated on our annotated test set. None is calibrated yet, so no band is shown.
What counts as a claim ›How we measure confidence ›How we check this ›
Are you an author, or do you see a problem with this page? Request a review
