

The DOI matches its Crossref record; 66 of the 66 references it cites were found in a registry or an index; 23 of the 45 sources its claims cite were checked for support.
Molecular Architecture of the Mouse Nervous System
Open accessPublished version of a preprint
Abstract
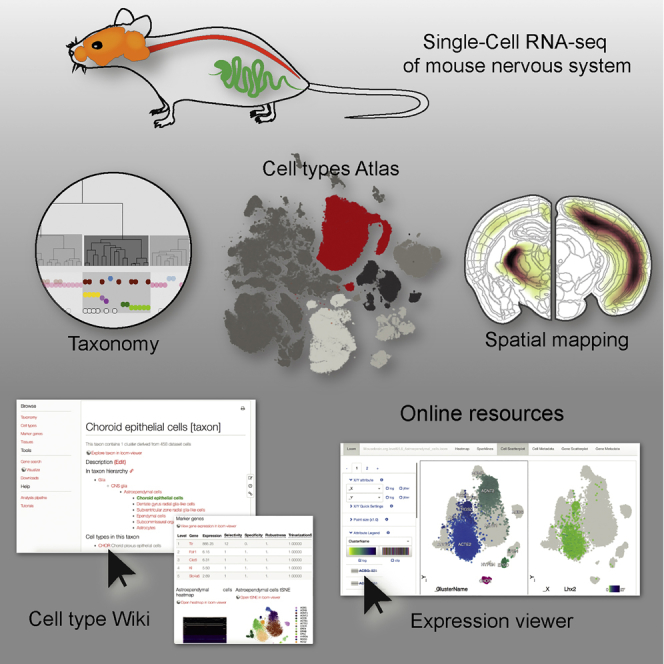
The mammalian nervous system executes complex behaviors controlled by specialized, precisely positioned, and interacting cell types. Here, we used RNA sequencing of half a million single cells to create a detailed census of cell types in the mouse nervous system. We mapped cell types spatially and derived a hierarchical, data-driven taxonomy. Neurons were the most diverse and were grouped by developmental anatomical units and by the expression of neurotransmitters and neuropeptides. Neuronal diversity was driven by genes encoding cell identity, synaptic connectivity, neurotransmission, and membrane conductance. We discovered seven distinct, regionally restricted astrocyte types that obeyed developmental boundaries and correlated with the spatial distribution of key glutamate and glycine neurotransmitters. In contrast, oligodendrocytes showed a loss of regional identity followed by a secondary diversification. The resource presented here lays a solid foundation for understanding the molecular architecture of the mammalian nervous system and enables genetic manipulation of specific cell types.
Overview
AI snapshot
Written from the paper’s full text.
TL;DR
The paper uses single-cell RNA sequencing of ~half a million cells across 19 regions of the mouse nervous system to create a molecular census and data-driven taxonomy of cell types. It reports that nervous system organization reflects major cell class, developmental origin, and neurotransmitter type, with regionally specified astrocytes and a loss of regional patterning in the oligodendrocyte lineage.
Key findings
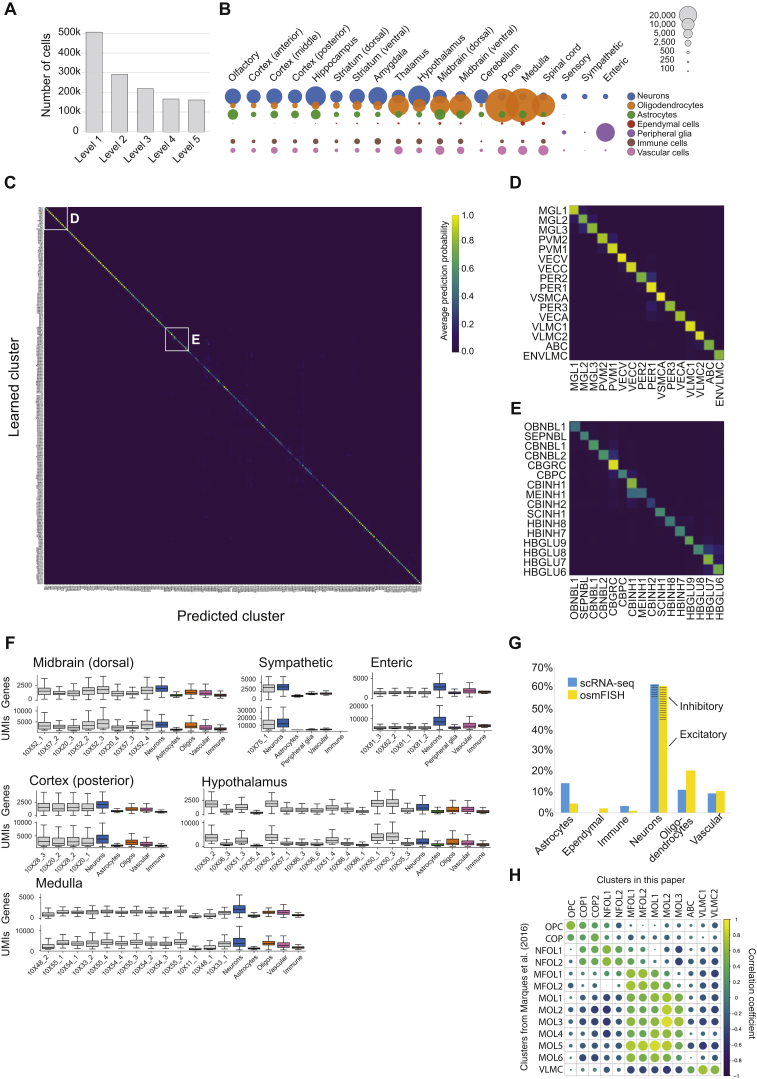
- The survey analyzed 509,876 cells and retained a final curated compendium of 265 clusters represented by 160,796 high-quality single-cell transcriptomes; 248 (93%) clusters were uniquely identifiable with just two genes, 17 required three genes, and none required more than three. A random forest classifier on held-out data achieved average precision and recall of 82%, and 98% of 139 previously published clusters were perfect or near-perfect matches.
- Neurons were the most diverse class: PNS neurons segregated into sensory, sympathetic, and enteric subdivisions, while CNS neurons generally split first by anteroposterior domain and then by excitatory versus inhibitory neurotransmitter. The paper identified seven molecularly distinct astrocyte types with regionally restricted distributions, including telencephalon-specific ACTE1/ACTE2 and non-telencephalon ACNT1/ACNT2 separated by a sharp Mfge8/Agt border.
- Oligodendrocyte lineage stages OPC, COP, and NFOL presented as single brain-wide common cell types regardless of tissue, indicating that mature oligodendrocyte diversity arises by secondary diversification rather than developmental patterning. Spinal cord and hindbrain oligodendrocytes retained Hox gene expression, but forebrain and midbrain patterning transcription factors were detected only at very low levels (<1% of cells) if at all.
Methods
- Dissected 19 regions from adolescent mice (postnatal ages P12–30, plus 6- and 8-week-old mice), including brain, spinal cord, dorsal root ganglia, sympathetic ganglion, and enteric nervous system; used 133 samples and 10X Genomics Chromium droplet microfluidics, with FACS for enteric neural-crest-derived cells and some inhibitory neurons.
- Developed and applied “cytograph,” a multistage pipeline including quality filtering, major-class SVM classification, multiscale KNN manifold learning, graph t-SNE, Polished Louvain clustering, gene enrichment, Bayesian trinarization, marker gene set discovery, and dendrogram construction.
- Validated clusters by random forest classification, comparison with six published scRNA-seq datasets, RNAscope in situ hybridization, and spatial correlation of cluster expression profiles with Allen Mouse Brain Atlas ISH voxel data.
Limitations
- Stated limitations: technical/experimental issues including doublets, sex-specific gene expression, and low-quality cells; sampling only a little more than half a million cells with relatively shallow sequencing likely misses additional structure and subtypes; differential survival or size selection biases may have lost cell types (e.g., Purkinje cells likely undersampled); clustering was conservative and did not analyze substantial remaining heterogeneity within clusters; and the work describes only molecular cell types without linking them to functional, anatomical, morphological, or electrophysiological properties.
- Evident from the text: the survey omitted at least the retina, olfactory epithelium, vomeronasal organ, inner ear, and parasympathetic ganglia; enteric analysis covered only the myenteric plexus of the small intestine; and the authors note that interneurons were undersampled by scRNA-seq while astrocytes were undersampled by osmFISH.
Model-written summary. Check it against the paper before relying on it.
Integrity signals
Registry
Cites
Statistics
Figures
Verification
Claims the paper makes
132 Own result · 63 Own interpretation · 14 Own method · 11 Partly supported · 10 No full text of the sources · 9 Supported · 6 No basis given · 3 Sources not found · 3 Not checked yet · 1 Couldn’t confirm · accuracy not yet measured
The cited sources that could be checked couldn’t confirm or dispute this claim.
In the paper
“Of the 139 previously published clusters, 98% were perfect or near-perfect matches to corresponding clusters in the new compendium (84% perfect, 14% near perfect, 2% mismatches; see Table S2).”
§ Molecular Architecture of the Mouse Nervous System > Results > A Molecular Survey of the Mouse Nervous System
What the sources say
- Not checked — no full text of the sourcecites Zeisel et al., 2015 source
- Could not verifycites Muñoz-Manchado et al., 2018 sourceExperimental — accuracy not yet measured
The Results section, “scRNA-Seq of Interneurons of the Dorsolateral Striatum” (page unavailable), reports nine clusters in Dataset B and 97% precision and 96% recall for a classifier, not matches to previously published clusters. Searches for “139,” “near-perfect matches,” and comparisons with six published datasets found no passage reporting the claimed 98% concordance or its breakdown. (LLM, conf=0.77)
- Not checked — no full text of the sourcecites Hochgerner et al., 2018 source
plaincorrelational- Asserted: passes — The authors put it forward as true.
- Checkable: passes — It can be checked against evidence.
- Load-bearing: passes — The paper’s conclusions depend on it.
- Based: passes — The paper gives a reason why it holds.
The cited sources support only part of this claim — read each source’s verdict below.
In the paper
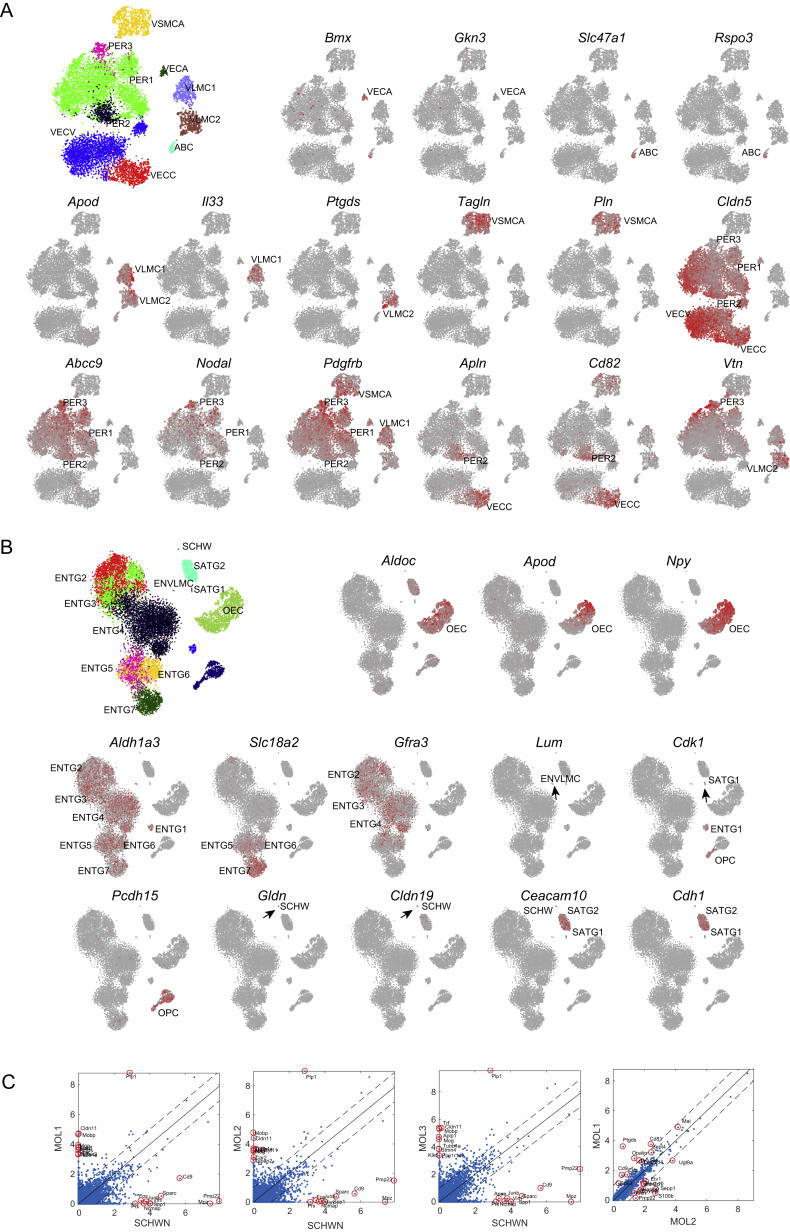
“Two types were distinguished by expression of genes including the pro-inflammatory cytokine Il33 (VLMC1) and the Prostaglandin D2 synthetase Ptgds (VLMC2), the latter previously found as the most highly enriched gene in mouse leptomeninges (Yasuda et al., 2013) (Figure S3A).”
§ Molecular Architecture of the Mouse Nervous System > Results > Vascular Cells and a Family of Broadly Distributed Mesothelial Fibroblasts
What the sources say
- Partly supportedcites Yasuda et al., 2013 sourceExperimental — accuracy not yet measured
The Microarray Analysis section identifies prostaglandin D2 synthase as an arachnoid-barrier marker in mouse leptomeninges, and the Establishment of Immortalized Mouse AB Cell Lines section reports strong staining for the protein. The citation is attached to the claim that Ptgds was the most highly enriched gene in mouse leptomeninges; our copy supports its expression there, but does not establish that ranking. The VLMC1/VLMC2 distinction is not the part attributed to Yasuda et al. by this citation. (LLM, conf=0.84)
plaincorrelational- Asserted: passes — The authors put it forward as true.
- Checkable: passes — It can be checked against evidence.
- Load-bearing: unclear — It is unclear whether the paper’s conclusions depend on it.
- Based: passes — The paper gives a reason why it holds.
- Partly supported
Every source the paper cites for this claim was checked and supports it.
In the paper
“Brain fibroblast-like cells are likely identical to the vascular leptomeningeal cells (VLMCs) that we previously described in the mouse CNS (Marques et al., 2016).”
§ Molecular Architecture of the Mouse Nervous System > Results > Vascular Cells and a Family of Broadly Distributed Mesothelial Fibroblasts
What the sources say
- Supportedcites Marques et al., 2016 source
The passage indexed as Abstract (page not supplied) identifies vascular and leptomeningeal cells (VLMCs) in the mouse CNS and locates them on blood vessels and meninges. The citation supports the identification of the previously described cell population; the proposed identity with brain fibroblast-like cells is the citing authors’ inference. (LLM, conf=0.88)
hedgedcorrelational- Asserted: passes — The authors put it forward as true.
- Checkable: passes — It can be checked against evidence.
- Load-bearing: unclear — It is unclear whether the paper’s conclusions depend on it.
- Based: passes — The paper gives a reason why it holds.
- Supported
Every source the paper cites for this claim was checked and supports it.
In the paper
“In addition, here we identified central canal neurons (SCINH11), known as cerebrospinal fluid-contacting neurons, which expressed transcription factors Gata2 and Gata3 (Figure S7) (Petracca et al., 2016).”
§ Molecular Architecture of the Mouse Nervous System > Results > Central Nervous Systems Neurons
What the sources say
- Supportedcites Petracca et al., 2016 source
The section “Spinal cord CSF-cNs are a subset of Gata2/3-expressing cells” identifies Gata2-expressing cells at the central canal as cerebrospinal fluid-contacting neurons. The section “CSF-cNs are late-born Gata2/3+ neurons” states that these neurons share expression of Gata2 and Gata3. SCINH11 is the citing authors’ label for the cells they identified, not a label attributed to Petracca et al. (LLM, conf=0.93)
plaincorrelational- Asserted: passes — The authors put it forward as true.
- Checkable: passes — It can be checked against evidence.
- Load-bearing: passes — The paper’s conclusions depend on it.
- Based: passes — The paper gives a reason why it holds.
- Supported
Every source the paper cites for this claim was checked and supports it.
In the paper
“These observations, and the finding that OPCs align molecularly with all the neural-crest-derived glia, suggest that they are a neural-crest-like type of glia and support the view that they have a common evolutionary origin with Schwann cells (Kastriti and Adameyko, 2017).”
§ Molecular Architecture of the Mouse Nervous System > Results > Neural-Crest-Derived Glia and Oligodendrocyte Progenitors
What the sources say
- Supportedcites Kastriti and Adameyko, 2017 source
The Conclusion (pp. 196–202) proposes a common evolutionary progenitor for central and peripheral glia. The evolutionary-scenario section likewise proposes a last common progenitor for CNS and PNS glia; this supports the citing sentence’s hedged view about OPCs and Schwann cells, rather than establishing their shared ancestry as fact. (LLM, conf=0.88)
hedgedcorrelational- Asserted: passes — The authors put it forward as true.
- Checkable: passes — It can be checked against evidence.
- Load-bearing: passes — The paper’s conclusions depend on it.
- Based: passes — The paper gives a reason why it holds.
- Supported
The cited sources support only part of this claim — read each source’s verdict below.
In the paper
“These observations, and the finding that OPCs align molecularly with all the neural-crest-derived glia, suggest that they are a neural-crest-like type of glia and support the view that they have a common evolutionary origin with Schwann cells (Kastriti and Adameyko, 2017).”
§ Molecular Architecture of the Mouse Nervous System > Results > Neural-Crest-Derived Glia and Oligodendrocyte Progenitors
What the sources say
- Partly supportedcites Kastriti and Adameyko, 2017 sourceExperimental — accuracy not yet measured
In “Similarity of PNS glial subtypes to CNS glia” (page unavailable), the paper describes shared features of OPCs and neural-crest-derived peripheral glia, including SOX10 expression and migratory ability. It also emphasizes differences in their lineage specification, notes that OPCs lack the neural-crest-associated Foxd3, and limits proximity to the neural crest domain to a dorsal OPC population. Those passages support a qualified resemblance, not a characterization of OPCs generally as a neural-crest-like type of glia. (LLM, conf=0.82)
hedgedcorrelational- Asserted: passes — The authors put it forward as true.
- Checkable: passes — It can be checked against evidence.
- Load-bearing: passes — The paper’s conclusions depend on it.
- Based: passes — The paper gives a reason why it holds.
- Partly supported
Every source the paper cites for this claim was checked and supports it.
In the paper
“This is reminiscent of the role of the HoxD cluster during digit formation (Deschamps, 2008) and suggests that the HoxC cluster may be involved in the specification of distinct sympathetic cell types along some spatial axis.”
§ Molecular Architecture of the Mouse Nervous System > Results > Drivers of Neuronal and Glial Diversity
What the sources say
- Supportedcites Deschamps, 2008 source
The citation is attached to the HoxD cluster’s role in digit formation, not to the citing authors’ suggestion about HoxC and sympathetic cell types. In “Hoxd gene expression: late limb collinearity opposite to axial collinearity,” the source says Hoxd expression is essential for correct digit morphogenesis. (LLM, conf=0.93)
hedgedconditional- Asserted: passes — The authors put it forward as true.
- Checkable: passes — It can be checked against evidence.
- Load-bearing: unclear — It is unclear whether the paper’s conclusions depend on it.
- Based: passes — The paper gives a reason why it holds.
- Supported
Every source the paper cites for this claim was checked and supports it.
In the paper
“The intermediate behavior of astrocytes is therefore consistent with the emerging view that they are not simply support cells, but they play an active role in computational processing (Henneberger et al., 2010).”
§ Molecular Architecture of the Mouse Nervous System > Discussion
What the sources say
- Supportedcites Henneberger et al., 2010 source
The paper reports that Ca2+-dependent D-serine release from astrocytes controls LTP at nearby hippocampal synapses (Abstract). It also proposes that astrocytes may regulate plasticity across a local neuropil domain. These findings support the cited view that astrocytes actively influence neural processing rather than merely providing support; the citing authors' “intermediate behavior” is their own observation. (LLM, conf=0.86)
hedgedcorrelational- Asserted: passes — The authors put it forward as true.
- Checkable: passes — It can be checked against evidence.
- Load-bearing: unclear — It is unclear whether the paper’s conclusions depend on it.
- Based: passes — The paper gives a reason why it holds.
- Supported
Every source the paper cites for this claim was checked and supports it.
In the paper
“However, modularity-based graph clustering suffers a well-known resolution limit (Fortunato and Barthélemy, 2007), failing to find small clusters even when they are perfectly unambiguously defined.”
§ Molecular Architecture of the Mouse Nervous System > STAR★Methods > Quantification and Statistical Analysis
What the sources say
- Supportedcites Fortunato and Barthélemy, 2007 source
The Introduction (p. 1) states that modularity has an intrinsic resolution scale and may fail to resolve modules even when they are complete graphs connected by single bridges. The Consequences section (p. 5) gives an example in which maximizing modularity groups clearly defined cliques rather than detecting them as separate communities. (LLM, conf=0.94)
boosteddirect- Asserted: passes — The authors put it forward as true.
- Checkable: passes — It can be checked against evidence.
- Load-bearing: passes — The paper’s conclusions depend on it.
- Based: passes — The paper gives a reason why it holds.
- Supported
The cited sources support only part of this claim — read each source’s verdict below.
In the paper
“The atlas will also help us understand the function of specific genes—for example, those implicated in disease (Skene et al., 2018).”
§ Molecular Architecture of the Mouse Nervous System > Discussion
What the sources say
- Partly supportedcites Skene et al., 2018 sourceExperimental — accuracy not yet measured
The Introduction (page unavailable) says that connecting genetic findings to cellular studies can guide subsequent experiments. The Results (page unavailable) map disease-associated genes to particular brain cell types, supporting the proposed use of an atlas in part. The paper does not establish that an atlas will reveal the functions of specific disease-implicated genes. (LLM, conf=0.78)
plaindirect- Asserted: passes — The authors put it forward as true.
- Checkable: passes — It can be checked against evidence.
- Load-bearing: passes — The paper’s conclusions depend on it.
- Based: passes — The paper gives a reason why it holds.
- Partly supported
- Probably not a substantial claim. 27
- It may state two separate claims as one. 96
- The quote only partly states this claim. 1
The cited sources support only part of this claim — read each source’s verdict below.
In the paper
“single-cell RNA sequencing (scRNA-seq) has emerged as a powerful method for unbiased discovery of cell types and states based on gene activity (Islam et al., 2011, Jaitin et al., 2014, Macosko et al., 2015, Ramsköld et al., 2012, Shekhar et al., 2016, Tang et al., 2009, Tasic et al., 2016, Usoskin et al., 2015, Zeisel et al., 2015)”
§ Molecular Architecture of the Mouse Nervous System > Introduction
What the sources say
- Partly supportedcites Islam et al., 2011 sourceExperimental — accuracy not yet measured
The Discussion reports that single-cell expression profiling forms cell-type clusters without known markers or prior knowledge that a type exists, supporting unbiased discovery of cell types. It is more cautious about cell states: distinct substates may or may not be distinguishable by transcriptome analysis, so the claim overstates that part. (LLM, conf=0.88)
- Supportedcites Jaitin et al., 2014 source
The Abstract describes single-cell RNA-seq combined with unsupervised classification as enabling ab initio cell-type characterization from transcriptional states. It also says the method can characterize cell-type and cell-state compositions, supporting the claim about discovery based on gene activity. (LLM, conf=0.93)
- Supportedcites Macosko et al., 2015 source
The Introduction describes profiling individual cells’ mRNA expression to investigate cell types and states. The Discussion reports that unsupervised analysis identified 39 transcriptionally distinct retinal populations and identifies cell states as another application of Drop-Seq. Together, these passages support the broad claim about discovery based on gene activity; page numbers were not provided. (LLM, conf=0.92)
plain- Asserted: passes — The authors put it forward as true.
- Checkable: passes — It can be checked against evidence.
- Load-bearing: passes — The paper’s conclusions depend on it.
- Based: passes — The paper gives a reason why it holds.
Probably not a substantial claim.
- Partly supported
The cited sources support only part of this claim — read each source’s verdict below.
In the paper
“Oligodendrocyte morphology varies according to the type of axon they myelinate, but transplantation experiments indicate that those differences are plastic (Richardson et al., 2006).”
§ Molecular Architecture of the Mouse Nervous System > Results > Loss of Patterning in the Oligodendrocyte Lineage and Convergence to a Single Brain-wide Intermediate State
What the sources say
- Partly supportedcites Richardson et al., 2006 sourceExperimental — accuracy not yet measured
The References (page unavailable) cite work on morphological heterogeneity of oligodendrocytes and on their not being inherently programmed to myelinate a specific axon size. However, the passages retrieved from our copy do not establish that morphology varies by the type of axon myelinated or that transplantation experiments demonstrate plasticity of those differences. (LLM, conf=0.73)
hedgedcorrelational- Asserted: passes — The authors put it forward as true.
- Checkable: passes — It can be checked against evidence.
- Load-bearing: passes — The paper’s conclusions depend on it.
- Based: passes — The paper gives a reason why it holds.
It may state two separate claims as one.
- Partly supported
The cited sources support only part of this claim — read each source’s verdict below.
In the paper
“Similar phenomena were recently reported in embryonic stem cells in vitro (Briggs et al., 2017) and, less dramatically, in the developing Drosophila brain (Li et al., 2017).”
§ Molecular Architecture of the Mouse Nervous System > Results > Loss of Patterning in the Oligodendrocyte Lineage and Convergence to a Single Brain-wide Intermediate State
What the sources say
- Supportedcites Briggs et al., 2017 source
The Results section, “The DP and SP trajectories bifurcate after early neural commitment and converge separately to the terminal MN state” (page unavailable), reports that two in vitro mouse embryonic stem-cell differentiation paths diverge and then converge on the same motor-neuron state. Only the embryonic-stem-cell clause is attributed to Briggs et al.; the Drosophila clause cites Li et al. separately. (LLM, conf=0.94)
- Not matchedcites Li et al., 2017
Couldn’t be matched to a paper in Crossref, so it can’t be checked.
plaincorrelational- Asserted: passes — The authors put it forward as true.
- Checkable: passes — It can be checked against evidence.
- Load-bearing: fails — The paper’s conclusions may not depend on it.
- Based: passes — The paper gives a reason why it holds.
Probably not a substantial claim. The paper’s conclusions may not depend on it. It may state two separate claims as one.
- Supported
The cited sources support only part of this claim — read each source’s verdict below.
In the paper
“OPCs are derived from neural tube precursors that are patterned along the anteroposterior axis. This has been demonstrated clearly, e.g., by genetic lineage tracing of Emx1-positive neural progenitors, which selectively labels forebrain oligodendrocytes (Kessaris et al., 2006).”
§ Molecular Architecture of the Mouse Nervous System > Results > Loss of Patterning in the Oligodendrocyte Lineage and Convergence to a Single Brain-wide Intermediate State
What the sources say
- Partly supportedcites Kessaris et al., 2006 sourceExperimental — accuracy not yet measured
The Results (‘Subsequent waves of OLPs from the LGE/CGE and cortex’) report Emx1-Cre lineage tracing that labels oligodendrocyte precursors arising in the cortex, not throughout the forebrain. The Discussion describes region-specific forebrain precursor populations and a ventral-to-dorsal production sequence; it does not establish the claimed anteroposterior patterning through Emx1 tracing. (LLM, conf=0.88)
boosteddirect- Asserted: passes — The authors put it forward as true.
- Checkable: passes — It can be checked against evidence.
- Load-bearing: passes — The paper’s conclusions depend on it.
- Based: passes — The paper gives a reason why it holds.
It may state two separate claims as one.
- Partly supported
The cited sources support only part of this claim — read each source’s verdict below.
In the paper
“These two genes encode drug and xenobiotic transporters known as BCGP and P-gp, respectively, which are expressed on barrier cells of the arachnoid mater of the meninges (Yasuda et al., 2013).”
§ Molecular Architecture of the Mouse Nervous System > Results > Vascular Cells and a Family of Broadly Distributed Mesothelial Fibroblasts
What the sources say
- Partly supportedcites Yasuda et al., 2013 sourceExperimental — accuracy not yet measured
The Abstract and ‘Drug Transporters on Arachnoid Barrier Cells’ section report BCRP and P-gp expression in arachnoid barrier cells. The source links Abcg2 to BCRP, not ‘BCGP,’ and identifies the P-gp gene as Abcb1a, not ‘Pgp.’ (LLM, conf=0.87)
plaincorrelational- Asserted: passes — The authors put it forward as true.
- Checkable: passes — It can be checked against evidence.
- Load-bearing: passes — The paper’s conclusions depend on it.
- Based: passes — The paper gives a reason why it holds.
It may state two separate claims as one.
- Partly supported
Every source the paper cites for this claim was checked and supports it.
In the paper
“Oligodendrocytes wrap myelin sheets around axons to support long-range neurotransmission and were previously analyzed by scRNA-seq (Marques et al., 2016).”
§ Molecular Architecture of the Mouse Nervous System > Results > Loss of Patterning in the Oligodendrocyte Lineage and Convergence to a Single Brain-wide Intermediate State
What the sources say
- Supportedcites Marques et al., 2016 source
The opening passage (labeled Abstract in our copy) says oligodendrocytes ensheath CNS axons, allowing rapid saltatory conduction. The Abstract also reports single-cell RNA-seq of 5,072 oligodendrocyte-lineage cells, supporting the statement that they had previously been analyzed by scRNA-seq. (LLM, conf=0.90)
plaindirect- Asserted: passes — The authors put it forward as true.
- Checkable: passes — It can be checked against evidence.
- Load-bearing: fails — The paper’s conclusions may not depend on it.
- Based: passes — The paper gives a reason why it holds.
Probably not a substantial claim. The paper’s conclusions may not depend on it. It may state two separate claims as one.
- Supported
The cited sources support only part of this claim — read each source’s verdict below.
In the paper
“the latter previously found as the most highly enriched gene in mouse leptomeninges (Yasuda et al., 2013)”
§ Molecular Architecture of the Mouse Nervous System > Results > Vascular Cells and a Family of Broadly Distributed Mesothelial Fibroblasts
What the sources say
- Partly supportedcites Yasuda et al., 2013 sourceExperimental — accuracy not yet measured
Table 1 lists L-Ptgds with the highest mouse leptomeningeal microarray expression value among the genes shown, and the ‘Microarray Analysis of Drug Detoxification Genes in AB Leptomeninges’ section identifies prostaglandin D2 synthase as an arachnoid-barrier marker. The analysis covers selected genes; it does not establish that Ptgds was the most highly enriched gene across all mouse leptomeningeal genes. (LLM, conf=0.84)
plain- Asserted: passes — The authors put it forward as true.
- Checkable: passes — It can be checked against evidence.
- Load-bearing: fails — The paper’s conclusions may not depend on it.
- Based: passes — The paper gives a reason why it holds.
Probably not a substantial claim. The paper’s conclusions may not depend on it.
- Partly supported
Every source the paper cites for this claim was checked and supports it.
In the paper
“Note that although the oligodendrocyte lineage clusters aligned well with those previously published (Figure S1H; Marques et al., 2016), there was not a perfect correspondence, and subtype labels in this paper do not correspond exactly to those previously described.”
§ Molecular Architecture of the Mouse Nervous System > Results > Loss of Patterning in the Oligodendrocyte Lineage and Convergence to a Single Brain-wide Intermediate State
What the sources say
- Supportedcites Marques et al., 2016 source
The paper’s Abstract describes oligodendrocyte-lineage populations and their clusters, including precursor, newly formed, myelin-forming, and mature states. It therefore supports the citation’s identification of the previously published clusters. The imperfect correspondence and label differences are the citing authors’ comparison of their own results, not findings attributed to Marques et al. (LLM, conf=0.89)
plain- Asserted: passes — The authors put it forward as true.
- Checkable: passes — It can be checked against evidence.
- Load-bearing: fails — The paper’s conclusions may not depend on it.
- Based: passes — The paper gives a reason why it holds.
Probably not a substantial claim. The paper’s conclusions may not depend on it. It may state two separate claims as one.
- Supported
Every source the paper cites for this claim was checked and supports it.
In the paper
“We note that since GLYT1 is a reversible glycine transporter (Supplisson and Roux, 2002), if it were expressed in telencephalic astrocytes, then those cells would potentially secrete glycine into the synaptic cleft instead of absorbing it.”
§ Molecular Architecture of the Mouse Nervous System > Results > Astroependymal Cells Are Diverse and Spatially Patterned
What the sources say
- Supportedcites Supplisson and Roux, 2002 source
The citation is attached to the statement that GlyT1 is reversible. Section 4.2 says that small concentration or potential changes may reverse net glycine flux through GlyT1b in astrocytes; Fig. 2 also describes conditions that may reverse its function. The citing authors present the telencephalic-astrocyte scenario as a conditional inference, not as a finding attributed to this source. Page numbers were not provided in the supplied passages. (LLM, conf=0.94)
hedgedconditional- Asserted: passes — The authors put it forward as true.
- Checkable: passes — It can be checked against evidence.
- Load-bearing: passes — The paper’s conclusions depend on it.
- Based: passes — The paper gives a reason why it holds.
Probably not a substantial claim.
- Supported
The cited sources support only part of this claim — read each source’s verdict below.
In the paper
“Most olfactory neurons were GABAergic, in agreement with previous work (Nagayama et al., 2014), and one was also dopaminergic.”
§ Molecular Architecture of the Mouse Nervous System > Results > Central Nervous Systems Neurons
What the sources say
- Partly supportedcites Nagayama et al., 2014 sourceExperimental — accuracy not yet measured
The Glomerular Layer section on periglomerular-cell neurotransmitters reports that GABAergic markers occur in more than half of juxtaglomerular cells. That supports the statement for this cell population, but not for olfactory neurons generally. The same section describes a dopamine-related subtype; it does not establish the citing authors’ observation that one neuron was also dopaminergic. (LLM, conf=0.86)
plain- Asserted: passes — The authors put it forward as true.
- Checkable: passes — It can be checked against evidence.
- Load-bearing: unclear — It is unclear whether the paper’s conclusions depend on it.
- Based: passes — The paper gives a reason why it holds.
It may state two separate claims as one.
- Partly supported
The cited sources support only part of this claim — read each source’s verdict below.
In the paper
“Interestingly, however, OPCs share many features of neural crest cells: they require the expression of the two key transcription factors that specify neural crest (Sox10 and Sox9) (Takada et al., 2010), they are highly migratory, and they do not respect developmental borders in the brain.”
§ Molecular Architecture of the Mouse Nervous System > Results > Neural-Crest-Derived Glia and Oligodendrocyte Progenitors
What the sources say
- Partly supportedcites Takada et al., 2010 sourceExperimental — accuracy not yet measured
The Introduction and Discussion (page numbers unavailable) describe Sox9 as important for initial OPC specification and Sox10 as required for later oligodendrocyte survival or differentiation. They also report that OPC numbers recover in Sox9 mutants and remain normal in Sox10 mutants, so the unqualified claim that OPCs require both factors overstates the source. The citation is attached to the transcription-factor clause, not the subsequent claims about migration or developmental borders. (LLM, conf=0.88)
plaincorrelational- Asserted: passes — The authors put it forward as true.
- Checkable: passes — It can be checked against evidence.
- Load-bearing: passes — The paper’s conclusions depend on it.
- Based: passes — The paper gives a reason why it holds.
It may state two separate claims as one.
- Partly supported
A result the paper reports from its own data — it cites no other source for it, so there is none to check. The quote shows it is in the paper.
In the paper
“Remarkably, we found that 248 (93%) of all clusters were uniquely identifiable with just two genes, while 17 required three genes and none required more than three”
§ Molecular Architecture of the Mouse Nervous System > Results > A Molecular Survey of the Mouse Nervous System
plain- Asserted: passes — The authors put it forward as true.
- Checkable: passes — It can be checked against evidence.
- Load-bearing: passes — The paper’s conclusions depend on it.
- Based: passes — The paper gives a reason why it holds.
It may state two separate claims as one.
A result the paper reports from its own data — it cites no other source for it, so there is none to check. The quote shows it is in the paper.
In the paper
“the dataset was affected by a number of technical artifacts, including low-quality cells, batch effects, sex-specific gene expression, neuronal-activity-dependent gene expression, and more.”
§ Molecular Architecture of the Mouse Nervous System > Results > A Molecular Survey of the Mouse Nervous System
plaindirect- Asserted: passes — The authors put it forward as true.
- Checkable: passes — It can be checked against evidence.
- Load-bearing: passes — The paper’s conclusions depend on it.
- Based: passes — The paper gives a reason why it holds.
It may state two separate claims as one.
In the paper
“Notably, interneurons were undersampled by scRNA-seq, likely due to their fragility, whereas astrocytes were undersampled by osmFISH due to the difficulty of image segmentation for irregularly shaped cells with small somata.”
§ Molecular Architecture of the Mouse Nervous System > Results > A Molecular Survey of the Mouse Nervous System
What the sources say
- Not matchedcites Codeluppi et al., 2018
Couldn’t be matched to a paper in Crossref, so it can’t be checked.
hedgedconditional- Asserted: passes — The authors put it forward as true.
- Checkable: passes — It can be checked against evidence.
- Load-bearing: unclear — It is unclear whether the paper’s conclusions depend on it.
- Based: passes — The paper gives a reason why it holds.
It may state two separate claims as one.
- Not matched
A result the paper reports from its own data — it cites no other source for it, so there is none to check. The quote shows it is in the paper.
In the paper
“comprising 84% of cells in the hindbrain (excepting cerebellum) and 71% in the spinal cord.”
§ Molecular Architecture of the Mouse Nervous System > Results > A Molecular Survey of the Mouse Nervous System
plain- Asserted: passes — The authors put it forward as true.
- Checkable: passes — It can be checked against evidence.
- Load-bearing: passes — The paper’s conclusions depend on it.
- Based: passes — The paper gives a reason why it holds.
It may state two separate claims as one.
A result the paper reports from its own data — it cites no other source for it, so there is none to check. The quote shows it is in the paper.
In the paper
“Neurons were most prevalent in rostral regions of the CNS, as well as in the cerebellum.”
§ Molecular Architecture of the Mouse Nervous System > Results > A Molecular Survey of the Mouse Nervous System
plaincorrelational- Asserted: passes — The authors put it forward as true.
- Checkable: passes — It can be checked against evidence.
- Load-bearing: unclear — It is unclear whether the paper’s conclusions depend on it.
- Based: passes — The paper gives a reason why it holds.
It may state two separate claims as one.
A result the paper reports from its own data — it cites no other source for it, so there is none to check. The quote shows it is in the paper.
In the paper
“Although most neuronal types were already mature at the age investigated (postnatal days 20–30), we observed signs of ongoing neurogenesis in several regions (Figure 2).”
§ Molecular Architecture of the Mouse Nervous System > Results > Postnatal Neurogenesis in the Central Nervous System
plain- Asserted: passes — The authors put it forward as true.
- Checkable: passes — It can be checked against evidence.
- Load-bearing: passes — The paper’s conclusions depend on it.
- Based: passes — The paper gives a reason why it holds.
It may state two separate claims as one.
- Rests on an assumption: The adolescent age (postnatal days 20–30) is appropriate for identifying mature cell types and the overall architecture of the mouse nervous system.
A result the paper reports from its own data — it cites no other source for it, so there is none to check. The quote shows it is in the paper.
In the paper
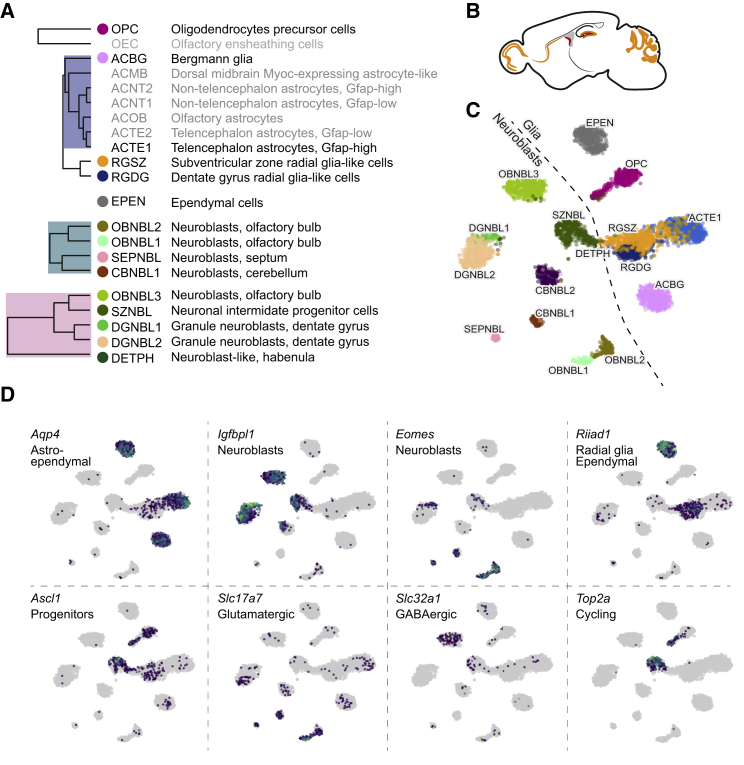
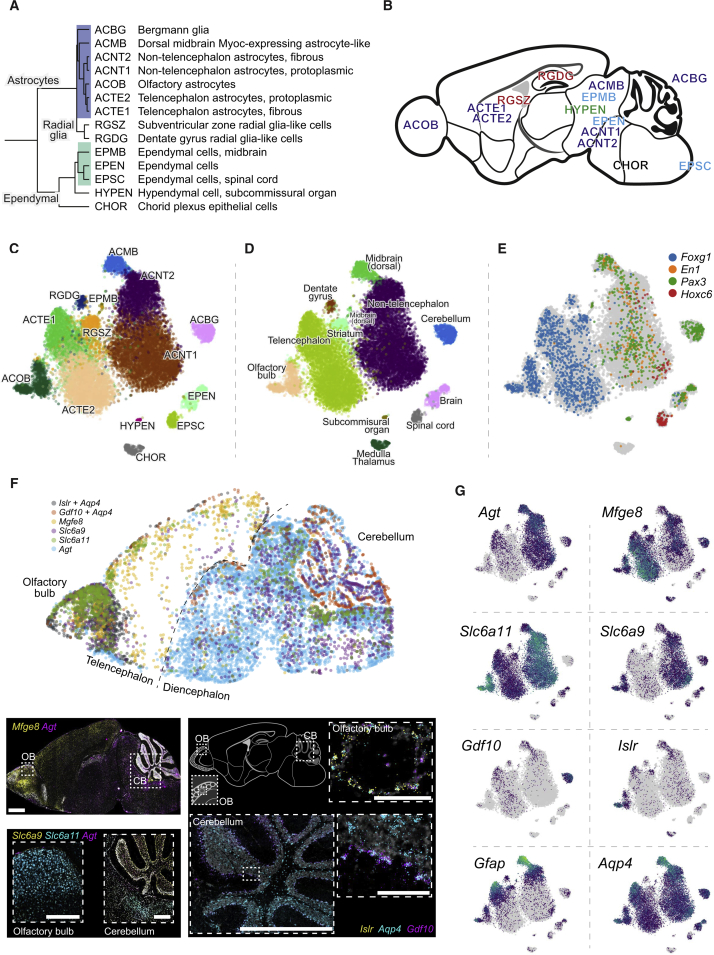
“Astrocytes, ependymal cells, and radial glia are developmentally related cell types and formed a subtree in the dendrogram (Figure 3).”
§ Molecular Architecture of the Mouse Nervous System > Results > Astroependymal Cells Are Diverse and Spatially Patterned
plaincorrelational- Asserted: passes — The authors put it forward as true.
- Checkable: passes — It can be checked against evidence.
- Load-bearing: passes — The paper’s conclusions depend on it.
- Based: passes — The paper gives a reason why it holds.
It may state two separate claims as one.
A result the paper reports from its own data — it cites no other source for it, so there is none to check. The quote shows it is in the paper.
In the paper
“Olfactory astrocytes were located around the olfactory glomeruli and could represent the previously described velate astrocytes, for which no molecular properties are known; they highly specifically expressed the Islr and Islr2 genes encoding immunoglobulin-domain cell adhesion proteins (Figures 3 and S2), among other genes.”
§ Molecular Architecture of the Mouse Nervous System > Results > Astroependymal Cells Are Diverse and Spatially Patterned
hedgedcorrelational- Asserted: passes — The authors put it forward as true.
- Checkable: passes — It can be checked against evidence.
- Load-bearing: unclear — It is unclear whether the paper’s conclusions depend on it.
- Based: passes — The paper gives a reason why it holds.
It may state two separate claims as one.
A result the paper reports from its own data — it cites no other source for it, so there is none to check. The quote shows it is in the paper.
In the paper
“Enteric glia were very abundant in our dataset (91% of all enteric cells) and almost as diverse as enteric neurons, with seven distinct types.”
§ Molecular Architecture of the Mouse Nervous System > Results > Neural-Crest-Derived Glia and Oligodendrocyte Progenitors
plain- Asserted: passes — The authors put it forward as true.
- Checkable: passes — It can be checked against evidence.
- Load-bearing: unclear — It is unclear whether the paper’s conclusions depend on it.
- Based: passes — The paper gives a reason why it holds.
It may state two separate claims as one.
A result the paper reports from its own data — it cites no other source for it, so there is none to check. The quote shows it is in the paper.
In the paper
“The radial glia-like cells (RGSZ and RGDG), which are the stem cells of both lineages, expressed Riiad1 (shared with ependymal cells; Figure 2D) and were more similar to astrocytes than to any neuroblast.”
§ Molecular Architecture of the Mouse Nervous System > Results > Postnatal Neurogenesis in the Central Nervous System
plaincorrelational- Asserted: passes — The authors put it forward as true.
- Checkable: passes — It can be checked against evidence.
- Load-bearing: unclear — It is unclear whether the paper’s conclusions depend on it.
- Based: passes — The paper gives a reason why it holds.
It may state two separate claims as one.
In the paper
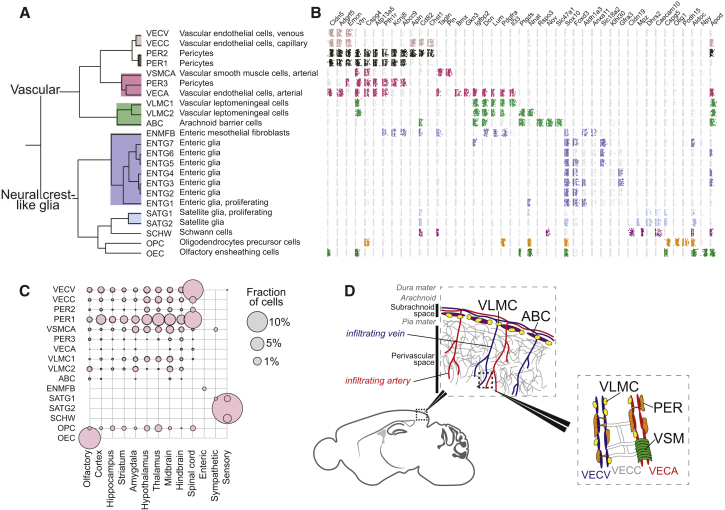
“Like Vanlandewijck et al., we observed (Figure 5) distinct endothelial cell types carrying known arterial (e.g., Bmx; VECA) and venous (Slc38a5; VECV) markers, as well as capillary endothelial cells (VECC) expressing Meox1.”
§ Molecular Architecture of the Mouse Nervous System > Results > Vascular Cells and a Family of Broadly Distributed Mesothelial Fibroblasts
What the sources say
- Not checked — no full text of the sourcecites Vanlandewijck et al., 2018 source
plain- Asserted: passes — The authors put it forward as true.
- Checkable: passes — It can be checked against evidence.
- Load-bearing: unclear — It is unclear whether the paper’s conclusions depend on it.
- Based: passes — The paper gives a reason why it holds.
It may state two separate claims as one.
A result the paper reports from its own data — it cites no other source for it, so there is none to check. The quote shows it is in the paper.
In the paper
“In contrast to all other VLMC-like cell types, ABCs did not express Lum and showed only very low levels of Pdgfra.”
§ Molecular Architecture of the Mouse Nervous System > Results > Vascular Cells and a Family of Broadly Distributed Mesothelial Fibroblasts
plain- Asserted: passes — The authors put it forward as true.
- Checkable: passes — It can be checked against evidence.
- Load-bearing: unclear — It is unclear whether the paper’s conclusions depend on it.
- Based: passes — The paper gives a reason why it holds.
It may state two separate claims as one.
A result the paper reports from its own data — it cites no other source for it, so there is none to check. The quote shows it is in the paper.
In the paper
“Here, we observed seven molecularly distinct types of astrocytes with clear regionally specialized distribution.”
§ Molecular Architecture of the Mouse Nervous System > Results > Astroependymal Cells Are Diverse and Spatially Patterned
boostedcorrelational- Asserted: passes — The authors put it forward as true.
- Checkable: passes — It can be checked against evidence.
- Load-bearing: passes — The paper’s conclusions depend on it.
- Based: passes — The paper gives a reason why it holds.
It may state two separate claims as one.
A result the paper reports from its own data — it cites no other source for it, so there is none to check. The quote shows it is in the paper.
In the paper
“In order to test this hypothesis, we examined the expression of region-specific neural tube patterning genes, the transcription factors Foxg1 (telencephalon), En1, and Pax3 (midbrain) and Hoxc6 (spinal cord). Each of these genes marked the expected subset of astrocyte and ependymal cell types (Figure 3G).”
§ Molecular Architecture of the Mouse Nervous System > Results > Astroependymal Cells Are Diverse and Spatially Patterned
plaincorrelational- Asserted: passes — The authors put it forward as true.
- Checkable: passes — It can be checked against evidence.
- Load-bearing: passes — The paper’s conclusions depend on it.
- Based: passes — The paper gives a reason why it holds.
It may state two separate claims as one.
A result the paper reports from its own data — it cites no other source for it, so there is none to check. The quote shows it is in the paper.
In the paper
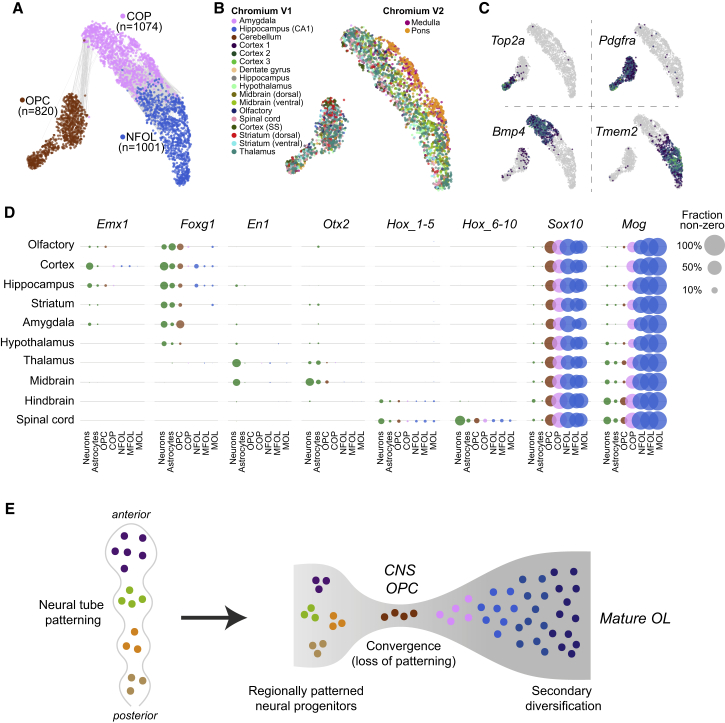
“Furthermore, OPCs remained a single cluster, with only a distinction between cycling and non-cycling OPCs (Figures 4A and 4B).”
§ Molecular Architecture of the Mouse Nervous System > Results > Loss of Patterning in the Oligodendrocyte Lineage and Convergence to a Single Brain-wide Intermediate State
plain- Asserted: passes — The authors put it forward as true.
- Checkable: passes — It can be checked against evidence.
- Load-bearing: passes — The paper’s conclusions depend on it.
- Based: passes — The paper gives a reason why it holds.
It may state two separate claims as one.
A result the paper reports from its own data — it cites no other source for it, so there is none to check. The quote shows it is in the paper.
In the paper
“Telencephalon astrocytes ACTE1 and ACTE2 were distinguished by the expression of several genes, including Mfge8 and Lhx2, and were found in the olfactory bulb, cerebral cortex, striatum, amygdala, and hippocampus but were absent from the hypothalamus, thalamus, midbrain, and hindbrain.”
§ Molecular Architecture of the Mouse Nervous System > Results > Astroependymal Cells Are Diverse and Spatially Patterned
plaincorrelational- Asserted: passes — The authors put it forward as true.
- Checkable: passes — It can be checked against evidence.
- Load-bearing: passes — The paper’s conclusions depend on it.
- Based: passes — The paper gives a reason why it holds.
It may state two separate claims as one.
A result the paper reports from its own data — it cites no other source for it, so there is none to check. The quote shows it is in the paper.
In the paper
“Non-telencephalic astrocytes ACNT1 and ACNT2 showed the opposite distribution, marked by Agt (Angiotensinogen) and found in all regions caudal to the telencephalon/diencephalon border (i.e., posterior to and including the hypothalamus and thalamus).”
§ Molecular Architecture of the Mouse Nervous System > Results > Astroependymal Cells Are Diverse and Spatially Patterned
plaincorrelational- Asserted: passes — The authors put it forward as true.
- Checkable: passes — It can be checked against evidence.
- Load-bearing: passes — The paper’s conclusions depend on it.
- Based: passes — The paper gives a reason why it holds.
It may state two separate claims as one.
A result the paper reports from its own data — it cites no other source for it, so there is none to check. The quote shows it is in the paper.
In the paper
“In addition to Bergmann glia of the cerebellum (ACBG), we found olfactory-specific astrocytes (ACOB, unrelated to olfactory ensheathing cells; see below), two subtypes of telencephalon-specific astrocytes (ACTE1 and ACTE2), two subtypes of non-telencephalon astrocytes (ACNT1 and ACNT2), and a Myoc-expressing astrocyte of the dorsal midbrain, ACMB.”
§ Molecular Architecture of the Mouse Nervous System > Results > Astroependymal Cells Are Diverse and Spatially Patterned
plain- Asserted: passes — The authors put it forward as true.
- Checkable: passes — It can be checked against evidence.
- Load-bearing: passes — The paper’s conclusions depend on it.
- Based: passes — The paper gives a reason why it holds.
It may state two separate claims as one.
A result the paper reports from its own data — it cites no other source for it, so there is none to check. The quote shows it is in the paper.
In the paper
“Similarly, we found that Hox genes 1–5 (that is, Hoxa1, Hoxb1, …, Hoxc5) were expressed in the hindbrain and spinal cord oligodendrocytes, remained expressed into mature oligodendrocytes, and were expressed at levels similar to those in neurons and astrocytes.”
§ Molecular Architecture of the Mouse Nervous System > Results > Loss of Patterning in the Oligodendrocyte Lineage and Convergence to a Single Brain-wide Intermediate State
plain- Asserted: passes — The authors put it forward as true.
- Checkable: passes — It can be checked against evidence.
- Load-bearing: passes — The paper’s conclusions depend on it.
- Based: passes — The paper gives a reason why it holds.
It may state two separate claims as one.
A result the paper reports from its own data — it cites no other source for it, so there is none to check. The quote shows it is in the paper.
In the paper
“In contrast, several transcription factors responsible for patterning the forebrain and midbrain were detected only at very low levels (<1% of cells) if at all and did not appear in mature oligodendrocytes.”
§ Molecular Architecture of the Mouse Nervous System > Results > Loss of Patterning in the Oligodendrocyte Lineage and Convergence to a Single Brain-wide Intermediate State
plain- Asserted: passes — The authors put it forward as true.
- Checkable: passes — It can be checked against evidence.
- Load-bearing: passes — The paper’s conclusions depend on it.
- Based: passes — The paper gives a reason why it holds.
It may state two separate claims as one.
A result the paper reports from its own data — it cites no other source for it, so there is none to check. The quote shows it is in the paper.
In the paper
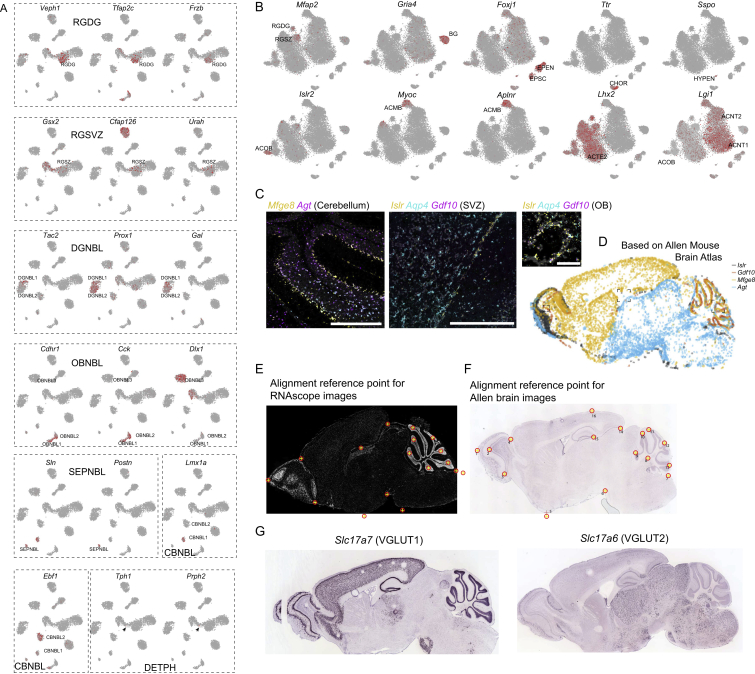
“The first category expressed Igfbpl1 and was either GABAergic (OBNBL3) or did not express any clear neurotransmitter phenotype. These neuroblasts were found in the rostral migratory stream (SZNBL and OBNBL3), dentate gyrus (DGNBL2), and habenula (DETPH).”
§ Molecular Architecture of the Mouse Nervous System > Results > Postnatal Neurogenesis in the Central Nervous System
plaincorrelational- Asserted: passes — The authors put it forward as true.
- Checkable: passes — It can be checked against evidence.
- Load-bearing: passes — The paper’s conclusions depend on it.
- Based: passes — The paper gives a reason why it holds.
It may state two separate claims as one.
In the paper
“We also did not observe distinct spinal cord populations corresponding to those previously described in the embryonic spinal cord (Hochstim et al., 2008). Those astrocytes were described as dorsoventrally patterned and distinguished by combinatorial expression of Reln and Slit1, but to our knowledge, they have not been more extensively characterized molecularly or at postnatal stages.”
§ Molecular Architecture of the Mouse Nervous System > Results > Astroependymal Cells Are Diverse and Spatially Patterned
What the sources say
- Not checked — no full text of the sourcecites Hochstim et al., 2008 source
hedged- Asserted: passes — The authors put it forward as true.
- Checkable: passes — It can be checked against evidence.
- Load-bearing: unclear — It is unclear whether the paper’s conclusions depend on it.
- Based: passes — The paper gives a reason why it holds.
It may state two separate claims as one.
A result the paper reports from its own data — it cites no other source for it, so there is none to check. The quote shows it is in the paper.
In the paper
“The second category expressed the T-box transcription factor Eomes (also known as Tbr2) and the vesicular glutamate transporter (Slc17a7, also known as VGLUT1) and thus was glutamatergic. These neuroblasts were found in the olfactory bulb (OBNBL1, OBNBL2), cerebellum (CBNBL), and septum (SEPNBL).”
§ Molecular Architecture of the Mouse Nervous System > Results > Postnatal Neurogenesis in the Central Nervous System
plaincorrelational- Asserted: passes — The authors put it forward as true.
- Checkable: passes — It can be checked against evidence.
- Load-bearing: passes — The paper’s conclusions depend on it.
- Based: passes — The paper gives a reason why it holds.
It may state two separate claims as one.
A result the paper reports from its own data — it cites no other source for it, so there is none to check. The quote shows it is in the paper.
In the paper
“In the spinal cord, we detected a clear expression of Hox genes 6–10 (that is, Hoxa6, Hoxb6, …, Hoxd10), which are responsible for patterning the thoracic spinal cord. These genes were expressed in spinal cord oligodendrocytes only, at levels similar to those observed in neurons and astrocytes, and they remained expressed throughout the oligodendrocyte lineage.”
§ Molecular Architecture of the Mouse Nervous System > Results > Loss of Patterning in the Oligodendrocyte Lineage and Convergence to a Single Brain-wide Intermediate State
boosted- Asserted: passes — The authors put it forward as true.
- Checkable: passes — It can be checked against evidence.
- Load-bearing: passes — The paper’s conclusions depend on it.
- Based: passes — The paper gives a reason why it holds.
It may state two separate claims as one.
- Rests on an assumption: Hox genes 6–10 are responsible for patterning the thoracic spinal cord.
A result the paper reports from its own data — it cites no other source for it, so there is none to check. The quote shows it is in the paper.
In the paper
“The fourth VLMC-like cell type (enteric mesothelial fibroblasts; ENMFBs) expressed all the VLMC marker genes but was found exclusively in the enteric nervous system.”
§ Molecular Architecture of the Mouse Nervous System > Results > Vascular Cells and a Family of Broadly Distributed Mesothelial Fibroblasts
plain- Asserted: passes — The authors put it forward as true.
- Checkable: passes — It can be checked against evidence.
- Load-bearing: passes — The paper’s conclusions depend on it.
- Based: passes — The paper gives a reason why it holds.
It may state two separate claims as one.
A result the paper reports from its own data — it cites no other source for it, so there is none to check. The quote shows it is in the paper.
In the paper
“We found three types of pericytes and a single arterial vascular smooth muscle type (Acta2, Tagln; VSMCA).”
§ Molecular Architecture of the Mouse Nervous System > Results > Vascular Cells and a Family of Broadly Distributed Mesothelial Fibroblasts
plain- Asserted: passes — The authors put it forward as true.
- Checkable: passes — It can be checked against evidence.
- Load-bearing: passes — The paper’s conclusions depend on it.
- Based: passes — The paper gives a reason why it holds.
It may state two separate claims as one.
A result the paper reports from its own data — it cites no other source for it, so there is none to check. The quote shows it is in the paper.
In the paper
“We confirmed induction of the key transcription factor Sox10 in OPCs and of the myelin oligodendrocyte glycoprotein Mog in COPs.”
§ Molecular Architecture of the Mouse Nervous System > Results > Loss of Patterning in the Oligodendrocyte Lineage and Convergence to a Single Brain-wide Intermediate State
plaindirect- Asserted: passes — The authors put it forward as true.
- Checkable: passes — It can be checked against evidence.
- Load-bearing: unclear — It is unclear whether the paper’s conclusions depend on it.
- Based: passes — The paper gives a reason why it holds.
It may state two separate claims as one.
A result the paper reports from its own data — it cites no other source for it, so there is none to check. The quote shows it is in the paper.
In the paper
“Schwann cells are the myelinating glia of the PNS and differ from CNS oligodendrocytes by expressing myelin components Pmp22 and Mpz, the tetraspanin Cd9, and the extracellular matrix calcium-binding osteonectin Sparc and by not expressing the tight junction Cldn11, the myelin protein Mobp, Mog, and the iron chelator Trf genes (Figure S3C).”
§ Molecular Architecture of the Mouse Nervous System > Results > Neural-Crest-Derived Glia and Oligodendrocyte Progenitors
plain- Asserted: passes — The authors put it forward as true.
- Checkable: passes — It can be checked against evidence.
- Load-bearing: unclear — It is unclear whether the paper’s conclusions depend on it.
- Based: passes — The paper gives a reason why it holds.
It may state two separate claims as one.
A result the paper reports from its own data — it cites no other source for it, so there is none to check. The quote shows it is in the paper.
In the paper
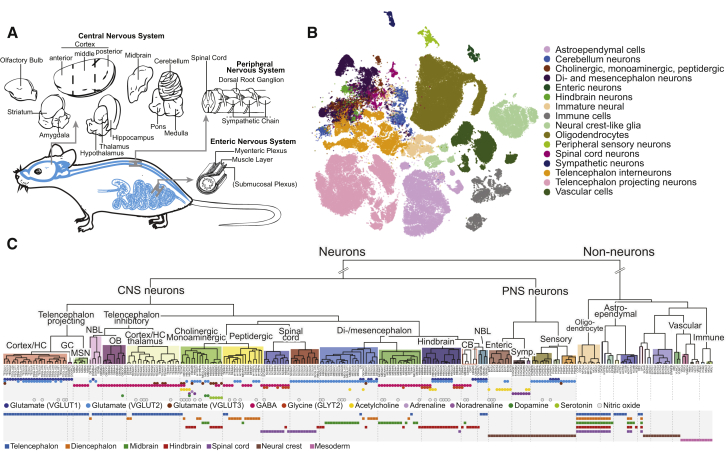
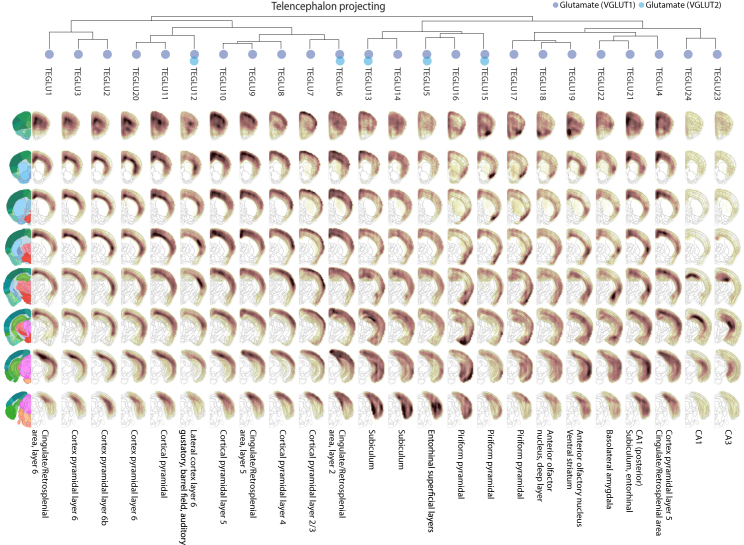
“The cerebral cortex was the most diverse, with 20 projection cell types, which were glutamatergic (all VGLUT1, but some additionally VGLUT2 or VGLUT3).”
§ Molecular Architecture of the Mouse Nervous System > Results > Central Nervous Systems Neurons
plain- Asserted: passes — The authors put it forward as true.
- Checkable: passes — It can be checked against evidence.
- Load-bearing: passes — The paper’s conclusions depend on it.
- Based: passes — The paper gives a reason why it holds.
It may state two separate claims as one.
A result the paper reports from its own data — it cites no other source for it, so there is none to check. The quote shows it is in the paper.
In the paper
“The thalamic inhibitory neurons expressed Meis2 and shared key transcription factors (e.g., Dlx1, Dlx2, Dlx5, Dlx6) with other cell types in this taxon, as well as with striatum MSNs, consistent with a common developmental origin in the ganglionic eminences.”
§ Molecular Architecture of the Mouse Nervous System > Results > Central Nervous Systems Neurons
plaincorrelational- Asserted: passes — The authors put it forward as true.
- Checkable: passes — It can be checked against evidence.
- Load-bearing: passes — The paper’s conclusions depend on it.
- Based: passes — The paper gives a reason why it holds.
It may state two separate claims as one.
A result the paper reports from its own data — it cites no other source for it, so there is none to check. The quote shows it is in the paper.
In the paper
“In the ventral midbrain, we identified two types of dopaminergic neurons, one cholinergic and four GABAergic.”
§ Molecular Architecture of the Mouse Nervous System > Results > Central Nervous Systems Neurons
plain- Asserted: passes — The authors put it forward as true.
- Checkable: passes — It can be checked against evidence.
- Load-bearing: unclear — It is unclear whether the paper’s conclusions depend on it.
- Based: passes — The paper gives a reason why it holds.
It may state two separate claims as one.
A result the paper reports from its own data — it cites no other source for it, so there is none to check. The quote shows it is in the paper.
In the paper
“We identified six cell types in the cerebellum, of which five are previously known: Purkinje cells, granular cells, granular layer interneurons, molecular layer interneurons, and granular cell neuroblasts.”
§ Molecular Architecture of the Mouse Nervous System > Results > Central Nervous Systems Neurons
plain- Asserted: passes — The authors put it forward as true.
- Checkable: passes — It can be checked against evidence.
- Load-bearing: unclear — It is unclear whether the paper’s conclusions depend on it.
- Based: passes — The paper gives a reason why it holds.
It may state two separate claims as one.
A result the paper reports from its own data — it cites no other source for it, so there is none to check. The quote shows it is in the paper.
In the paper
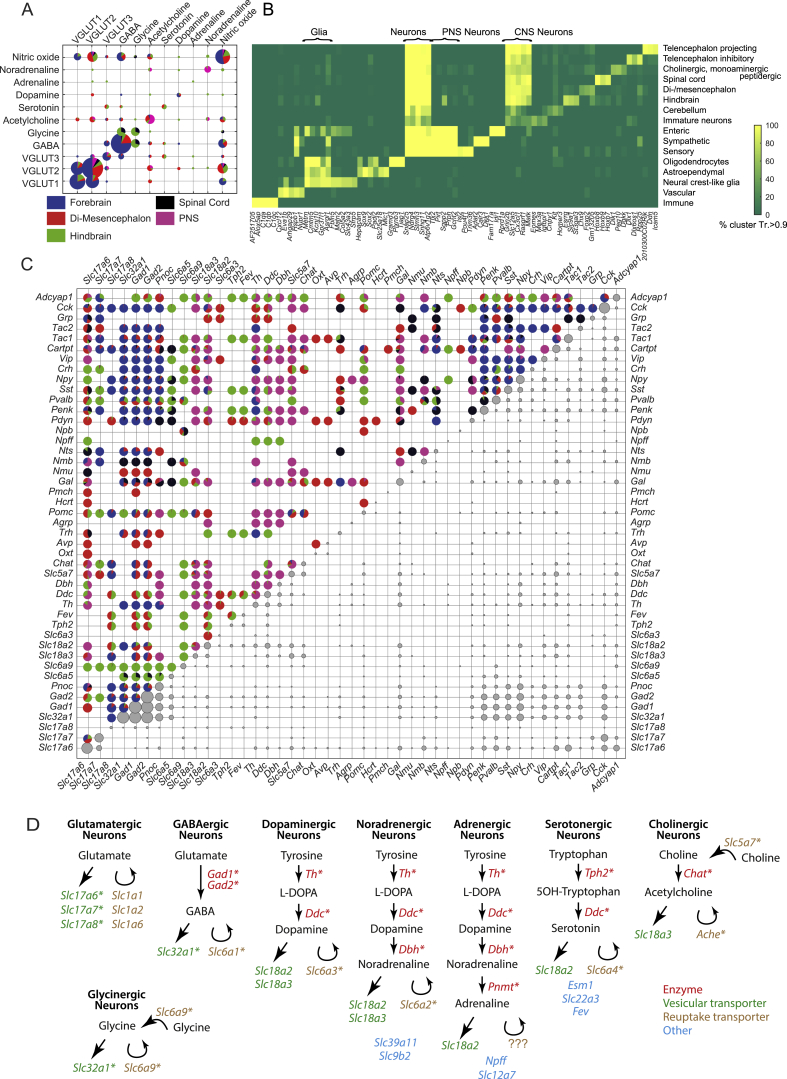
“The gaseous neurotransmitter nitric oxide (i.e., Nos1 expression) was detected throughout the nervous system and did not combine preferentially with (or avoid) any other neurotransmitter (Figures 1C and S6A).”
§ Molecular Architecture of the Mouse Nervous System > Results > Drivers of Neuronal and Glial Diversity
plain- Asserted: passes — The authors put it forward as true.
- Checkable: passes — It can be checked against evidence.
- Load-bearing: unclear — It is unclear whether the paper’s conclusions depend on it.
- Based: passes — The paper gives a reason why it holds.
It may state two separate claims as one.
A result the paper reports from its own data — it cites no other source for it, so there is none to check. The quote shows it is in the paper.
In the paper
“A sixth cell type (MEINH1), curiously, was found in the midbrain but was molecularly indistinguishable (Figure S1E) from cerebellum molecular layer interneurons (CBINH1).”
§ Molecular Architecture of the Mouse Nervous System > Results > Central Nervous Systems Neurons
plain- Asserted: passes — The authors put it forward as true.
- Checkable: passes — It can be checked against evidence.
- Load-bearing: passes — The paper’s conclusions depend on it.
- Based: passes — The paper gives a reason why it holds.
It may state two separate claims as one.
A result the paper reports from its own data — it cites no other source for it, so there is none to check. The quote shows it is in the paper.
In the paper
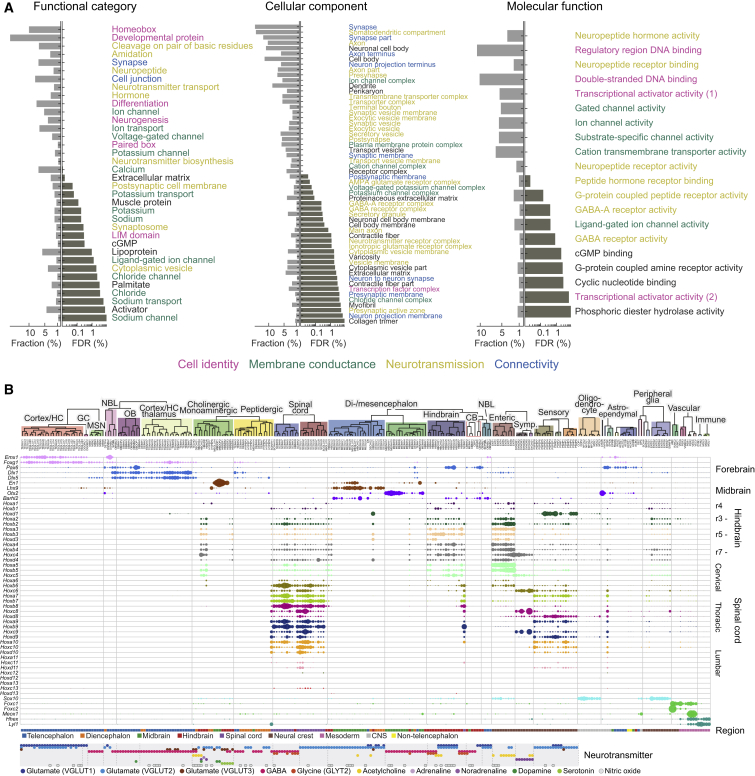
“For example, spinal cord cell types expressed Hoxa1 (rhombomere 1) through Hoxd10 (thoracic bordering on lumbar), with additional expression of lumbar Hox genes in some cell types.”
§ Molecular Architecture of the Mouse Nervous System > Results > Drivers of Neuronal and Glial Diversity
plain- Asserted: passes — The authors put it forward as true.
- Checkable: passes — It can be checked against evidence.
- Load-bearing: passes — The paper’s conclusions depend on it.
- Based: passes — The paper gives a reason why it holds.
It may state two separate claims as one.
A result the paper reports from its own data — it cites no other source for it, so there is none to check. The quote shows it is in the paper.
In the paper
“Acetylcholine occurred with most other neurotransmitters, whereas, for example, serotonin occurred only alone or with VGLUT3 or GABA.”
§ Molecular Architecture of the Mouse Nervous System > Results > Drivers of Neuronal and Glial Diversity
plaincorrelational- Asserted: passes — The authors put it forward as true.
- Checkable: passes — It can be checked against evidence.
- Load-bearing: unclear — It is unclear whether the paper’s conclusions depend on it.
- Based: passes — The paper gives a reason why it holds.
It may state two separate claims as one.
A result the paper reports from its own data — it cites no other source for it, so there is none to check. The quote shows it is in the paper.
In the paper
“In the hindbrain (15 types not including cerebellum), all inhibitory neurons were glycinergic (GLYT1, GLYT2, or both), and excitatory neurons were a mix of VGLUT1 and VGLUT2.”
§ Molecular Architecture of the Mouse Nervous System > Results > Central Nervous Systems Neurons
plain- Asserted: passes — The authors put it forward as true.
- Checkable: passes — It can be checked against evidence.
- Load-bearing: unclear — It is unclear whether the paper’s conclusions depend on it.
- Based: passes — The paper gives a reason why it holds.
It may state two separate claims as one.
A result the paper reports from its own data — it cites no other source for it, so there is none to check. The quote shows it is in the paper.
In the paper
“We further found 38 excitatory and inhibitory cell types of the diencephalon (thalamus and hypothalamus) and midbrain, forming a unified taxon.”
§ Molecular Architecture of the Mouse Nervous System > Results > Central Nervous Systems Neurons
plain- Asserted: passes — The authors put it forward as true.
- Checkable: passes — It can be checked against evidence.
- Load-bearing: passes — The paper’s conclusions depend on it.
- Based: passes — The paper gives a reason why it holds.
It may state two separate claims as one.
A result the paper reports from its own data — it cites no other source for it, so there is none to check. The quote shows it is in the paper.
In the paper
“While glutamate (VGLUT2) was the only neurotransmitter expressed in all compartments, GABA contributed the larger number of cell types and was mostly concentrated in the forebrain.”
§ Molecular Architecture of the Mouse Nervous System > Results > Drivers of Neuronal and Glial Diversity
plaincorrelational- Asserted: passes — The authors put it forward as true.
- Checkable: passes — It can be checked against evidence.
- Load-bearing: passes — The paper’s conclusions depend on it.
- Based: passes — The paper gives a reason why it holds.
It may state two separate claims as one.
A result the paper reports from its own data — it cites no other source for it, so there is none to check. The quote shows it is in the paper.
In the paper
“In contrast, the atypical vesicular glutamate transporter VGLUT3 was often co-expressed (Figures 1C and S6A) with cholinergic and monoaminergic neurotransmitters and more rarely alone or with the other VGLUTs or GABA.”
§ Molecular Architecture of the Mouse Nervous System > Results > Drivers of Neuronal and Glial Diversity
plaincorrelational- Asserted: passes — The authors put it forward as true.
- Checkable: passes — It can be checked against evidence.
- Load-bearing: passes — The paper’s conclusions depend on it.
- Based: passes — The paper gives a reason why it holds.
It may state two separate claims as one.
In the paper
“Finally, in the spinal cord, we identified 22 cell types, again split into inhibitory (GABAergic or glycinergic) and glutamatergic (VGLUT2) in good agreement with an independent experiment focused on the dorsal horn (Häring et al., 2018) (Table S2).”
§ Molecular Architecture of the Mouse Nervous System > Results > Central Nervous Systems Neurons
What the sources say
- Not checked — no full text of the sourcecites Häring et al., 2018 source
plain- Asserted: passes — The authors put it forward as true.
- Checkable: passes — It can be checked against evidence.
- Load-bearing: passes — The paper’s conclusions depend on it.
- Based: passes — The paper gives a reason why it holds.
It may state two separate claims as one.
A result the paper reports from its own data — it cites no other source for it, so there is none to check. The quote shows it is in the paper.
In the paper
“In addition, we found putative patch-specific D1-/D2-type neurons (expressing Tshz1) and matrix-specific D2 neurons (expressing Gng2), consistent with staining patterns of these genes in the Allen Mouse Brain Atlas.”
§ Molecular Architecture of the Mouse Nervous System > Results > Central Nervous Systems Neurons
hedgedcorrelational- Asserted: passes — The authors put it forward as true.
- Checkable: passes — It can be checked against evidence.
- Load-bearing: unclear — It is unclear whether the paper’s conclusions depend on it.
- Based: passes — The paper gives a reason why it holds.
It may state two separate claims as one.
A result the paper reports from its own data — it cites no other source for it, so there is none to check. The quote shows it is in the paper.
In the paper
“For example, somatostatin (Sst) is a canonical marker of inhibitory neuronal subtypes in the forebrain but was widely expressed in excitatory neurons in the spinal cord, hindbrain, and di-mesencephalon.”
§ Molecular Architecture of the Mouse Nervous System > Results > Drivers of Neuronal and Glial Diversity
plaincorrelational- Asserted: passes — The authors put it forward as true.
- Checkable: passes — It can be checked against evidence.
- Load-bearing: passes — The paper’s conclusions depend on it.
- Based: passes — The paper gives a reason why it holds.
It may state two separate claims as one.
A result the paper reports from its own data — it cites no other source for it, so there is none to check. The quote shows it is in the paper.
In the paper
“We found two D1-type MSNs (MSN1 and MSN4), one enriched in dorsal and one in ventral striatum, as well as two D2-type MSNs (MSN2 and MSN3), also dorsal and ventral, demonstrating a molecular distinction corresponding to the distinct circuits and functions of dorsal and ventral MSNs.”
§ Molecular Architecture of the Mouse Nervous System > Results > Central Nervous Systems Neurons
boostedcorrelational- Asserted: passes — The authors put it forward as true.
- Checkable: passes — It can be checked against evidence.
- Load-bearing: passes — The paper’s conclusions depend on it.
- Based: passes — The paper gives a reason why it holds.
It may state two separate claims as one.
A result the paper reports from its own data — it cites no other source for it, so there is none to check. The quote shows it is in the paper.
In the paper
“These types segregated nearly perfectly into glutamatergic (mostly VGLUT1) and GABAergic subsets but included two cholinergic types (of the red nucleus and the habenula).”
§ Molecular Architecture of the Mouse Nervous System > Results > Central Nervous Systems Neurons
plaincorrelational- Asserted: passes — The authors put it forward as true.
- Checkable: passes — It can be checked against evidence.
- Load-bearing: unclear — It is unclear whether the paper’s conclusions depend on it.
- Based: passes — The paper gives a reason why it holds.
It may state two separate claims as one.
A result the paper reports from its own data — it cites no other source for it, so there is none to check. The quote shows it is in the paper.
In the paper
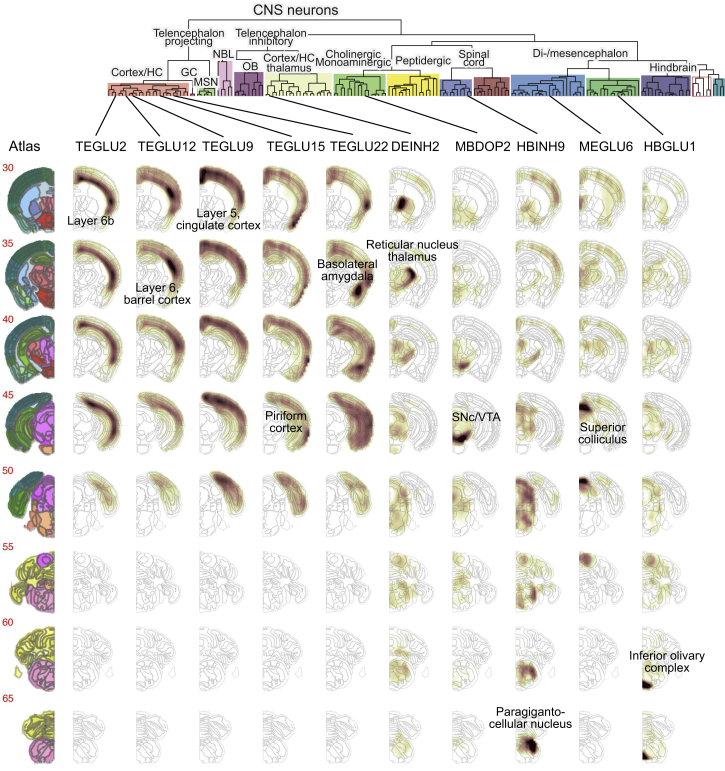
“Telencephalic inhibitory interneurons, including cells from the olfactory bulb, cortex, hippocampus, and thalamus, formed a separate taxon, with the olfactory cells as a distinct subgroup.”
§ Molecular Architecture of the Mouse Nervous System > Results > Central Nervous Systems Neurons
plaincorrelational- Asserted: passes — The authors put it forward as true.
- Checkable: passes — It can be checked against evidence.
- Load-bearing: passes — The paper’s conclusions depend on it.
- Based: passes — The paper gives a reason why it holds.
It may state two separate claims as one.
A result the paper reports from its own data — it cites no other source for it, so there is none to check. The quote shows it is in the paper.
In the paper
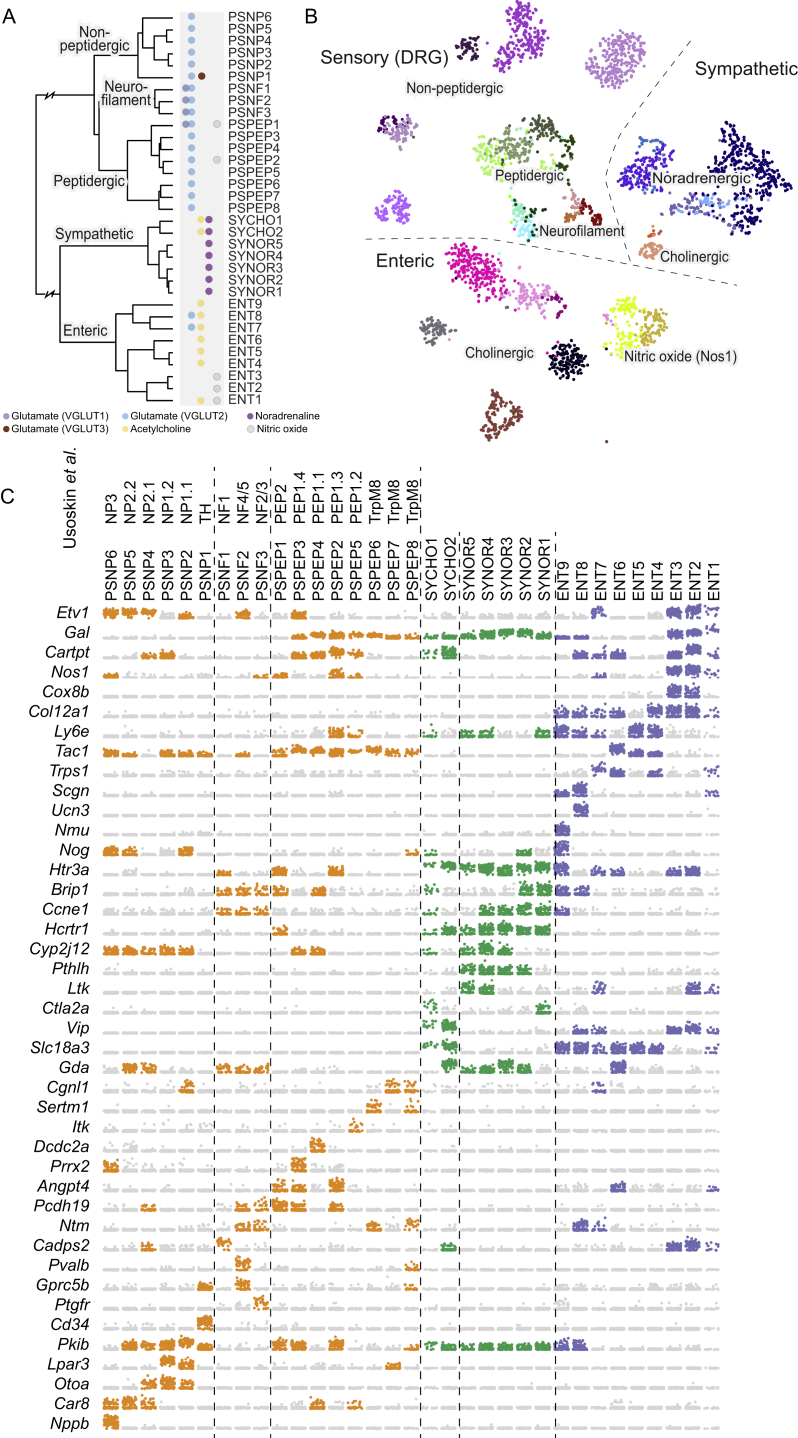
“Neurons of the PNS segregated molecularly from the CNS and formed distinct sensory, sympathetic, and enteric subdivisions (Figures 1C and S4).”
§ Molecular Architecture of the Mouse Nervous System > Results > Peripheral Nervous System
plaincorrelational- Asserted: passes — The authors put it forward as true.
- Checkable: passes — It can be checked against evidence.
- Load-bearing: passes — The paper’s conclusions depend on it.
- Based: passes — The paper gives a reason why it holds.
It may state two separate claims as one.
A result the paper reports from its own data — it cites no other source for it, so there is none to check. The quote shows it is in the paper.
In the paper
“The nitrergic ENT1-3 expressed the high-affinity choline transporter Slc5a7, but Chat was very low or undetected in those neurons.”
§ Molecular Architecture of the Mouse Nervous System > Results > Peripheral Nervous System
plain- Asserted: passes — The authors put it forward as true.
- Checkable: passes — It can be checked against evidence.
- Load-bearing: passes — The paper’s conclusions depend on it.
- Based: passes — The paper gives a reason why it holds.
It may state two separate claims as one.
A result the paper reports from its own data — it cites no other source for it, so there is none to check. The quote shows it is in the paper.
In the paper
“A single taxon collected nearly all cholinergic, monoaminergic neurons (which we identified based on expression of the necessary biosynthesis enzymes and vesicular and reuptake transporters; Figure S6C and STAR Methods) from the whole brain, as well as peptidergic neurons mainly of the hypothalamus.”
§ Molecular Architecture of the Mouse Nervous System > Results > Central Nervous Systems Neurons
plaincorrelational- Asserted: passes — The authors put it forward as true.
- Checkable: passes — It can be checked against evidence.
- Load-bearing: passes — The paper’s conclusions depend on it.
- Based: passes — The paper gives a reason why it holds.
It may state two separate claims as one.
The paper states this without a source or data behind it here, so there is nothing to check it against. The quote shows it is in the paper.
In the paper
“On the other hand, they still retained their CNS neuron character and did not intermingle with cholinergic or monoaminergic neurons of the PNS.”
§ Molecular Architecture of the Mouse Nervous System > Results > Central Nervous Systems Neurons
plain- Asserted: passes — The authors put it forward as true.
- Checkable: passes — It can be checked against evidence.
- Load-bearing: unclear — It is unclear whether the paper’s conclusions depend on it.
- Based: passes — The paper gives a reason why it holds.
It may state two separate claims as one.
A result the paper reports from its own data — it cites no other source for it, so there is none to check. The quote shows it is in the paper.
In the paper
“Glutamatergic neurons in the telencephalon all used VGLUT1, with some additionally using VGLUT2, whereas in more caudal regions, VGLUT2 dominated.”
§ Molecular Architecture of the Mouse Nervous System > Results > Drivers of Neuronal and Glial Diversity
plaincorrelational- Asserted: passes — The authors put it forward as true.
- Checkable: passes — It can be checked against evidence.
- Load-bearing: passes — The paper’s conclusions depend on it.
- Based: passes — The paper gives a reason why it holds.
It may state two separate claims as one.
A result the paper reports from its own data — it cites no other source for it, so there is none to check. The quote shows it is in the paper.
In the paper
“For example, pyramidal neurons of the piriform and entorhinal cortex, as well as the subiculum, were molecularly closely related (shown by their forming a separate subtree of the dendrogram), as well as spatially aligned.”
§ Molecular Architecture of the Mouse Nervous System > Results > Spatial Distributions Reflect Molecular Diversity
plaincorrelational- Asserted: passes — The authors put it forward as true.
- Checkable: passes — It can be checked against evidence.
- Load-bearing: unclear — It is unclear whether the paper’s conclusions depend on it.
- Based: passes — The paper gives a reason why it holds.
It may state two separate claims as one.
A result the paper reports from its own data — it cites no other source for it, so there is none to check. The quote shows it is in the paper.
In the paper
“Despite our efforts, at level 3 there remained still some clusters that were suspected doublets, as well as over-split clusters that lacked clearly defining gene expression differences.”
§ Molecular Architecture of the Mouse Nervous System > STAR★Methods > Quantification and Statistical Analysis
plain- Asserted: passes — The authors put it forward as true.
- Checkable: passes — It can be checked against evidence.
- Load-bearing: fails — The paper’s conclusions may not depend on it.
- Based: passes — The paper gives a reason why it holds.
Probably not a substantial claim. The paper’s conclusions may not depend on it. It may state two separate claims as one.
A result the paper reports from its own data — it cites no other source for it, so there is none to check. The quote shows it is in the paper.
In the paper
“Second, the olfactory bulb inhibitory neurons were placed next to the MSNs.”
§ Molecular Architecture of the Mouse Nervous System > STAR★Methods > Quantification and Statistical Analysis
plaincorrelational- Asserted: passes — The authors put it forward as true.
- Checkable: passes — It can be checked against evidence.
- Load-bearing: fails — The paper’s conclusions may not depend on it.
- Based: passes — The paper gives a reason why it holds.
Probably not a substantial claim. The paper’s conclusions may not depend on it.
A result the paper reports from its own data — it cites no other source for it, so there is none to check. The quote shows it is in the paper.
In the paper
“For example, the forebrain patterning gene Foxg1 was found in all forebrain neurons, as well as in telencephalon-specific astrocytes.”
§ Molecular Architecture of the Mouse Nervous System > Results > Drivers of Neuronal and Glial Diversity
plaincorrelational- Asserted: passes — The authors put it forward as true.
- Checkable: passes — It can be checked against evidence.
- Load-bearing: unclear — It is unclear whether the paper’s conclusions depend on it.
- Based: passes — The paper gives a reason why it holds.
It may state two separate claims as one.
A result the paper reports from its own data — it cites no other source for it, so there is none to check. The quote shows it is in the paper.
In the paper
“Dropping non-significant principal components (Kolmogorov-Smirnov test, p < 0.05) reduced the space to a few tens of dimensions (typically about forty).”
§ Molecular Architecture of the Mouse Nervous System > STAR★Methods > Quantification and Statistical Analysis
plaindirect- Asserted: passes — The authors put it forward as true.
- Checkable: passes — It can be checked against evidence.
- Load-bearing: passes — The paper’s conclusions depend on it.
- Based: passes — The paper gives a reason why it holds.
Probably not a substantial claim.
A result the paper reports from its own data — it cites no other source for it, so there is none to check. The quote shows it is in the paper.
In the paper
“Clusters CBPC, HYPEP3 and SCINH2 showed dual presence of GABA (inhibitory) and glutamate (excitatory) in the same cluster”
§ Molecular Architecture of the Mouse Nervous System > STAR★Methods > Quantification and Statistical Analysis
plaincorrelational- Asserted: passes — The authors put it forward as true.
- Checkable: passes — It can be checked against evidence.
- Load-bearing: fails — The paper’s conclusions may not depend on it.
- Based: passes — The paper gives a reason why it holds.
Probably not a substantial claim. The paper’s conclusions may not depend on it.
The paper states this without a source or data behind it here, so there is nothing to check it against. The quote shows it is in the paper.
In the paper
“The territories defining these gene expression domains corresponded closely to those marked out by embryonic morphogens, and spatial differences in adult expression patterns correlated with persistent expression of developmental transcription factors.”
§ Molecular Architecture of the Mouse Nervous System > Discussion
plaincorrelational- Asserted: passes — The authors put it forward as true.
- Checkable: passes — It can be checked against evidence.
- Load-bearing: passes — The paper’s conclusions depend on it.
- Based: passes — The paper gives a reason why it holds.
It may state two separate claims as one.
A result the paper reports from its own data — it cites no other source for it, so there is none to check. The quote shows it is in the paper.
In the paper
“This trend was strongest among neurons, astrocytes, and ependymal cells; by contrast, oligodendrocytes, vascular cells, and immune cells exhibited similar gene expression patterns across brain regions.”
§ Molecular Architecture of the Mouse Nervous System > Discussion
plaincorrelational- Asserted: passes — The authors put it forward as true.
- Checkable: passes — It can be checked against evidence.
- Load-bearing: passes — The paper’s conclusions depend on it.
- Based: passes — The paper gives a reason why it holds.
It may state two separate claims as one.
A result the paper reports from its own data — it cites no other source for it, so there is none to check. The quote shows it is in the paper.
In the paper
“but manual inspection indicated GABA.”
§ Molecular Architecture of the Mouse Nervous System > STAR★Methods > Quantification and Statistical Analysis
hedged- Asserted: passes — The authors put it forward as true.
- Checkable: passes — It can be checked against evidence.
- Load-bearing: passes — The paper’s conclusions depend on it.
- Based: passes — The paper gives a reason why it holds.
The quote only partly states this claim.
A result the paper reports from its own data — it cites no other source for it, so there is none to check. The quote shows it is in the paper.
In the paper
“Based on the more stringent criterion (2) more than 50% had probability of 1 and about 85% greater than 0.5.”
§ Molecular Architecture of the Mouse Nervous System > STAR★Methods > Quantification and Statistical Analysis
plain- Asserted: passes — The authors put it forward as true.
- Checkable: passes — It can be checked against evidence.
- Load-bearing: passes — The paper’s conclusions depend on it.
- Based: passes — The paper gives a reason why it holds.
It may state two separate claims as one.
The paper states this without a source or data behind it here, so there is nothing to check it against. The quote shows it is in the paper.
In the paper
“For example, neurons share an extensive gene program involving synaptic, cytoskeletal, and ion channel genes, while oligodendrocytes express gene programs required for generating myelin.”
§ Molecular Architecture of the Mouse Nervous System > Discussion
plain- Asserted: passes — The authors put it forward as true.
- Checkable: passes — It can be checked against evidence.
- Load-bearing: passes — The paper’s conclusions depend on it.
- Based: passes — The paper gives a reason why it holds.
It may state two separate claims as one.
The paper states this without a source or data behind it here, so there is nothing to check it against. The quote shows it is in the paper.
In the paper
“Specificity tends to increase as the gene set becomes more selective, but then decrease as it becomes less robust.”
§ Molecular Architecture of the Mouse Nervous System > STAR★Methods > Quantification and Statistical Analysis
hedgeddirect- Asserted: passes — The authors put it forward as true.
- Checkable: passes — It can be checked against evidence.
- Load-bearing: unclear — It is unclear whether the paper’s conclusions depend on it.
- Based: passes — The paper gives a reason why it holds.
It may state two separate claims as one.
A result the paper reports from its own data — it cites no other source for it, so there is none to check. The quote shows it is in the paper.
In the paper
“More than 65% of the 264 branches had probability of 1 and 94% had probability greater than 0.5 based on criterion (1).”
§ Molecular Architecture of the Mouse Nervous System > STAR★Methods > Quantification and Statistical Analysis
plain- Asserted: passes — The authors put it forward as true.
- Checkable: passes — It can be checked against evidence.
- Load-bearing: passes — The paper’s conclusions depend on it.
- Based: passes — The paper gives a reason why it holds.
It may state two separate claims as one.
A result the paper reports from its own data — it cites no other source for it, so there is none to check. The quote shows it is in the paper.
In the paper
“Generally, robustness drops as more genes are added, while selectivity increases.”
§ Molecular Architecture of the Mouse Nervous System > STAR★Methods > Quantification and Statistical Analysis
plaindirect- Asserted: passes — The authors put it forward as true.
- Checkable: passes — It can be checked against evidence.
- Load-bearing: unclear — It is unclear whether the paper’s conclusions depend on it.
- Based: passes — The paper gives a reason why it holds.
It may state two separate claims as one.
A result the paper reports from its own data — it cites no other source for it, so there is none to check. The quote shows it is in the paper.
In the paper
“Some clusters were also clearly derived from doublets, expressing contradictory markers e.g., from neurons and vascular cells.”
§ Molecular Architecture of the Mouse Nervous System > STAR★Methods > Quantification and Statistical Analysis
boosteddirect- Asserted: passes — The authors put it forward as true.
- Checkable: passes — It can be checked against evidence.
- Load-bearing: fails — The paper’s conclusions may not depend on it.
- Based: passes — The paper gives a reason why it holds.
Probably not a substantial claim. The paper’s conclusions may not depend on it.
A result the paper reports from its own data — it cites no other source for it, so there is none to check. The quote shows it is in the paper.
In the paper
“Dorsoventral patterning was also preserved: the dorsal gene Emx1 was expressed in cortical, hippocampal, and striatal projection neurons, whereas ventral Dlx1 and Dlx5 were found mainly in inhibitory neurons of the same tissues.”
§ Molecular Architecture of the Mouse Nervous System > Results > Drivers of Neuronal and Glial Diversity
plaincorrelational- Asserted: passes — The authors put it forward as true.
- Checkable: passes — It can be checked against evidence.
- Load-bearing: passes — The paper’s conclusions depend on it.
- Based: passes — The paper gives a reason why it holds.
It may state two separate claims as one.
A result the paper reports from its own data — it cites no other source for it, so there is none to check. The quote shows it is in the paper.
In the paper
“The result was a more accurate projection of the graph itself, with more compact and well-defined neighborhoods.”
§ Molecular Architecture of the Mouse Nervous System > STAR★Methods > Quantification and Statistical Analysis
plaindirect- Asserted: passes — The authors put it forward as true.
- Checkable: passes — It can be checked against evidence.
- Load-bearing: passes — The paper’s conclusions depend on it.
- Based: passes — The paper gives a reason why it holds.
It may state two separate claims as one.
A conclusion the paper draws from its own results — it cites no other source for it, so there is none to check. The quote shows it is in the paper.
In the paper
“oligodendrocytes showed a loss of regional identity followed by a secondary diversification”
§ Molecular Architecture of the Mouse Nervous System > Abstract
plaindirect- Asserted: passes — The authors put it forward as true.
- Checkable: passes — It can be checked against evidence.
- Load-bearing: passes — The paper’s conclusions depend on it.
- Based: passes — The paper gives a reason why it holds.
It may state two separate claims as one.
A conclusion the paper draws from its own results — it cites no other source for it, so there is none to check. The quote shows it is in the paper.
In the paper
“This represents a highly conservative clustering, and significant heterogeneity likely remains within many of the reported clusters.”
§ Molecular Architecture of the Mouse Nervous System > Results > A Molecular Survey of the Mouse Nervous System
hedged- Asserted: passes — The authors put it forward as true.
- Checkable: passes — It can be checked against evidence.
- Load-bearing: unclear — It is unclear whether the paper’s conclusions depend on it.
- Based: passes — The paper gives a reason why it holds.
It may state two separate claims as one.
In the paper
“The adult brain is organized into dorsoventral and rostrocaudal compartments, which result from patterning of the early neural tube (Rubenstein and Rakic, 2013).”
§ Molecular Architecture of the Mouse Nervous System > Introduction
What the sources say
- Not matchedcites Rubenstein and Rakic, 2013
Couldn’t be matched to a paper in Crossref, so it can’t be checked.
plaindirect- Asserted: passes — The authors put it forward as true.
- Checkable: passes — It can be checked against evidence.
- Load-bearing: fails — The paper’s conclusions may not depend on it.
- Based: passes — The paper gives a reason why it holds.
Probably not a substantial claim. The paper’s conclusions may not depend on it.
- Not matched
In the paper
“the modern understanding of astrocyte diversity essentially stands as it stood in 1900: the major types of mature astrocytes are believed to be the Müller glia of the retina, the Bergmann glia of the cerebellum, and the widely distributed protoplasmic and fibrous astrocytes (Ben Haim and Rowitch, 2017).”
§ Molecular Architecture of the Mouse Nervous System > Results > Astroependymal Cells Are Diverse and Spatially Patterned
What the sources say
- Not checked — no full text of the sourcecites Ben Haim and Rowitch, 2017 source
plain- Asserted: passes — The authors put it forward as true.
- Checkable: passes — It can be checked against evidence.
- Load-bearing: passes — The paper’s conclusions depend on it.
- Based: passes — The paper gives a reason why it holds.
Probably not a substantial claim.
A conclusion the paper draws from its own results — it cites no other source for it, so there is none to check. The quote shows it is in the paper.
In the paper
“Thus, an initially diverse population of neural progenitors converges on a single intermediate transcriptional state (OPC or COP) and is then subject to secondary diversification as they mature (Figure 4E).”
§ Molecular Architecture of the Mouse Nervous System > Results > Loss of Patterning in the Oligodendrocyte Lineage and Convergence to a Single Brain-wide Intermediate State
plaindirect- Asserted: passes — The authors put it forward as true.
- Checkable: passes — It can be checked against evidence.
- Load-bearing: passes — The paper’s conclusions depend on it.
- Based: passes — The paper gives a reason why it holds.
It may state two separate claims as one.
A conclusion the paper draws from its own results — it cites no other source for it, so there is none to check. The quote shows it is in the paper.
In the paper
“This may explain the need for distinct types of astrocytes in glycine-rich and glycine-poor regions of the brain.”
§ Molecular Architecture of the Mouse Nervous System > Results > Astroependymal Cells Are Diverse and Spatially Patterned
hedgedconditional- Asserted: passes — The authors put it forward as true.
- Checkable: passes — It can be checked against evidence.
- Load-bearing: fails — The paper’s conclusions may not depend on it.
- Based: passes — The paper gives a reason why it holds.
Probably not a substantial claim. The paper’s conclusions may not depend on it.
A conclusion the paper draws from its own results — it cites no other source for it, so there is none to check. The quote shows it is in the paper.
In the paper
“At such low levels of expression, it is difficult to rule out a contamination from adjacent neurons, and thus, it is possible that they were not expressed at all in the oligodendrocyte lineage.”
§ Molecular Architecture of the Mouse Nervous System > Results > Loss of Patterning in the Oligodendrocyte Lineage and Convergence to a Single Brain-wide Intermediate State
hedged- Asserted: passes — The authors put it forward as true.
- Checkable: passes — It can be checked against evidence.
- Load-bearing: unclear — It is unclear whether the paper’s conclusions depend on it.
- Based: passes — The paper gives a reason why it holds.
It may state two separate claims as one.
A conclusion the paper draws from its own results — it cites no other source for it, so there is none to check. The quote shows it is in the paper.
In the paper
“We conclude that OPCs (and, to a lesser extent, COPs and NFOLs) may retain a memory of their anteroposterior position in the form of expression of region-specific transcription factors but that this does not translate into clearly distinct region-specific cell types.”
§ Molecular Architecture of the Mouse Nervous System > Results > Loss of Patterning in the Oligodendrocyte Lineage and Convergence to a Single Brain-wide Intermediate State
hedgedconditional- Asserted: passes — The authors put it forward as true.
- Checkable: passes — It can be checked against evidence.
- Load-bearing: passes — The paper’s conclusions depend on it.
- Based: passes — The paper gives a reason why it holds.
It may state two separate claims as one.
What the paper did — it cites no source for this, so there is none to check. The quote shows it is in the paper.
In the paper
“We validated the identity and distribution of astrocyte cell types using RNA FISH (RNAscope), which was consistent with the Allen Mouse Brain Atlas (Figures 3F and S2).”
§ Molecular Architecture of the Mouse Nervous System > Results > Astroependymal Cells Are Diverse and Spatially Patterned
plaincorrelational- Asserted: passes — The authors put it forward as true.
- Checkable: passes — It can be checked against evidence.
- Load-bearing: passes — The paper’s conclusions depend on it.
- Based: passes — The paper gives a reason why it holds.
It may state two separate claims as one.
A conclusion the paper draws from its own results — it cites no other source for it, so there is none to check. The quote shows it is in the paper.
In the paper
“However, Eomes and Igfbpl1 overlapped in some populations (DGNBL1 and to some extent SZNBL), indicating that these categories of neuroblasts may represent sequential stages of neuronal maturation rather than divergent cell types.”
§ Molecular Architecture of the Mouse Nervous System > Results > Postnatal Neurogenesis in the Central Nervous System
hedgedconditional- Asserted: passes — The authors put it forward as true.
- Checkable: passes — It can be checked against evidence.
- Load-bearing: passes — The paper’s conclusions depend on it.
- Based: passes — The paper gives a reason why it holds.
It may state two separate claims as one.
A conclusion the paper draws from its own results — it cites no other source for it, so there is none to check. The quote shows it is in the paper.
In the paper
“This demonstrates that VLMC-like cells are present throughout the body and are not brain specific.”
§ Molecular Architecture of the Mouse Nervous System > Results > Vascular Cells and a Family of Broadly Distributed Mesothelial Fibroblasts
boostedSingle case- Asserted: passes — The authors put it forward as true.
- Checkable: passes — It can be checked against evidence.
- Load-bearing: passes — The paper’s conclusions depend on it.
- Based: passes — The paper gives a reason why it holds.
It may state two separate claims as one.
A conclusion the paper draws from its own results — it cites no other source for it, so there is none to check. The quote shows it is in the paper.
In the paper
“These findings point to the specific functions that differ between neuronal types (connectivity, electrophysiology, and neurotransmission) and to the underlying regulatory machinery (transcription factors).”
§ Molecular Architecture of the Mouse Nervous System > Results > Drivers of Neuronal and Glial Diversity
plaincorrelational- Asserted: passes — The authors put it forward as true.
- Checkable: passes — It can be checked against evidence.
- Load-bearing: passes — The paper’s conclusions depend on it.
- Based: passes — The paper gives a reason why it holds.
It may state two separate claims as one.
A conclusion the paper draws from its own results — it cites no other source for it, so there is none to check. The quote shows it is in the paper.
In the paper
“These results demonstrate that neuropeptides, neurotransmitters, calcium-binding proteins, and other neuronal molecules are used in a highly modular fashion and serve different functions in different contexts.”
§ Molecular Architecture of the Mouse Nervous System > Results > Drivers of Neuronal and Glial Diversity
boostedcorrelational- Asserted: passes — The authors put it forward as true.
- Checkable: passes — It can be checked against evidence.
- Load-bearing: passes — The paper’s conclusions depend on it.
- Based: passes — The paper gives a reason why it holds.
It may state two separate claims as one.
A conclusion the paper draws from its own results — it cites no other source for it, so there is none to check. The quote shows it is in the paper.
In the paper
“Notably, this also corresponds with their order of development during embryogenesis.”
§ Molecular Architecture of the Mouse Nervous System > Results > Spatial Distributions Reflect Molecular Diversity
plaincorrelational- Asserted: passes — The authors put it forward as true.
- Checkable: passes — It can be checked against evidence.
- Load-bearing: fails — The paper’s conclusions may not depend on it.
- Based: fails — The paper may give no reason why it holds.
Probably not a substantial claim. The paper’s conclusions may not depend on it. The paper may give no reason why it holds.
In the paper
“Olfactory ensheathing cells are neural-crest-derived (Barraud et al., 2010) cells that ensheath axons of the olfactory sensory neurons but do not form myelin.”
§ Molecular Architecture of the Mouse Nervous System > Results > Neural-Crest-Derived Glia and Oligodendrocyte Progenitors
What the sources say
- Not checked — no full text of the sourcecites Barraud et al., 2010 source
plain- Asserted: passes — The authors put it forward as true.
- Checkable: passes — It can be checked against evidence.
- Load-bearing: unclear — It is unclear whether the paper’s conclusions depend on it.
- Based: passes — The paper gives a reason why it holds.
It may state two separate claims as one.
None of the sources cited for this claim have been checked yet.
In the paper
“Based on marker gene expression, morphology, location, and projection targets, approximately ten cell types have been previously described (Furness et al., 2014, Qu et al., 2008) in the myenteric plexus of the mouse.”
§ Molecular Architecture of the Mouse Nervous System > Results > Peripheral Nervous System
What the sources say
- Not checked — no full text of the sourcecites Furness et al., 2014 source
- Not matchedcites Qu et al., 2008
Couldn’t be matched to a paper in Crossref, so it can’t be checked.
plain- Asserted: passes — The authors put it forward as true.
- Checkable: passes — It can be checked against evidence.
- Load-bearing: fails — The paper’s conclusions may not depend on it.
- Based: passes — The paper gives a reason why it holds.
Probably not a substantial claim. The paper’s conclusions may not depend on it.
What the paper did — it cites no source for this, so there is none to check. The quote shows it is in the paper.
In the paper
“The precision and recall for neurons was 93% and 99%, respectively. That is, 99% of all neurons were classified correctly, and 93% of all cells classified as neurons were actually neurons.”
§ Molecular Architecture of the Mouse Nervous System > STAR★Methods > Quantification and Statistical Analysis
plain- Asserted: passes — The authors put it forward as true.
- Checkable: passes — It can be checked against evidence.
- Load-bearing: passes — The paper’s conclusions depend on it.
- Based: passes — The paper gives a reason why it holds.
It may state two separate claims as one.
A conclusion the paper draws from its own results — it cites no other source for it, so there is none to check. The quote shows it is in the paper.
In the paper
“Note that PEP is applied individually to each gene (hence, ‘local FDR’) and the actual genome-wide FDR will be strictly equal to or lower than PEP.”
§ Molecular Architecture of the Mouse Nervous System > STAR★Methods > Quantification and Statistical Analysis
plain- Asserted: passes — The authors put it forward as true.
- Checkable: passes — It can be checked against evidence.
- Load-bearing: fails — The paper’s conclusions may not depend on it.
- Based: passes — The paper gives a reason why it holds.
Probably not a substantial claim. The paper’s conclusions may not depend on it.
- The authors state this as an assumption: The trinarization model applies to a cluster of cells representing a putatively homogeneous population.
What the paper did — it cites no source for this, so there is none to check. The quote shows it is in the paper.
In the paper
“First, there were technical and experimental limitations as detailed above, including doublets, sex-specific gene expression, and low-quality cells.”
§ Molecular Architecture of the Mouse Nervous System > Discussion
plain- Asserted: passes — The authors put it forward as true.
- Checkable: passes — It can be checked against evidence.
- Load-bearing: unclear — It is unclear whether the paper’s conclusions depend on it.
- Based: passes — The paper gives a reason why it holds.
It may state two separate claims as one.
A conclusion the paper draws from its own results — it cites no other source for it, so there is none to check. The quote shows it is in the paper.
In the paper
“Third, a secondary diversification, more graded and less region specific, results from interaction with the local environment and likely reflects inducible gene regulatory networks that respond in graded and transient fashion to local molecular cues.”
§ Molecular Architecture of the Mouse Nervous System > Discussion
hedgedconditional- Asserted: passes — The authors put it forward as true.
- Checkable: passes — It can be checked against evidence.
- Load-bearing: passes — The paper’s conclusions depend on it.
- Based: passes — The paper gives a reason why it holds.
It may state two separate claims as one.
What the paper did — it cites no source for this, so there is none to check. The quote shows it is in the paper.
In the paper
“Fourth, we have performed a very conservative clustering, designed to reveal clearly distinct major cell types, but did not analyze the substantial remaining heterogeneity within clusters.”
§ Molecular Architecture of the Mouse Nervous System > Discussion
plain- Asserted: passes — The authors put it forward as true.
- Checkable: passes — It can be checked against evidence.
- Load-bearing: fails — The paper’s conclusions may not depend on it.
- Based: passes — The paper gives a reason why it holds.
Probably not a substantial claim. The paper’s conclusions may not depend on it. It may state two separate claims as one.
What the paper did — it cites no source for this, so there is none to check. The quote shows it is in the paper.
In the paper
“Finally, we have described only molecular cell types, but the task of linking molecular properties to functional, anatomical, morphological, and electrophysiological properties remains.”
§ Molecular Architecture of the Mouse Nervous System > Discussion
plain- Asserted: passes — The authors put it forward as true.
- Checkable: fails — It may be too vague to check against evidence.
- Load-bearing: fails — The paper’s conclusions may not depend on it.
- Based: passes — The paper gives a reason why it holds.
Probably not a substantial claim. It may be too vague to check against evidence. The paper’s conclusions may not depend on it. It may state two separate claims as one.
A conclusion the paper draws from its own results — it cites no other source for it, so there is none to check. The quote shows it is in the paper.
In the paper
“presumably because they shared most gene expression with their non-cycling counterparts”
§ Molecular Architecture of the Mouse Nervous System > STAR★Methods > Quantification and Statistical Analysis
hedgedconditional- Asserted: passes — The authors put it forward as true.
- Checkable: passes — It can be checked against evidence.
- Load-bearing: passes — The paper’s conclusions depend on it.
- Based: passes — The paper gives a reason why it holds.
Probably not a substantial claim. It may state two separate claims as one.
A conclusion the paper draws from its own results — it cites no other source for it, so there is none to check. The quote shows it is in the paper.
In the paper
“Multiple levels of hierarchical subdivision exist within these classes; for example, within neurons, neurotransmitter phenotype showed a modular and highly regulated pattern of expression.”
§ Molecular Architecture of the Mouse Nervous System > Discussion
plain- Asserted: passes — The authors put it forward as true.
- Checkable: passes — It can be checked against evidence.
- Load-bearing: passes — The paper’s conclusions depend on it.
- Based: passes — The paper gives a reason why it holds.
It may state two separate claims as one.
A conclusion the paper draws from its own results — it cites no other source for it, so there is none to check. The quote shows it is in the paper.
In the paper
“In order to suppress batch effects (mainly due to ambient oligodenderocyte RNA in hindbrain and spinal cord samples), we collected the unique set of genes pan-enriched in the non-neuronal clusters”
§ Molecular Architecture of the Mouse Nervous System > STAR★Methods > Quantification and Statistical Analysis
plaindirect- Asserted: passes — The authors put it forward as true.
- Checkable: passes — It can be checked against evidence.
- Load-bearing: passes — The paper’s conclusions depend on it.
- Based: fails — The paper may give no reason why it holds.
Probably not a substantial claim. The paper may give no reason why it holds.
A conclusion the paper draws from its own results — it cites no other source for it, so there is none to check. The quote shows it is in the paper.
In the paper
“First, enteric neurons clustered together with the enteric glia probably due to fact that enteric glia were extremely abundant in the tissue.”
§ Molecular Architecture of the Mouse Nervous System > STAR★Methods > Quantification and Statistical Analysis
hedgedconditional- Asserted: passes — The authors put it forward as true.
- Checkable: passes — It can be checked against evidence.
- Load-bearing: unclear — It is unclear whether the paper’s conclusions depend on it.
- Based: passes — The paper gives a reason why it holds.
It may state two separate claims as one.
A conclusion the paper draws from its own results — it cites no other source for it, so there is none to check. The quote shows it is in the paper.
In the paper
“This suggests that transcription factor networks induced in early development by local morphogens result in heritable regulatory states, which in turn are relayed into the diversification of terminal neuronal and astrocytic types specific to each brain region.”
§ Molecular Architecture of the Mouse Nervous System > Discussion
hedgeddirect- Asserted: passes — The authors put it forward as true.
- Checkable: passes — It can be checked against evidence.
- Load-bearing: passes — The paper’s conclusions depend on it.
- Based: passes — The paper gives a reason why it holds.
It may state two separate claims as one.
A conclusion the paper draws from its own results — it cites no other source for it, so there is none to check. The quote shows it is in the paper.
In the paper
“Third, some cell types may have been lost to differential survival or size selection biases (for example, Purkinje cells were likely undersampled here due to their size).”
§ Molecular Architecture of the Mouse Nervous System > Discussion
hedgedconditional- Asserted: passes — The authors put it forward as true.
- Checkable: passes — It can be checked against evidence.
- Load-bearing: fails — The paper’s conclusions may not depend on it.
- Based: passes — The paper gives a reason why it holds.
Probably not a substantial claim. The paper’s conclusions may not depend on it.
What the paper did — it cites no source for this, so there is none to check. The quote shows it is in the paper.
In the paper
“Similarly, we used relatively shallow sequencing, and deeper sequencing using more sensitive RNA-seq methods is likely to resolve more subtypes.”
§ Molecular Architecture of the Mouse Nervous System > Discussion
plain- Asserted: passes — The authors put it forward as true.
- Checkable: passes — It can be checked against evidence.
- Load-bearing: fails — The paper’s conclusions may not depend on it.
- Based: passes — The paper gives a reason why it holds.
Probably not a substantial claim. The paper’s conclusions may not depend on it.
A conclusion the paper draws from its own results — it cites no other source for it, so there is none to check. The quote shows it is in the paper.
In the paper
“The resulting dendrogram was not fundamentally changed from Figure 1C, but included a few key differences which we believe are technical artifacts.”
§ Molecular Architecture of the Mouse Nervous System > STAR★Methods > Quantification and Statistical Analysis
hedged- Asserted: passes — The authors put it forward as true.
- Checkable: passes — It can be checked against evidence.
- Load-bearing: unclear — It is unclear whether the paper’s conclusions depend on it.
- Based: passes — The paper gives a reason why it holds.
It may state two separate claims as one.
A conclusion the paper draws from its own results — it cites no other source for it, so there is none to check. The quote shows it is in the paper.
In the paper
“The fact that oligodendrocytes did not show similar spatial patterns—despite being derived from the same initially patterned neural tube as neurons and astocytes—reveals a loss of regional patterning in the oligodendrocyte lineage, presumably because region-specific patterning is transient and not converted to permanent states in these lineages.”
§ Molecular Architecture of the Mouse Nervous System > Discussion
plaindirect- Asserted: passes — The authors put it forward as true.
- Checkable: passes — It can be checked against evidence.
- Load-bearing: passes — The paper’s conclusions depend on it.
- Based: passes — The paper gives a reason why it holds.
It may state two separate claims as one.
A conclusion the paper draws from its own results — it cites no other source for it, so there is none to check. The quote shows it is in the paper.
In the paper
“Finally, the OPC cluster was placed next to the SZNBL cluster probably because of strong cell-cycle signal.”
§ Molecular Architecture of the Mouse Nervous System > STAR★Methods > Quantification and Statistical Analysis
hedgedconditional- Asserted: passes — The authors put it forward as true.
- Checkable: passes — It can be checked against evidence.
- Load-bearing: fails — The paper’s conclusions may not depend on it.
- Based: passes — The paper gives a reason why it holds.
Probably not a substantial claim. The paper’s conclusions may not depend on it.
A conclusion the paper draws from its own results — it cites no other source for it, so there is none to check. The quote shows it is in the paper.
In the paper
“The atlas can be used to identify genes and gene combinations unique to specific cell types, which in turn can be used to genetically target cells for visualization, ablation, optogenetic manipulation, gene targeting, and more.”
§ Molecular Architecture of the Mouse Nervous System > Discussion
plaindirect- Asserted: passes — The authors put it forward as true.
- Checkable: passes — It can be checked against evidence.
- Load-bearing: passes — The paper’s conclusions depend on it.
- Based: passes — The paper gives a reason why it holds.
It may state two separate claims as one.
A conclusion the paper draws from its own results — it cites no other source for it, so there is none to check. The quote shows it is in the paper.
In the paper
“This was observed most clearly in the oligodendrocyte lineage but likely occurs to some extent in all lineages.”
§ Molecular Architecture of the Mouse Nervous System > Discussion
hedgedcorrelational- Asserted: passes — The authors put it forward as true.
- Checkable: passes — It can be checked against evidence.
- Load-bearing: passes — The paper’s conclusions depend on it.
- Based: passes — The paper gives a reason why it holds.
It may state two separate claims as one.
A conclusion the paper draws from its own results — it cites no other source for it, so there is none to check. The quote shows it is in the paper.
In the paper
“Similarly, we used relatively shallow sequencing, and deeper sequencing using more sensitive RNA-seq methods is likely to resolve more subtypes.”
§ Molecular Architecture of the Mouse Nervous System > Discussion
hedgedconditional- Asserted: passes — The authors put it forward as true.
- Checkable: passes — It can be checked against evidence.
- Load-bearing: fails — The paper’s conclusions may not depend on it.
- Based: passes — The paper gives a reason why it holds.
Probably not a substantial claim. The paper’s conclusions may not depend on it.
A conclusion the paper draws from its own results — it cites no other source for it, so there is none to check. The quote shows it is in the paper.
In the paper
“This can lead to actionable hypotheses on the mechanism of disease, as well as identifying the relevant cell types to generate mouse models of human disease.”
§ Molecular Architecture of the Mouse Nervous System > Discussion
plaindirect- Asserted: passes — The authors put it forward as true.
- Checkable: fails — It may be too vague to check against evidence.
- Load-bearing: passes — The paper’s conclusions depend on it.
- Based: passes — The paper gives a reason why it holds.
Probably not a substantial claim. It may be too vague to check against evidence. It may state two separate claims as one.
A conclusion the paper draws from its own results — it cites no other source for it, so there is none to check. The quote shows it is in the paper.
In the paper
“We suggest that the diversity of gene expression patterns in the nervous system can be understood through three major principles.”
§ Molecular Architecture of the Mouse Nervous System > Discussion
hedgedcorrelational- Asserted: passes — The authors put it forward as true.
- Checkable: passes — It can be checked against evidence.
- Load-bearing: passes — The paper’s conclusions depend on it.
- Based: fails — The paper may give no reason why it holds.
Probably not a substantial claim. The paper may give no reason why it holds.
The paper relies on this without support.
The mouse nervous system is representative of the mammalian nervous system.
“The resource presented here lays a solid foundation for understanding the molecular architecture of the mammalian nervous system”
The paper relies on this without support.
The sampled regions and cell numbers are sufficient to capture the full diversity of cell types in the mouse nervous system.
“In total, we analyzed 19 regions (Figure 1A) but omitted at least the retina, the olfactory epithelium, the vomeronasal organ, the inner ear, and the parasympathetic ganglia.”
The paper relies on this without support.
The adolescent age (postnatal days 20–30) is appropriate for identifying mature cell types and the overall architecture of the mouse nervous system.
“Although most neuronal types were already mature at the age investigated (postnatal days 20–30)”
The paper relies on this without support.
The developmental origin assigned to each cluster (e.g., telencephalon, diencephalon, midbrain, hindbrain) is correct.
“We assigned each cluster a unique mnemonic identifier (e.g., MBDOP1), descriptive name (“midbrain dopaminergic neuron”), major class (e.g., “neuron”), neurotransmitter identity, putative developmental origin, anatomical location, and region (Table S3).”
The paper relies on this without support.
OPCs are the progenitors of the entire oligodendrocyte lineage.
“Since OPCs are the progenitors of the entire oligodendrocyte lineage”
The paper relies on this without support.
Hox genes 6–10 are responsible for patterning the thoracic spinal cord.
“Hox genes 6–10 (that is, Hoxa6, Hoxb6, …, Hoxd10), which are responsible for patterning the thoracic spinal cord.”
The paper relies on this without support.
Glycine is a widely used inhibitory neurotransmitter only in the caudal parts of the brain and in the spinal cord.
“Glycine is a widely used inhibitory neurotransmitter only in the caudal parts of the brain and in the spinal cord.”
The paper relies on this without support.
The dendrogram based on gene expression distance reflects true cell type relationships.
“we calculated a robust dendrogram of cell types (Figure 1C and STAR Methods), showing relationships between cell types based on gene expression distance.”
The paper relies on this without support.
The technical artifacts can be sufficiently mitigated by the cytograph pipeline so that the resulting clusters reflect biological cell types.
“we developed a multistage analysis pipeline called “cytograph,” which progressively discovers cell types or states while mitigating the impact of technical artifacts”
The authors state this as an assumption.
OPCs are produced by the same progenitors as astrocytes and neurons.
“OPCs are derived from the neural tube and assumed to be produced by the same progenitors as astrocytes and neurons.”
The paper relies on this without support.
The enteric nervous system has not been previously studied in molecular detail using single-cell methods.
“The enteric nervous system has not been previously studied in molecular detail using single-cell methods.”
The paper relies on this without support.
The diversity and function of enteric glia are not known in detail.
“The diversity and function of enteric glia are not known in detail.”
The paper relies on this without support.
Synaptic connectivity, neurotransmission, and membrane conductance are uniquely neuronal properties.
“But synaptic connectivity, neurotransmission, and membrane conductance are uniquely neuronal properties”
The paper relies on this without support.
Some resolution limit-free algorithms can be tuned to detect smaller clusters, but at the expense of breaking up large clusters.
“Some variants (so called resolution limit-free algorithms) can be tuned to detect smaller clusters, but at the expense of breaking up large clusters.”
The paper relies on this without support.
Granule cells of the dentate gyrus and the cerebellum are not related.
“Note: we pooled granule cells of the dentate gyrus and the cerebellum not because we think they are related (they are not), but because they are both extremely abundant and tended to skew manifold learning when included with other cells.”
The paper relies on this without support.
Many, even most, of the cell types described in this paper were not previously associated with known markers.
“Many, even most, of the cell types described in this paper were not previously associated with known makers.”
The authors state this as an assumption.
The trinarization model applies to a cluster of cells representing a putatively homogeneous population.
“The model applies to a cluster of cells representing a putatively homogeneous population.”
Claims other papers make about this one
Each is checked against this paper’s own text: does it say what the citing paper says it does?
The source backs part of the claim, not all of it — or backs it for a different population, condition or comparison.
In the citing paper
“VLMC types66,82 also show highly specific spatial and colocalization patterns.”
From A high-resolution transcriptomic and spatial atlas of cell types in the whole mouse brain (2023) · cites this paper as [66]
Experimental — accuracy not yet measuredThe source backs part of the claim, not all of it — or backs it for a different population, condition or comparison.
In the citing paper
“At a finer resolution, DNA damage signals again tend to be enriched in H3K27ac peak regions: neurons and non-neuronal brain cell types (including ODC and MiG cells) showing the highest enrichment; while Endo and VLMCs, which are not brain-specific cell types display weak enrichments64”
From Single-cell parallel analysis of DNA damage and transcriptome reveals selective genome vulnerability (2025) · cites this paper as [64]
Experimental — accuracy not yet measuredThe source backs part of the claim, not all of it — or backs it for a different population, condition or comparison.
In the citing paper
“The organoid neurons were reminiscent of NC-derived neurons found in cranial or dorsal root ganglia, with medium-large soma Neurofilament-Heavy Chain (NEFH)+ Peripherin (PRPH)+ neurons and smaller soma NEFH−PRPH+ neurons (Fig. 3o, Supplementary Video 7)23,31.”
From Hair-bearing human skin generated entirely from pluripotent stem cells (2020) · cites this paper as [23]
Experimental — accuracy not yet measuredThe source backs part of the claim, not all of it — or backs it for a different population, condition or comparison.
In the citing paper
“but less is known about the transcriptomic heterogeneity of astrocytes across different cortical areas in the aging human brain.”
From Astrocyte transcriptomic changes along the spatiotemporal progression of Alzheimer’s disease (2024) · cites this paper as [29]
Experimental — accuracy not yet measuredThe source backs part of the claim, not all of it — or backs it for a different population, condition or comparison.
In the citing paper
“We found that the thalamic–neocortex separation is conserved in mice and recapitulated both this divide and thalamic marker genes in independent single-cell, bulk and microarray data in both mice and humans8,39,40,43”
From Single-cell multiregion dissection of Alzheimer’s disease (2024) · cites this paper as [40]
Experimental — accuracy not yet measured
The source backs part of the claim, not all of it — or backs it for a different population, condition or comparison.
In the citing paper
“Notably, the thalamic MEIS2+FOXP2+ interneurons shared multiple markers with neocortical GRM3 astrocytes, including GRM3, MEIS2 and VAV339,40,43”
From Single-cell multiregion dissection of Alzheimer’s disease (2024) · cites this paper as [40]
Experimental — accuracy not yet measuredThe cited source says what the claim attributes to it.
In the citing paper
“These observations are consistent with the notion that astrocytes and neurons are derived from common regionally distinct progenitors and share common transcription factors for spatial patterning66,67.”
From A high-resolution transcriptomic and spatial atlas of cell types in the whole mouse brain (2023) · cites this paper as [66]
The cited source says what the claim attributes to it.
In the citing paper
“many of which were well documented61–66.”
From A high-resolution transcriptomic and spatial atlas of cell types in the whole mouse brain (2023) · cites this paper as [66]
The cited source says what the claim attributes to it.
In the citing paper
“Canonical CNS cell type markers were compiled from previous studies66–69.”
From APOE4 to APOE2 allelic switching in mice improves Alzheimer’s disease-related metabolic signatures, neuropathology and cognition (2025) · cites this paper as [67]
The cited source says what the claim attributes to it.
In the citing paper
“Cell type annotation was done using seurat::AddModuleScore() to assign cell scores based on previously identified signatures for different brain cell types (Zeisel et al, 2018).”
From APOE from astrocytes restores Alzheimer’s Aβ-pathology and DAM-like responses in APOE deficient microglia (2024) · cites this paper as Zeisel et al, 2018
The check wasn’t confident either way, so it gives no verdict — never disputed.
In the citing paper
“revealed that ex vivo activation resulted in mis-annotation of exAMs as extra microglial clusters (Supplementary Note 3)37,39.”
From Dissection of artifactual and confounding glial signatures by single-cell sequencing of mouse and human brain (2022) · cites this paper as [37]
Experimental — accuracy not yet measuredThe check wasn’t confident either way, so it gives no verdict — never disputed.
In the citing paper
“transcripts of amyloid precursor protein (APP) and amyloidogenic enzymes are equally abundant in oligodendrocytes (OLs).”
From Oligodendrocytes produce amyloid-β and contribute to plaque formation alongside neurons in Alzheimer’s disease model mice (2024) · cites this paper as [11]
Experimental — accuracy not yet measuredThe check wasn’t confident either way, so it gives no verdict — never disputed.
In the citing paper
“Neural clusters contained cells expressing SOX2 (neural progenitors), DCX (CNS neurons) or PRPH (PNS neurons) (Extended Data Fig. 5)23.”
From Hair-bearing human skin generated entirely from pluripotent stem cells (2020) · cites this paper as [23]
Experimental — accuracy not yet measuredIn the citing paper
“Because of the clear synaptic signal, we investigated in the refined synaptic ontology defined by the SynGO consortium32, and found consistent enrichment for postsynaptic components and processes (GO:0098794; P = 3.9 × 10⁻⁶; Table S7).”
From Rare coding variants in ten genes confer substantial risk for schizophrenia (2022) · cites this paper as [32]
In the citing paper
“High-throughput single-cell sequencing techniques have identified dozens of types of neuron on the basis of their transcriptional profiles3,4,14,15, but linking transcriptomically defined cell types (t-types) to their phenotypes has remained a major challenge16.”
From Phenotypic variation of transcriptomic cell types in mouse motor cortex (2021) · cites this paper as [15]
In the citing paper
“Recent advances in the collection and analysis of single cell RNA-sequencing (scRNAseq) data provide a promising new way to define cell types and how they relate to one another”
From Integrated Morphoelectric and Transcriptomic Classification of Cortical GABAergic Cells (2020) · cites this paper as Zeisel et al., 2018
In the citing paper
“First, high-resolution and high-coverage omics data sets are needed to provide the necessary substrates for comprehensive analysis and discovery. Large-scale, lower-resolution data sets alone (for example, assessing the expression on the order of 2,000 genes per cell71,72,73) may preclude the delineation of functional gene expression signatures.”
From The diversity of GABAergic neurons and neural communication elements (2019) · cites this paper as [73]
In the citing paper
“The application of single-cell RNA sequencing (scRNA-seq) to the neocortex and other brain regions has revealed a complex but tractable hierarchical organization of transcriptomic cell types that are consistent overall with knowledge from decades of anatomical, physiological and developmental studies but with an unmatched level of granularity7–11.”
From A multimodal cell census and atlas of the mammalian primary motor cortex (2021) · cites this paper as [7]
In the citing paper
“Integration of spatial RNA data and the juvenile CNS scRNA-seq atlas32 allowed for visualization of dominant transcriptional cell types in tissue”
From Spatial epigenome–transcriptome co-profiling of mammalian tissues (2023) · cites this paper as [32]
In the citing paper
“Integration with the corresponding juvenile CNS scRNA-seq atlas32 allowed for label transfer to assign transcriptional cell types to the spatial location of epigenetic identities/states (Extended Data Fig. 7g,h, bottom).”
From Spatial epigenome–transcriptome co-profiling of mammalian tissues (2023) · cites this paper as [32]
In the citing paper
“The validity of these annotations was confirmed by comparison with a reported scRNA-seq dataset for the concordant spatial domains (Zeisel et al., 2018) (Figures S1K and S1L).”
From Spatiotemporal transcriptomic atlas of mouse organogenesis using DNA nanoball-patterned arrays (2022) · cites this paper as Zeisel et al., 2018
In the citing paper
“(L) Correspondence between the indicated cell subtypes identified by Stereo-seq and the cell subtypes identified by reported scRNA-seq (Zeisel et al., 2018).”
From Spatiotemporal transcriptomic atlas of mouse organogenesis using DNA nanoball-patterned arrays (2022) · cites this paper as Zeisel et al., 2018
In the citing paper
“To validate the cell type identity characterized in our adult mouse hemibrain section, annotated scRNA-seq profiles of the adult mouse brain downloaded from Linnarsson Lab website (http://mousebrain.org/adolescent/) (Zeisel et al., 2018) were used for comparison.”
From Spatiotemporal transcriptomic atlas of mouse organogenesis using DNA nanoball-patterned arrays (2022) · cites this paper as Zeisel et al., 2018
In the citing paper
“(K) Correspondence between the indicated cell types identified by Stereo-seq and the cell clusters identified by reported scRNA-seq (Zeisel et al., 2018).”
From Spatiotemporal transcriptomic atlas of mouse organogenesis using DNA nanoball-patterned arrays (2022) · cites this paper as Zeisel et al., 2018
In the citing paper
“A similar analysis matched 48 cell types annotated in a recent mouse brain atlas (BCA)32 to 68 MOCA subtypes with high specificity”
From The single-cell transcriptional landscape of mammalian organogenesis (2019) · cites this paper as [32]
In the citing paper
“We compared our subtypes against 265 cell types annotated by a recent mouse brain cell atlas (BCA)32 with cell type correlation analysis, matching 48 BCA-defined cell types (rows) to 68 subtypes in our data (columns).”
From The single-cell transcriptional landscape of mammalian organogenesis (2019) · cites this paper as [32]
In the citing paper
“RSS analysis comparing hSpS to different CNS regions in the mouse (Zeisel et al., 2018) showed that hSpS was most closely correlated to hindbrain cell types”
From Generation of Functional Human 3D Cortico-Motor Assembloids (2020) · cites this paper as Zeisel et al., 2018
In the citing paper
“Our taxonomy recapitulated the known hierarchical organization of neuronal subpopulations in the spinal cord9,12,31–33 (Extended Data Fig. 4a–g).”
From The neurons that restore walking after paralysis (2022) · cites this paper as [32]
In the citing paper
“We first created a merged dataset with over one hundred thousand cells and nuclei from the first six published studies of the postnatal mouse spinal cord1–6.”
From A harmonized atlas of mouse spinal cord cell types and their spatial organization (2021) · cites this paper as [5]
In the citing paper
“Unfortunately, this challenge is compounded by the difficulty in comparing data between studies even when the same tissue types and techniques are used3,5.”
From A harmonized atlas of mouse spinal cord cell types and their spatial organization (2021) · cites this paper as [5]
In the citing paper
“We note that in a recent comprehensive whole-brain scRNA-seq study, Zeisel et al. (2018) grouped 437 brainstem serotonin neurons in the dataset (presumably containing the entire B1–B9 groups) into just five clusters.”
From Single-cell transcriptomes and whole-brain projections of serotonin neurons in the mouse dorsal and median raphe nuclei (2019) · cites this paper as Zeisel et al., 2018
In the citing paper
“Examination of Htr1b expression in cortex, striatum, and ventral midbrain suggests that expression of this receptor in pvMΦs is unique to the DRN and its close surroundings (Hrvatin et al., 2018; Saunders et al., 2018; Zeisel et al., 2018).”
From Molecular and anatomical organization of the dorsal raphe nucleus (2019) · cites this paper as Zeisel et al., 2018
In the citing paper
“the clusters corresponded previous cell class and subtype annotations (50).”
From Non-neuronal expression of SARS-CoV-2 entry genes in the olfactory system suggests mechanisms underlying COVID-19-associated anosmia (2020) · cites this paper as [50]
In the citing paper
“Thanks to recent and ongoing efforts such as the mouse brain atlas (Zeisel et al, 2018) or the Human Cell Atlas (Regev et al, 2017), reference databases are increasingly becoming available.”
From Current best practices in single-cell RNA-seq analysis: a tutorial (2019) · cites this paper as Zeisel et al, 2018
Self-check
Percentages, sums and reported differences re-computed from the paper’s own numbers.
Each contradiction between two passages listed here was confirmed by an independent check.
Rated minor: it would not touch a result — a value no result rests on, a p-value that stays on the same side of the significance level, or a conflict that is clerical, resolved elsewhere in the paper, or outside its own findings.
In the paper
§ Molecular Architecture of the Mouse Nervous System > Results > Central Nervous Systems Neurons
“We identified six cell types in the cerebellum, of which five are previously known: Purkinje cells, granular cells, granular layer interneurons, molecular layer interneurons, and granular cell neuroblasts.”
§ Molecular Architecture of the Mouse Nervous System > Results > Central Nervous Systems Neurons
“A sixth cell type (MEINH1), curiously, was found in the midbrain but was molecularly indistinguishable (Figure S1E) from cerebellum molecular layer interneurons (CBINH1).”
Citations
Cites
Systematic and integrative analysis of large gene lists using DAVID bioinformatics resources
Huang, D. W., Sherman, B. T., & Lempicki, R. A. (2009) · Nature Protocols · doi:10.1038/nprot.2008.211 · Cited by 35,890
Fast unfolding of communities in large networks
Blondel, V. D., Guillaume, J.-L., Lambiotte, R., & Lefebvre, E. (2008) · Journal of Statistical Mechanics: Theory and Experiment · doi:10.1088/1742-5468/2008/10/p10008 · Cited by 21,424
Highly parallel genome-wide expression profiling of individual cells using nanoliter droplets.
Macosko, E. Z., Basu, A., Satija, R., Nemesh, J., Shekhar, K., Goldman, M., Tirosh, I., Bialas, A. R., Kamitaki, N., Martersteck, E. M., et al. (2015) · Cell · doi:10.1016/j.cell.2015.05.002 · Cited by 7,110
A robust and high-throughput Cre reporting and characterization system for the whole mouse brain
Madisen, L., Zwingman, T. A., Sunkin, S. M., Oh, S. W., Zariwala, H. A., Gu, H., Ng, L. L., Palmiter, R. D., Hawrylycz, M. J., Jones, A. R., et al. (2010) · Nature Neuroscience · doi:10.1038/nn.2467 · Cited by 6,907
Genome-wide atlas of gene expression in the adult mouse brain
Lein, E. S., Hawrylycz, M. J., Ao, N., Ayres, M., Bensinger, A., Bernard, A., Boe, A. F., Boguski, M. S., Brockway, K. S., Byrnes, E. J., et al. (2007) · Nature · doi:10.1038/nature05453 · Cited by 5,572
mRNA-Seq whole-transcriptome analysis of a single cell
Tang, F., Barbacioru, C., Wang, Y., Nordman, E., Lee, C., Xu, N., Wang, X., Bodeau, J., Tuch, B. B., Siddiqui, A., et al. (2009) · Nature Methods · doi:10.1038/nmeth.1315 · Cited by 3,969
Cell types in the mouse cortex and hippocampus revealed by single-cell RNA-seq
Zeisel, A., Muñoz-Manchado, A. B., Codeluppi, S., Lönnerberg, P., La Manno, G., Juréus, A., Marques, S., Munguba, H., He, L., Betsholtz, C., et al. (2015) · Science · doi:10.1126/science.aaa1934 · Cited by 3,124
Self-citationResolution limit in community detection
Fortunato, S., & Barthélemy, M. (2007) · Proceedings of the National Academy of Sciences · doi:10.1073/pnas.0605965104 · Cited by 3,024
Regev, A., Teichmann, S. A., Lander, E. S., Amit, I., Benoist, C., Birney, E., Bodenmiller, B., Campbell, P., Carninci, P., Clatworthy, M., et al. (2017) · eLife · doi:10.7554/elife.27041 · Cited by 2,232
Self-citationUnbiased classification of sensory neuron types by large-scale single-cell RNA sequencing
Usoskin, D., Furlan, A., Islam, S., Abdo, H., Lönnerberg, P., Lou, D., Hjerling-Leffler, J., Haeggström, J., Kharchenko, O., Kharchenko, P. V., et al. (2015) · Nature Neuroscience · doi:10.1038/nn.3881 · Cited by 2,136
Self-citation
Cited by
Sorted by citations
La Manno, G., Soldatov, R., Zeisel, A., Braun, E., Hochgerner, H., Petukhov, V., Lidschreiber, K., Kastriti, M. E., Lönnerberg, P., Furlan, A., et al. (2018) · Nature · doi:10.1038/s41586-018-0414-6 · Cited by 4,118
Self-citationThe single-cell transcriptional landscape of mammalian organogenesis
Cao, J., Spielmann, M., Qiu, X., Huang, X., Ibrahim, D. M., Hill, A. J., Zhang, F., Mundlos, S., Christiansen, L., Steemers, F. J., et al. (2019) · Nature · doi:10.1038/s41586-019-0969-x · Cited by 4,490
Mapping genomic loci implicates genes and synaptic biology in schizophrenia
Trubetskoy, V., Pardiñas, A. F., Qi, T., Panagiotaropoulou, G., Awasthi, S., Bigdeli, T. B., Bryois, J., Chen, C.-Y., Dennison, C. A., Hall, L. S., et al. (2022) · Nature · doi:10.1038/s41586-022-04434-5 · Cited by 2,964
Current best practices in single-cell RNA-seq analysis: a tutorial
Luecken, M. D., & Theis, F. J. (2019) · Molecular Systems Biology · doi:10.15252/msb.20188746 · Cited by 2,231
Transcriptome-scale super-resolved imaging in tissues by RNA seqFISH
Eng, C.-H. L., Lawson, M., Zhu, Q., Dries, R., Koulena, N., Takei, Y., Yun, J., Cronin, C., Karp, C., Yuan, G.-C., et al. (2019) · Nature · doi:10.1038/s41586-019-1049-y · Cited by 1,754
Metadata
- Authors
- Zeisel, A., Hochgerner, H., Lönnerberg, P., Johnsson, A., Memic, F., van der Zwan, J., Häring, M., Braun, E., Borm, L. E., La Manno, G., Codeluppi, S., Furlan, A., Lee, K., Skene, N., Harris, K. D., Hjerling-Leffler, J., Arenas, E., Ernfors, P., Marklund, U., & Linnarsson, S.
- Affiliations
- Karolinska Institutet (SE)
- UCL Queen Square Institute of Neurology (GB)
- Corresponding author
- Linnarsson, Sten
- ORCID
- Venue
- Cell
- Publisher
- Elsevier BV
- Published
- 2018-08
- Volume
- 174
- Issue
- 4
- Pages
- 999-1014.e22
- ISSN
- 0092-8674 (ISSN-L)
- PMC
- PMC6086934
- OpenAlex
- W2949693884
- Cited by
- 2,552
- References
- 53
- Citations by year
- 2026: 232 · 2025: 317 · 2024: 315 · 2023: 321 · 2022: 361 · 2021: 412 · 2020: 348 · 2019: 200 · 2018: 41
- FWCI
- 78.44
- Type
- journal article
- Language
- en
- Open access
- hybrid
- doi.org
- Licence
- Locations
- Cell (publishedVersion, cc-by)
- bioRxiv (Cold Spring Harbor Laboratory) (submittedVersion, cc-by-nd)
- Europe PMC (PubMed Central) (publishedVersion, cc-by)
- PubMed Central (publishedVersion, cc-by)
- PubMed (publishedVersion)
- Cold Spring Harbor Laboratory Institutional Repository (Cold Spring Harbor Laboratory) (acceptedVersion)
- UCL Discovery (University College London) (submittedVersion)
- Infoscience (Ecole Polytechnique Fédérale de Lausanne) (submittedVersion, cc-by-nc-nd)
- Spiral (Imperial College London) (submittedVersion, cc-by)
- Funders
- Knut and Alice Wallenberg Foundation (2015.0041)
- Swedish Foundation for Strategic Research (SSF (RIF 14-0057, SB16-0065)
- Wellcome Trust (108726/Z/15/Z)
- Swedish Research Council (2016-01526, 2016-03130)
- SSF (SRL, SB16-0065)
- Cancerfonden (CAN 2016/572)
- EU
- Hjärnfonden (FO2017-0059)
- SFO Strat Regen (SG-2018)
- European Research Council (740491)
- Ollie and Elof Ericssons Foundation
- Åke Wiberg Foundation (M16-0197)
- Topics
- Life Sciences › Biochemistry, Genetics and Molecular Biology › Molecular Biology › Single-cell and spatial transcriptomics
- Life Sciences › Neuroscience › Developmental Neuroscience › Neurogenesis and neuroplasticity mechanisms
- Life Sciences › Neuroscience › Cellular and Molecular Neuroscience › Neuroscience and Neuropharmacology Research
- Keywords
- single-cell transcriptomics, neuronal heterogeneity, astrocyte heterogeneity, neurotransmitters, neuropeptides, glutamate, glycine, synaptic connectivity, cell identity genes, membrane conductance
- MeSH terms
- Animals, Female, Male, Mice, Inbred C57BL, Nervous System, Gene Expression Regulation, Developmental, Gene Expression Profiling, Mice, Gene Regulatory Networks, Single-Cell Analysis, High-Throughput Nucleotide Sequencing, Transcriptome
About these checks
Registry, retraction, Cites and statistics results are computed, not judged, with one exception: a printed reference that no index lists is read once by a model before it counts as a citation error. Claims are extracted by a model and kept only when their quote appears verbatim in the text; each cited source is then checked, with a model’s help, for whether it says what the claim relies on. Those verdicts can be wrong — read the claim’s quote and the cited source before relying on one.
A language model drew the claims from the paper on 2026-10-07, under version 3 of the claim definition (model deepseek-v4.1-flash, prompt extract-v3).
A second model labelled each claim on 2026-10-07 (model jev-1.13-20260917, definition revision gold-guideline-v0.2).
Cited sources are checked with a language model’s help (gpt-6-sol).
Statistics and arithmetic are recomputed, not judged.
Confidence bands are shown only for fields calibrated on our annotated test set. None is calibrated yet, so no band is shown.
What counts as a claim ›How we measure confidence ›How we check this ›
Are you an author, or do you see a problem with this page? Request a review
