

The DOI matches its Crossref record; 58 of the 58 references it cites were found in a registry or an index.
Sustained Brown Fat Stimulation and Insulin Sensitization by a Humanized Bispecific Antibody Agonist for Fibroblast Growth Factor Receptor 1/βKlotho Complex
Open accessAbstract
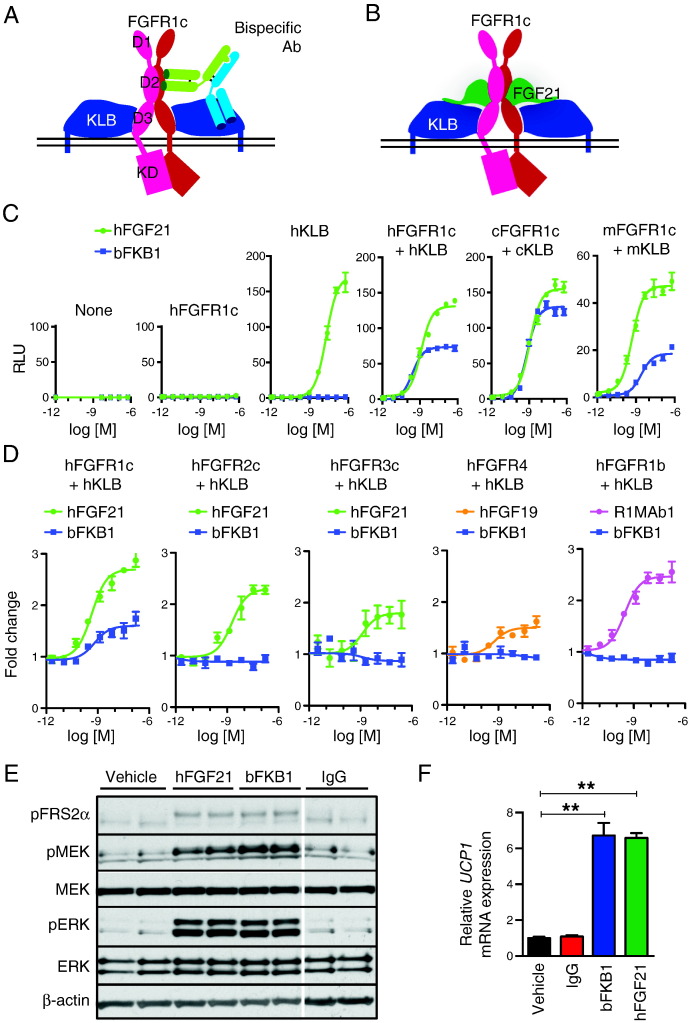
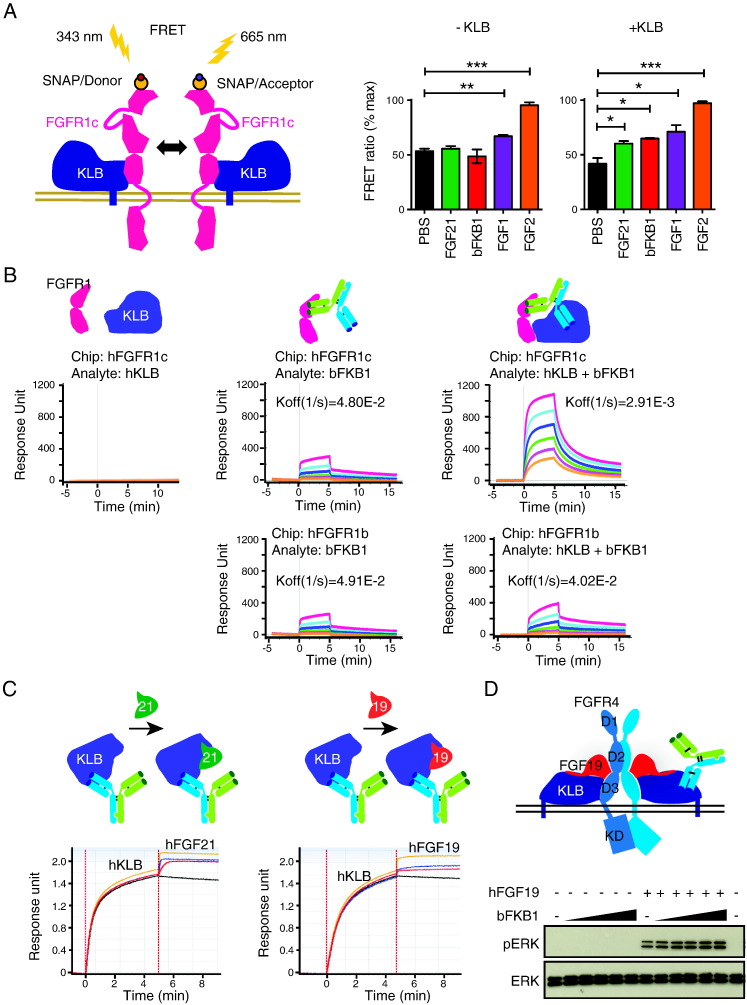
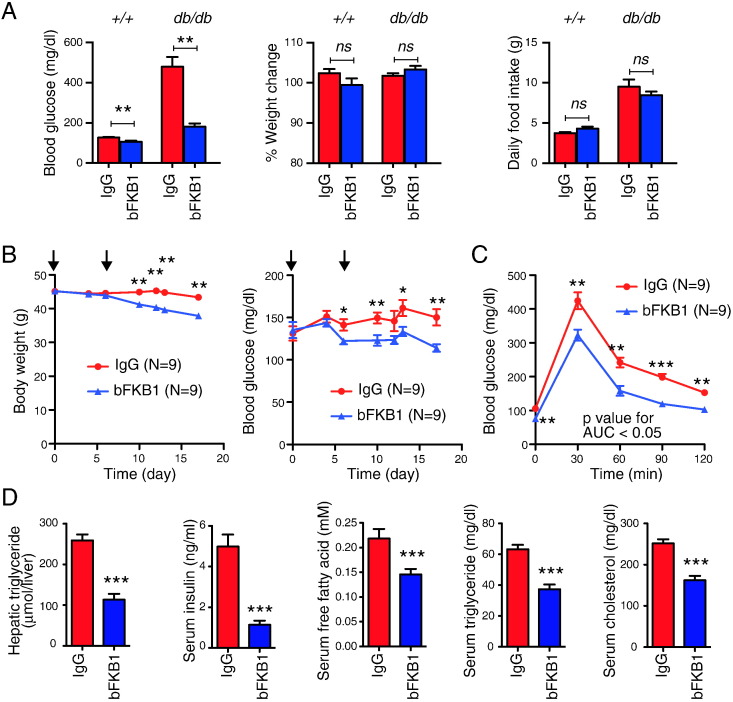
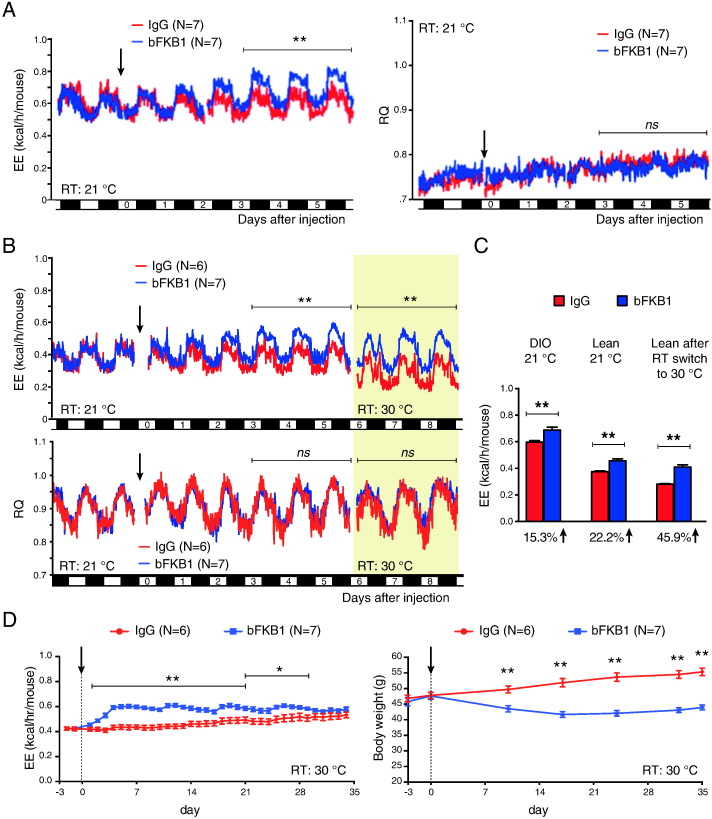
Dissipating excess calories as heat through therapeutic stimulation of brown adipose tissues (BAT) has been proposed as a potential treatment for obesity-linked disorders. Here, we describe the generation of a humanized effector-less bispecific antibody that activates fibroblast growth factor receptor (FGFR) 1/βKlotho complex, a common receptor for FGF21 and FGF19. Using this molecule, we show that antibody-mediated activation of FGFR1/βKlotho complex in mice induces sustained energy expenditure in BAT, browning of white adipose tissue, weight loss, and improvements in obesity-associated metabolic derangements including insulin resistance, hyperglycemia, dyslipidemia and hepatosteatosis. In mice and cynomolgus monkeys, FGFR1/βKlotho activation increased serum high-molecular-weight adiponectin, which appears to contribute over time by enhancing the amplitude of the metabolic benefits. At the same time, insulin sensitization by FGFR1/βKlotho activation occurs even before the onset of weight loss in a manner that is independent of adiponectin. Together, selective activation of FGFR1/βKlotho complex with a long acting therapeutic antibody represents an attractive approach for the treatment of type 2 diabetes and other obesity-linked disorders through enhanced energy expenditure, insulin sensitization and induction of high-molecular-weight adiponectin.
Overview
The claims and statistics of this paper haven’t been checked yet.
Run the check — free, no account needed. It reads the open-access text and checks the sources it cites.
Integrity signals
Registry
Cites
Statistics
Figures
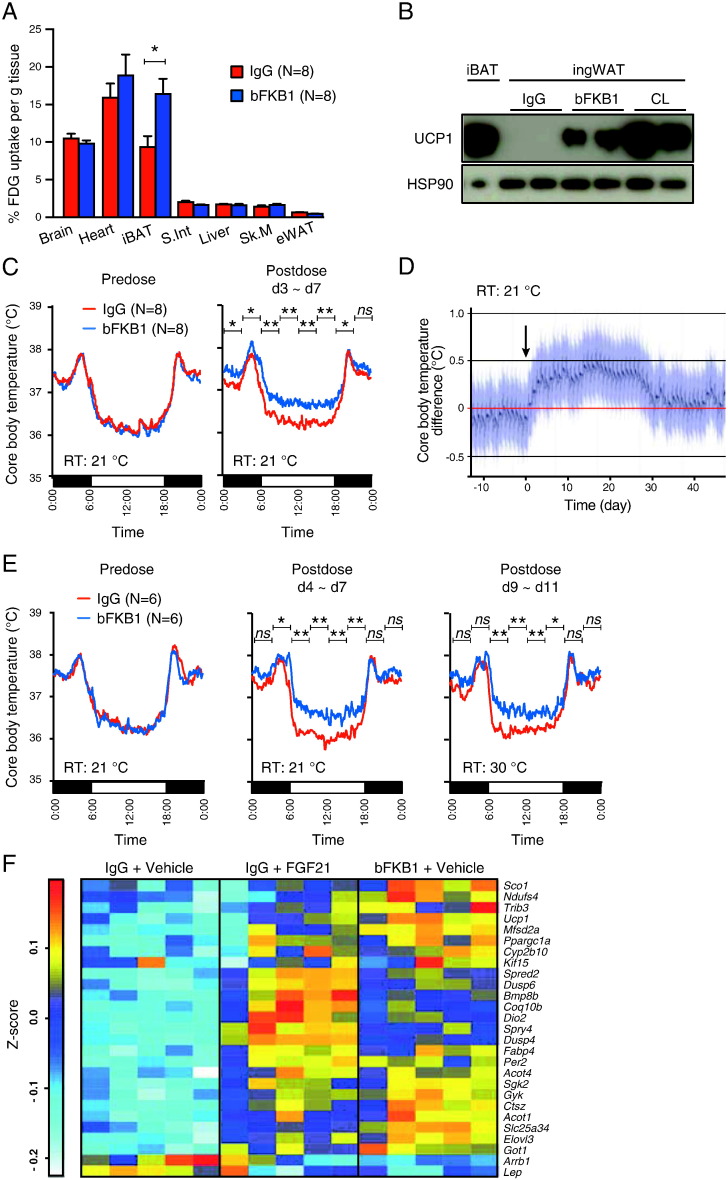
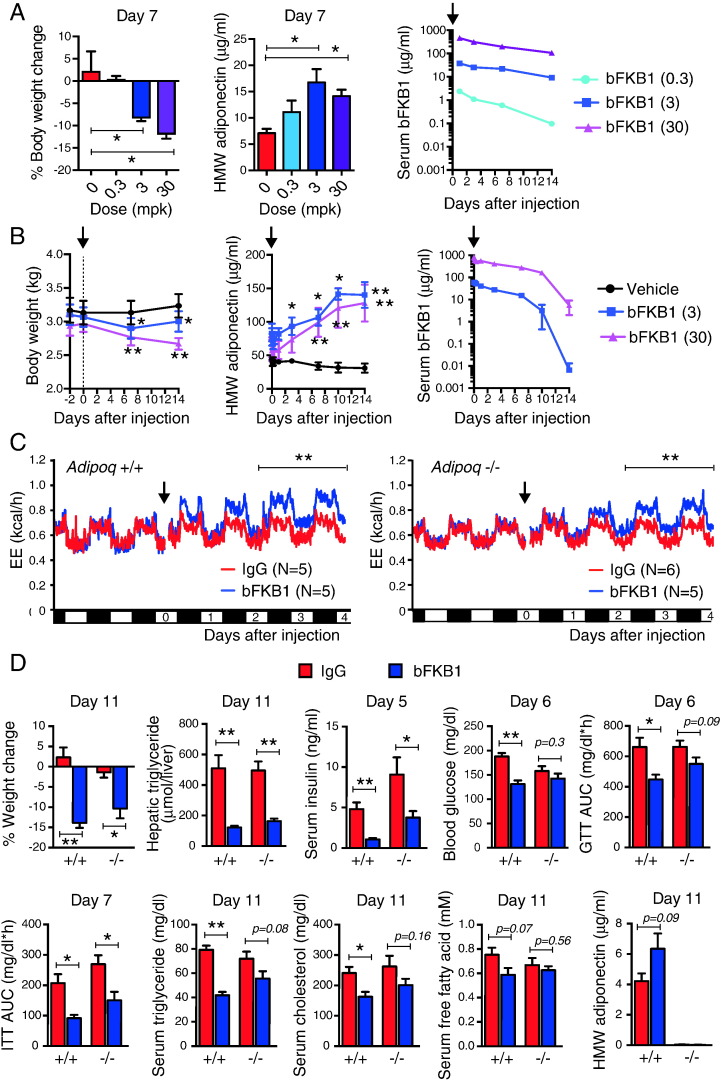
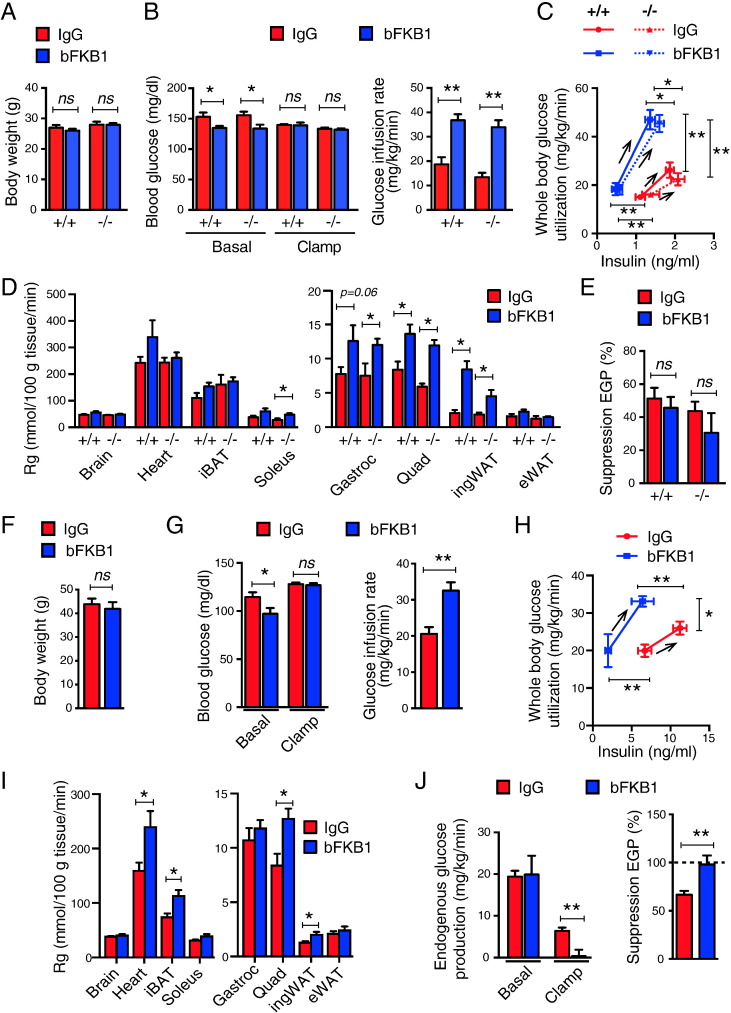
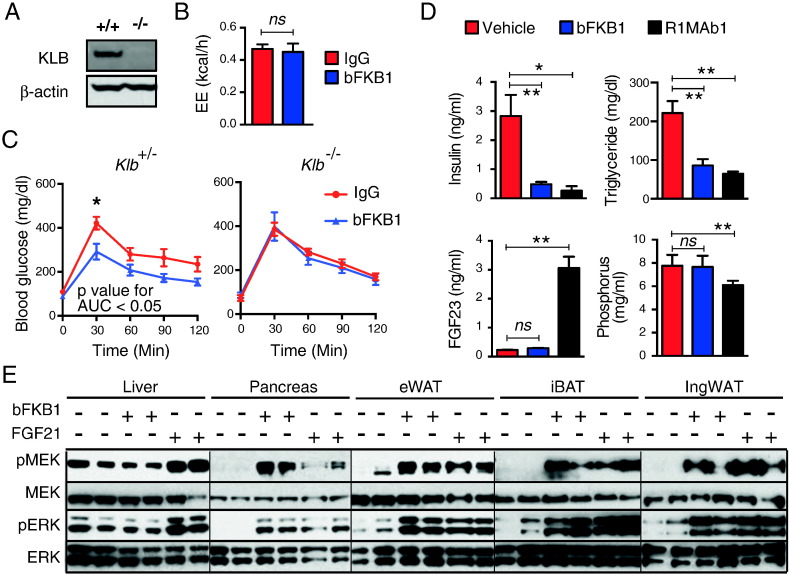
Verification
Claims the paper makes
The claims and statistics of this paper haven’t been checked yet.
Run the check — free, no account needed. It reads the open-access text and checks the sources it cites.
Claims other papers make about this one
Each is checked against this paper’s own text: does it say what the citing paper says it does?
In the citing paper
“Moreover, in contrast to previous studies, both FGF21 (11) and a bispecific activating antibody for the FGFR1–β-klotho receptor complex (70) were found to efficiently retain their acute insulin-sensitizing effects in adiponectin knockout mice (Figure 4).”
From Fibroblast Growth Factor 21: A Versatile Regulator of Metabolic Homeostasis (2018) · cites this paper as [70]
Self-check
Percentages, sums and reported differences re-computed from the paper’s own numbers.
The self-check needs the paper’s full text.
Citations
Cites
Ng, M., Fleming, T., Robinson, M., Thomson, B., Graetz, N., Margono, C., Mullany, E. C., Biryukov, S., Abbafati, C., Abera, S. F., et al. (2014) · The Lancet · doi:10.1016/s0140-6736(14)60460-8 · Cited by 11,952
Brown Adipose Tissue: Function and Physiological Significance
CANNON, B., & NEDERGAARD, J. (2004) · Physiological Reviews · doi:10.1152/physrev.00015.2003 · Cited by 6,433
Unexpected evidence for active brown adipose tissue in adult humans
Nedergaard, J., Bengtsson, T., & Cannon, B. (2007) · American Journal of Physiology-Endocrinology and Metabolism · doi:10.1152/ajpendo.00691.2006 · Cited by 1,824
FGF21 regulates PGC-1α and browning of white adipose tissues in adaptive thermogenesis
Fisher, F. M., Kleiner, S., Douris, N., Fox, E. C., Mepani, R. J., Verdeguer, F., Wu, J., Kharitonenkov, A., Flier, J. S., Maratos-Flier, E., et al. (2012) · Genes & Development · doi:10.1101/gad.177857.111 · Cited by 1,478 · cited 1×
“In addition, FGF21 induces the emergence of UCP1-positive adipocytes in the white adipose tissue (WAT) depot, a process now termed browning (Fisher et al., 2012).”
BackgroundXu, J., Lloyd, D. J., Hale, C., Stanislaus, S., Chen, M., Sivits, G., Vonderfecht, S., Hecht, R., Li, Y.-S., Lindberg, R. A., et al. (2009) · Diabetes · doi:10.2337/db08-0392 · Cited by 1,151
Self-citationEctopic Fat in Insulin Resistance, Dyslipidemia, and Cardiometabolic Disease
Shulman, G. I. (2014) · New England Journal of Medicine · doi:10.1056/nejmra1011035 · Cited by 1,126
Activation of Human Brown Adipose Tissue by a β3-Adrenergic Receptor Agonist
Cypess, A. M., Weiner, L. S., Roberts‐Toler, C., Franquet, E., Kessler, S., Kahn, P. A., English, J., Chatman, K., Trauger, S. A., Doria, A., et al. (2015) · Cell Metabolism · doi:10.1016/j.cmet.2014.12.009 · Cited by 1,053
Alternatively activated macrophages produce catecholamines to sustain adaptive thermogenesis
Nguyen, K. D., Qiu, Y., Cui, X., Goh, Y. P. S., Mwangi, J., David, T., Mukundan, L., Brombacher, F., Locksley, R. M., & Chawla, A. (2011) · Nature · doi:10.1038/nature10653 · Cited by 1,038
Fibroblast Growth Factor 21 Corrects Obesity in Mice
Coskun, T., Bina, H. A., Schneider, M. A., Dunbar, J. D., Hu, C. C., Chen, Y., Moller, D. E., & Kharitonenkov, A. (2008) · Endocrinology · doi:10.1210/en.2008-0816 · Cited by 1,031
Self-citationRecruited brown adipose tissue as an antiobesity agent in humans
Yoneshiro, T., Aita, S., Matsushita, M., Kayahara, T., Kameya, T., Kawai, Y., Iwanaga, T., & Saito, M. (2013) · Journal of Clinical Investigation · doi:10.1172/jci67803 · Cited by 966
The effects of LY2405319, an FGF21 analog, in obese human subjects with type 2 diabetes
Gaich, G., Chien, J. Y., Fu, H., Glass, L. C., Deeg, M. A., Holland, W. L., Kharitonenkov, A., Bumol, T., Schilske, H. K., & Moller, D. E. (2013) · Cell Metabolism · doi:10.1016/j.cmet.2013.08.005 · Cited by 885
Bordicchia, M., Liu, D., Amri, E.-Z., Ailhaud, G., Dessì-Fulgheri, P., Zhang, C., Takahashi, N., Sarzani, R., & Collins, S. (2012) · Journal of Clinical Investigation · doi:10.1172/jci59701 · Cited by 872
Therapeutic antibodies for autoimmunity and inflammation
Chan, A. C., & Carter, P. J. (2010) · Nature reviews. Immunology · doi:10.1038/nri2761 · Cited by 846
Boosting Brain Uptake of a Therapeutic Antibody by Reducing Its Affinity for a Transcytosis Target
Yu, Y. J., Zhang, Y., Kenrick, M., Hoyte, K., Luk, W., Lu, Y., Atwal, J., Elliott, J. M., Prabhu, S., Watts, R. J., et al. (2011) · Science Translational Medicine · doi:10.1126/scitranslmed.3002230 · Cited by 794
Self-citationKurosu, H., Choi, M., Ogawa, Y., Dickson, A. S., Goetz, R., Eliseenkova, A. V., Mohammadi, M., Rosenblatt, K. P., Kliewer, S. A., & Kuro-o, M. (2007) · Journal of Biological Chemistry · doi:10.1074/jbc.m704165200 · Cited by 748
The metabolic state of diabetic monkeys is regulated by fibroblast growth factor-21
Kharitonenkov, A., Wroblewski, V. J., Koester, A., Chen, Y.-F., Clutinger, C. K., Tigno, X. T., Hansen, B. C., Shanafelt, A. B., & Etgen, G. J. (2007) · Endocrinology · doi:10.1210/en.2006-1168 · Cited by 738
Self-citationBrown and beige fat in humans: thermogenic adipocytes that control energy and glucose homeostasis
Sidossis, L. S., & Kajimura, S. (2015) · Journal of Clinical Investigation · doi:10.1172/jci78362 · Cited by 715
Fon Tacer, K., Bookout, A. L., Ding, X., Kurosu, H., John, G. B., Wang, L., Goetz, R., Mohammadi, M., Kuro-o, M., Mangelsdorf, D. J., et al. (2010) · Molecular Endocrinology · doi:10.1210/me.2010-0142 · Cited by 700
Lin, Z., Tian, H., Lam, K. S. L., Lin, S., Hoo, R. C. L., Konishi, M., Itoh, N., Wang, Y., Bornstein, S. R., Xu, A., et al. (2013) · Cell Metabolism · doi:10.1016/j.cmet.2013.04.005 · Cited by 691
A new glucagon and GLP-1 co-agonist eliminates obesity in rodents
Day, J. W., Ottaway, N., Patterson, J. T., Gelfanov, V., Smiley, D., Gidda, J., Findeisen, H., Bruemmer, D., Drucker, D. J., Chaudhary, N., et al. (2009) · Nature Chemical Biology · doi:10.1038/nchembio.209 · Cited by 641
Fu, L., John, L. M., Adams, S. H., Yu, X. X., Tomlinson, E., Renz, M. E., Williams, P. M., Soriano, R. H., Corpuz, R. T., Moffat, B., et al. (2004) · Endocrinology · doi:10.1210/en.2003-1671 · Cited by 584
Self-citationTomlinson, E., Fu, L., John, L., Hultgren, B., Huang, X., Renz, M., Stephan, J. P., Tsai, S. P., Powell-Braxton, L., French, D., et al. (2002) · Endocrinology · doi:10.1210/endo.143.5.8850 · Cited by 576
FGF21 regulates metabolism and circadian behavior by acting on the nervous system
Bookout, A. L., de Groot, M. H. M., Owen, B. M., Lee, S., Gautron, L., Lawrence, H. L., Ding, X., Elmquist, J. K., Takahashi, J. S., Mangelsdorf, D. J., et al. (2013) · Nature Medicine · doi:10.1038/nm.3249 · Cited by 545
An FGF21-Adiponectin-Ceramide Axis Controls Energy Expenditure and Insulin Action in Mice
Holland, W., Adams, A., Brozinick, J., Bui, H., Miyauchi, Y., Kusminski, C., Bauer, S., Wade, M., Singhal, E., Cheng, C. C., et al. (2013) · Cell Metabolism · doi:10.1016/j.cmet.2013.03.019 · Cited by 525
FGF21 acts centrally to induce sympathetic nerve activity, energy expenditure, and weight loss
Owen, B. M., Ding, X., Morgan, D. A., Coate, K. C., Bookout, A. L., Rahmouni, K., Kliewer, S. A., & Mangelsdorf, D. J. (2014) · Cell Metabolism · doi:10.1016/j.cmet.2014.07.012 · Cited by 523
Wei, W., Dutchak, P. A., Wang, X., Ding, X., Wang, X., Bookout, A. L., Goetz, R., Mohammadi, M., Gerard, R. D., Dechow, P. C., et al. (2012) · Proceedings of the National Academy of Sciences · doi:10.1073/pnas.1200797109 · Cited by 426
Inhibition of Growth Hormone Signaling by the Fasting-Induced Hormone FGF21
Inagaki, T., Lin, V. Y., Goetz, R., Mohammadi, M., Mangelsdorf, D. J., & Kliewer, S. A. (2008) · Cell Metabolism · doi:10.1016/j.cmet.2008.05.006 · Cited by 409
Considerations in the Design of Hyperinsulinemic-Euglycemic Clamps in the Conscious Mouse
Ayala, J. E., Bracy, D. P., McGuinness, O. P., & Wasserman, D. H. (2006) · Diabetes · doi:10.2337/diabetes.55.02.06.db05-0686 · Cited by 406
Self-citationβKlotho Is Required for Fibroblast Growth Factor 21 Effects on Growth and Metabolism
Ding, X., Boney-Montoya, J., Owen, B. M., Bookout, A. L., Coate, K. C., Mangelsdorf, D. J., & Kliewer, S. A. (2012) · Cell Metabolism · doi:10.1016/j.cmet.2012.08.002 · Cited by 403
The fasting polypeptide FGF21 can enter brain from blood
Hsuchou, H., Pan, W., & Kastin, A. J. (2007) · Peptides · doi:10.1016/j.peptides.2007.10.007 · Cited by 280
The breadth of FGF21's metabolic actions are governed by FGFR1 in adipose tissue
Adams, A. C., Yang, C., Coskun, T., Cheng, C. C., Gimeno, R. E., Luo, Y., & Kharitonenkov, A. (2013) · Molecular Metabolism · doi:10.1016/j.molmet.2012.08.007 · Cited by 266
Adiponectin, driver or passenger on the road to insulin sensitivity?
Ye, R., & Scherer, P. E. (2013) · Molecular Metabolism · doi:10.1016/j.molmet.2013.04.001 · Cited by 251
Cold Exposure Promotes Atherosclerotic Plaque Growth and Instability via UCP1-Dependent Lipolysis
Dong, M., Yang, X., Lim, S., Cao, Z., Honek, J., Lu, H., Zhang, C., Seki, T., Hosaka, K., Wahlberg, E., et al. (2013) · Cell Metabolism · doi:10.1016/j.cmet.2013.06.003 · Cited by 240
Self-citationFGF21 contributes to neuroendocrine control of female reproduction
Owen, B. M., Bookout, A. L., Ding, X., Lin, V. Y., Atkin, S. D., Gautron, L., Kliewer, S. A., & Mangelsdorf, D. J. (2013) · Nature Medicine · doi:10.1038/nm.3250 · Cited by 230
White-to-brown transdifferentiation of omental adipocytes in patients affected by pheochromocytoma
Frontini, A., Vitali, A., Perugini, J., Murano, I., Romiti, C., Ricquier, D., Guerrieri, M., & Cinti, S. (2013) · Biochimica et Biophysica Acta (BBA) - Molecular and Cell Biology of Lipids · doi:10.1016/j.bbalip.2013.02.005 · Cited by 218
Targeting FGFR4 Inhibits Hepatocellular Carcinoma in Preclinical Mouse Models
French, D., Lin, B. C., Wang, M.-T., Adams, C. W., Shek, T., Hötzel, K., Bolon, B., Ferrando, R., Blackmore, C., Schroeder, K., et al. (2012) · PLoS ONE · doi:10.1371/journal.pone.0036713 · Cited by 216
Foltz, I. N., Hu, S., King, C., Wu, X., Yang, C., Wang, W., Weiszmann, J., Stevens, J., Chen, J. S., Nuanmanee, N., et al. (2012) · Science Translational Medicine · doi:10.1126/scitranslmed.3004690 · Cited by 211
Pharmacologic Effects of FGF21 Are Independent of the “Browning” of White Adipose Tissue
Véniant, M. M., Sivits, G., Helmering, J., Komorowski, R., Lee, J., Fan, W., Moyer, C., & Lloyd, D. J. (2015) · Cell Metabolism · doi:10.1016/j.cmet.2015.04.019 · Cited by 204
Spiess, C., Merchant, M. A., Huang, A. J. Y., Zheng, Z., Yang, N.-Y., Peng, J., Ellerman, D. A., Shatz-Binder, W., Reilly, D. E., Yansura, D. G., et al. (2013) · Nature Biotechnology · doi:10.1038/nbt.2621 · Cited by 198
Self-citationWu, A.-L., Coulter, S., Liddle, C., Wong, A., Eastham‐Anderson, J., French, D. M., Peterson, A. S., & Sonoda, J. (2011) · PLoS ONE · doi:10.1371/journal.pone.0017868 · Cited by 185
Self-citationWu, A.-L., Kolumam, G., Stawicki, S., Chen, Y., Li, J., Zavala-Solorio, J., Phamluong, K., Feng, B., Li, L., Marsters, S., et al. (2011) · Science Translational Medicine · doi:10.1126/scitranslmed.3002669 · Cited by 184
Self-citationDiscrete Aspects of FGF21 In Vivo Pharmacology Do Not Require UCP1
Samms, R. J., Smith, D. P., Cheng, C. C., Antonellis, P. P., Perfield, J. W., Kharitonenkov, A., Gimeno, R. E., & Adams, A. C. (2015) · Cell Reports · doi:10.1016/j.celrep.2015.04.046 · Cited by 154
FGF21 N‐ and C‐termini play different roles in receptor interaction and activation
Yie, J., Hecht, R., Patel, J., Stevens, J., Wang, W., Hawkins, N., Steavenson, S., Smith, S., Winters, D., Fisher, S., et al. (2009) · FEBS Letters · doi:10.1016/j.febslet.2008.11.023 · Cited by 149
Different roles of N‐ and C‐ termini in the functional activity of FGF21
Micanovic, R., Raches, D. W., Dunbar, J. D., Driver, D. A., Bina, H. A., Dickinson, C. D., & Kharitonenkov, A. (2009) · Journal of Cellular Physiology · doi:10.1002/jcp.21675 · Cited by 146
Toxicity of Weight Loss Agents
Yen, M., & Ewald, M. B. (2012) · Journal of Medical Toxicology · doi:10.1007/s13181-012-0213-7 · Cited by 132
Osteocyte-Specific Deletion of Fgfr1 Suppresses FGF23
Xiao, Z., Huang, J., Cao, L., Liang, Y., Han, X., & Quarles, L. D. (2014) · PLoS ONE · doi:10.1371/journal.pone.0104154 · Cited by 113
Yie, J., Wang, W., Deng, L., Tam, L., Stevens, J., Chen, M. M., Li, Y., Xu, J., Lindberg, R., Hecht, R., et al. (2012) · Chemical Biology & Drug Design · doi:10.1111/j.1747-0285.2012.01325.x · Cited by 99
Self-citationSun, H. D., Malabunga, M., Tonra, J. R., DiRenzo, R., Carrick, F. E., Zheng, H., Berthoud, H., McGuinness, O. P., Shen, J., Böhlen, P., et al. (2006) · American Journal of Physiology-Endocrinology and Metabolism · doi:10.1152/ajpendo.00089.2006 · Cited by 95
Self-citationShatz-Binder, W., Chung, S., Li, B., Marshall, B., Tejada, M. L., Phung, W., Sandoval, W. N., Kelley, R. F., & Scheer, J. M. (2013) · mAbs · doi:10.4161/mabs.26307 · Cited by 89
Pai, R., French, D. M., Ma, N., Hötzel, K., Plise, E. G., Salphati, L., Setchell, K. D. R., Ware, J. A., Lauriault, V., Schutt, L., et al. (2012) · Toxicological Sciences · doi:10.1093/toxsci/kfs011 · Cited by 77
Yanochko, G. M., Vitsky, A., Heyen, J. R. R., Hirakawa, B. P., Lam, J. L., May, J. R., Nichols, T., Sace, F., Trajkovic, D., & Blasi, E. (2013) · Toxicological Sciences · doi:10.1093/toxsci/kft161 · Cited by 76
Antibody-Mediated Activation of FGFR1 Induces FGF23 Production and Hypophosphatemia
Wu, A.-L., Feng, B., Chen, M. Z., Kolumam, G. A., Zavala‐Solorio, J., Wyatt, S. K., Gandham, V. D., Carano, R. A. D., & Sonoda, J. (2013) · PLoS ONE · doi:10.1371/journal.pone.0057322 · Cited by 67
Self-citationFGF21 Can Be Mimicked In Vitro and In Vivo by a Novel Anti-FGFR1c/β-Klotho Bispecific Protein
Smith, R. J., Duguay, A. N., Bakker, A., Li, P., Weiszmann, J., Thomas, M. R., Alba, B. M., Wu, X., Gupte, J., Li, Y., et al. (2013) · PLoS ONE · doi:10.1371/journal.pone.0061432 · Cited by 59
Lack of responses to a beta3-adrenergic agonist in lipoatrophic A-ZIP/F-1 mice.
Gavrilova, O., Marcus‐Samuels, B., & Reitman, M. L. (2000) · Diabetes · doi:10.2337/diabetes.49.11.1910 · Cited by 59
Adiponectin and its receptors: implications for obesity-associated diseases and longevity
Kadowaki, T., Yamauchi, T., Okada‐Iwabu, M., & Iwabu, M. (2013) · The Lancet Diabetes & Endocrinology · doi:10.1016/s2213-8587(13)70120-7 · Cited by 47
ExpressionPlot: a web-based framework for analysis of RNA-Seq and microarray gene expression data
Friedman, B. A., & Maniatis, T. (2011) · Genome biology · doi:10.1186/gb-2011-12-7-r69 · Cited by 45
Søndergaard, E., Gormsen, L. C., Christensen, M. H., Pedersen, S. B., Christiansen, P., Nielsen, S., Poulsen, P. L., & Jessen, N. (2014) · Diabetic Medicine · doi:10.1111/dme.12595 · Cited by 43
Dikeman, M. E. (2013) · Cited by 8
Cited by
Sorted by citations
Bispecific antibodies: a mechanistic review of the pipeline
Labrijn, A. F., Janmaat, M. L., Reichert, J. M., & Parren, P. W. H. I. (2019) · Nature Reviews Drug Discovery · doi:10.1038/s41573-019-0028-1 · Cited by 1,303
Next generation antibody drugs: pursuit of the 'high-hanging fruit'
Carter, P. J., & Lazar, G. A. (2017) · Nature Reviews Drug Discovery · doi:10.1038/nrd.2017.227 · Cited by 780
Targeting adipose tissue in the treatment of obesity-associated diabetes
Kusminski, C. M., Bickel, P. E., & Scherer, P. E. (2016) · Nature Reviews Drug Discovery · doi:10.1038/nrd.2016.75 · Cited by 678
The therapeutic potential of FGF21 in metabolic diseases: from bench to clinic
Geng, L., Lam, K. S. L., & Xu, A. (2020) · Nature Reviews Endocrinology · doi:10.1038/s41574-020-0386-0 · Cited by 607
Cheng, L., Wang, J., Dai, H., Duan, Y., An, Y., Shi, L., Lv, Y., Li, H., Wang, C., Ma, Q., et al. (2021) · Adipocyte · doi:10.1080/21623945.2020.1870060 · Cited by 404
Metadata
- Authors
- Kolumam, G., Chen, M. Z., Tong, R., Zavala-Solorio, J., Kates, L., van Bruggen, N., Ross, J., Wyatt, S. K., Gandham, V. D., Carano, R. A. D., Dunshee, D. R., Wu, A.-L., Haley, B., Anderson, K., Warming, S., Rairdan, X. Y., Lewin-Koh, N., Zhang, Y., Gutierrez, J., Baruch, A., Gelzleichter, T. R., Stevens, D., Rajan, S., Bainbridge, T. W., Vernes, J.-M., Meng, Y. G., Ziai, J., Soriano, R. H., Brauer, M. J., Chen, Y., Stawicki, S., Kim, H. S., Comps-Agrar, L., Luis, E., Spiess, C., Wu, Y., Ernst, J. A., McGuinness, O. P., Peterson, A. S., & Sonoda, J.
- Affiliations
- Genentech (US)
- Vanderbilt University (US)
- Corresponding author
- Sonoda, Junichiro
- ORCID
- Kolumam, Ganesh
- Tong, Raymond
- Gandham, Vineela D.
- Carano, Richard A.D.
- Dunshee, Diana Ronai
- Haley, Benjamin
- Anderson, Keith
- Warming, Søren
- Zhang, Yingnan
- Baruch, Amos
- Bainbridge, Travis W.
- Meng, Y. Gloria
- Ziai, James
- Brauer, Matthew J.
- Chen, Yongmei
- Kim, Hok Seon
- Spiess, Christoph
- Wu, Yan
- McGuinness, Owen P.
- Peterson, Andrew S.
- Venue
- EBioMedicine
- Publisher
- Elsevier BV
- Published
- 2015-07
- Volume
- 2
- Issue
- 7
- Pages
- 730-743
- ISSN
- 2352-3964 (ISSN-L)
- PMC
- PMC4534681
- OpenAlex
- W2156319327
- Cited by
- 108
- References
- 58
- Citations by year
- 2026: 3 · 2025: 7 · 2024: 12 · 2023: 5 · 2022: 13 · 2021: 12 · 2020: 9 · 2019: 8 · 2018: 12 · 2017: 13 · 2016: 10 · 2015: 4
- FWCI
- 5.65
- Type
- journal article
- Language
- en
- Open access
- gold
- doi.org
- Licence
- Locations
- EBioMedicine (publishedVersion, cc-by-nc-nd)
- Europe PMC (PubMed Central) (publishedVersion, cc-by-nc-nd)
- PubMed Central (publishedVersion, cc-by-nc-nd)
- PubMed (publishedVersion)
- DOAJ (DOAJ: Directory of Open Access Journals) (submittedVersion, cc-by-sa)
- Funders
- Genentech
- Topics
- Life Sciences › Biochemistry, Genetics and Molecular Biology › Molecular Biology › Fibroblast Growth Factor Research
- Health Sciences › Medicine › Physiology (medical) › Adipose Tissue and Metabolism
- Health Sciences › Medicine › Endocrinology, Diabetes and Metabolism › Adipokines, Inflammation, and Metabolic Diseases
- Keywords
- brown adipose tissue, humanized monoclonal antibody, FGF21, FGF19, energy expenditure, white adipose tissue browning, weight loss, insulin sensitization, high molecular weight adiponectin, obesity, type 2 diabetes, hepatic steatosis, dyslipidemia, hyperglycemia
- MeSH terms
- Klotho Proteins, Animals, Adipose Tissue, Brown, Cell Line, Energy Metabolism, Fibroblast Growth Factors, Humans, Insulin, Macaca fascicularis, Male, Membrane Proteins, Mice, Inbred BALB C, Mice, Inbred C57BL, Mice, Obese, Protein Binding, Weight Loss, Antibodies, Bispecific, Thermogenesis, Receptor, Fibroblast Growth Factor, Type 1, Adiponectin, HEK293 Cells
About these checks
Registry, retraction, Cites and statistics results are computed, not judged, with one exception: a printed reference that no index lists is read once by a model before it counts as a citation error. Claims are extracted by a model and kept only when their quote appears verbatim in the text; each cited source is then checked, with a model’s help, for whether it says what the claim relies on. Those verdicts can be wrong — read the claim’s quote and the cited source before relying on one.
Statistics and arithmetic are recomputed, not judged.
Confidence bands are shown only for fields calibrated on our annotated test set. None is calibrated yet, so no band is shown.
What counts as a claim ›How we measure confidence ›How we check this ›
Are you an author, or do you see a problem with this page? Request a review
