

The DOI matches its Crossref record; 82 of the 82 references it cites were found in a registry or an index; 16 of the 35 sources its claims cite were checked for support.
Endosomal protein DENND10 promotes developmental competence of neurite extension
Open accessAbstract
A distinguishing feature of neurons is the presence of long neurites that enable far-reaching communication. Establishing this complex morphology requires precise regulation of intracellular transport and signaling. Our study identifies DENND10, an ancient endosomal protein, as a crucial factor in shaping neuron morphology. DENND10 is a potential regulator of Rab GTPase signaling and interacts with the CCC/Retriever endosomal complex. Loss of DENND10 in a neuronal cell culture model resulted in shortened neurites. Quantitative proteomics revealed two distinct processes of neurite outgrowth: differentiation-induced biochemical changes and a pre-existing vesicular transport system modulated by DENND10. Mechanistically, both Rab27 and CCC complex subunit CCDC22 act downstream of DENND10 to support neurite extension. In primary cortical neurons, loss of DENND10 or CCDC22 led to shortened dendrites and impaired axon development. These findings provide a conceptual framework for neuronal morphogenesis during differentiation and highlight the critical role of DENND10/CCC in neurite extension.
Overview
AI snapshot
Written from the paper’s full text.
TL;DR
DENND10, an endosomal protein and CCC/Retriever subunit, is required for neurite extension in CAD cells and primary cortical neurons. Its loss shortens neurites/dendrites and impairs axon development, with Rab27 and CCDC22 acting downstream.
Key findings
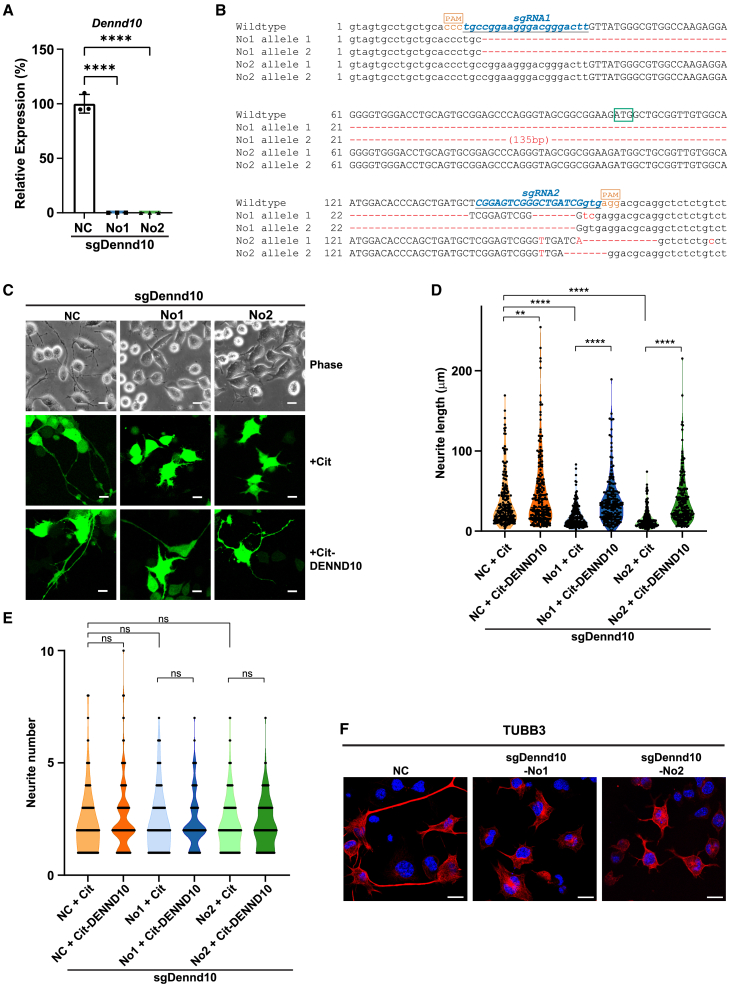
- Dennd10 knockout in CAD cells shortened neurites to approximately 34% (sgDennd10_No1) and 24% (sgDennd10_No2) of non-targeting control lengths, without significantly changing neurite number; re-expression of Citrine-DENND10 rescued the defect, and DENND10 overexpression increased neurite length by ∼20% in control cells.
- TMT proteomics identified 6,997 proteins (6,910 quantifiable) and revealed two largely orthogonal processes: differentiation-induced biochemical changes (e.g., cell cycle exit and lipid biosynthesis) and a pre-existing vesicular transport system modulated by DENND10; two-way ANOVA found 4,046 genotype-associated, 3,683 differentiation-associated, and 139 interaction-associated proteins at FDR <0.05.
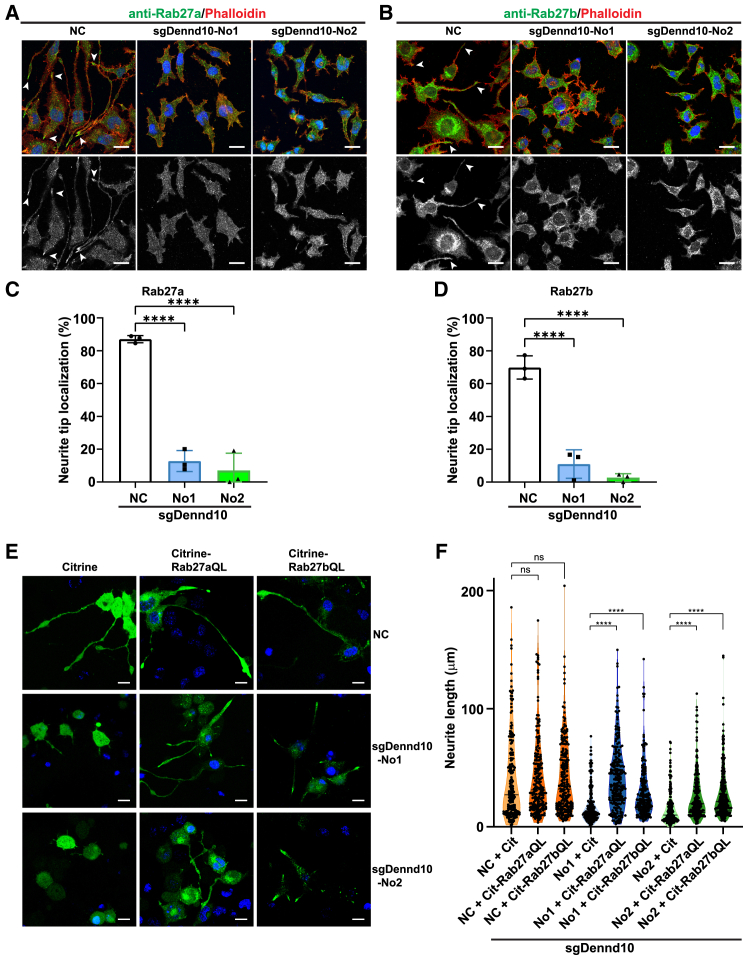
- Rab27a/Rab27b localization at neurite tips was markedly reduced in sgDennd10 cells, and GTP-locked Rab27a-QL or Rab27b-QL mutants significantly extended neurites in sgDennd10 cells.
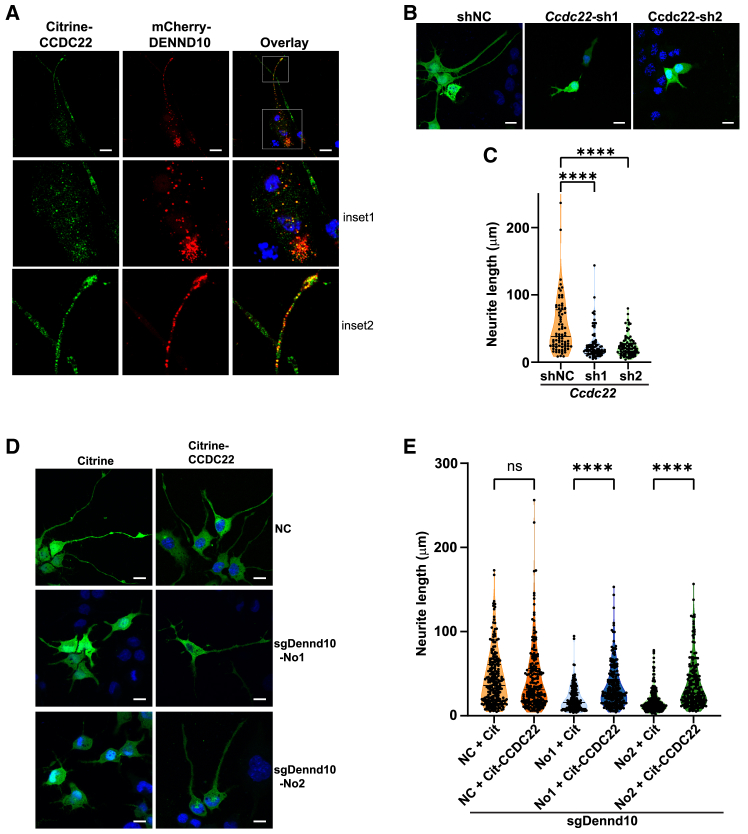
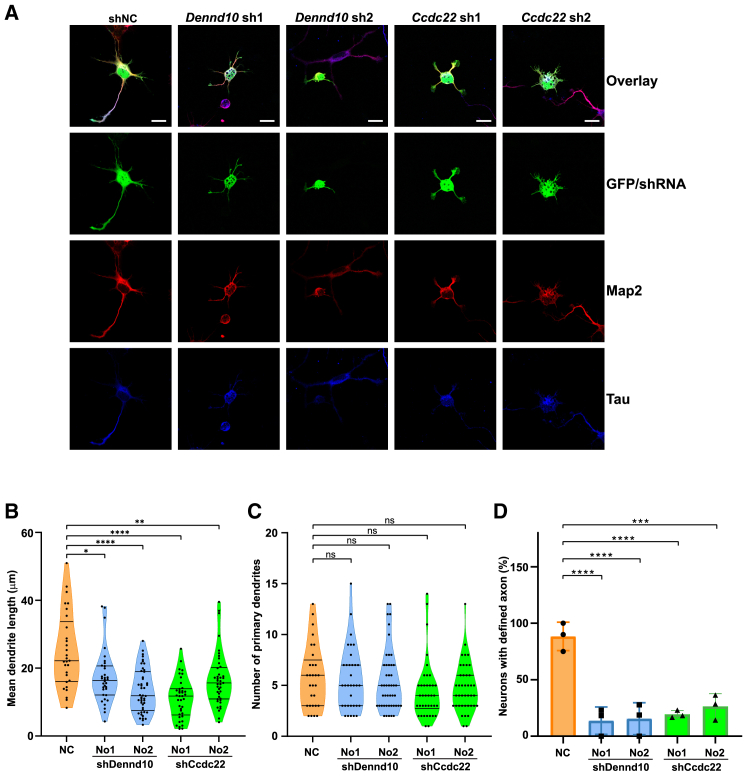
- CCDC22 knockdown reduced neurite length to 47% and 43% of control, CCDC22 overexpression rescued neurite outgrowth in sgDennd10 cells, and the DENND10-overexpression effect was abolished by Ccdc22 knockdown; in primary cortical neurons, Dennd10 or Ccdc22 shRNA shortened dendrites and only 14%–26% developed a single dominant Tau+ axon versus ∼88% of controls.
Methods
- Mouse CAD cells were edited with lentivirus-mediated CRISPR/Cas9 using dual sgRNAs targeting Dennd10 Exon_1, yielding two clonal lines (sgDennd10_No1 and sgDennd10_No2); shRNA knockdown and plasmid rescue/overexpression were also used. Primary cortical neurons were prepared from E18 C57BL/6J mouse embryos and transfected with GFP/shRNA plasmids.
- TMT-16plex quantitative mass spectrometry was performed on NC and sgDennd10_No2 CAD cells in non-differentiated and differentiated states, with three biological replicates per condition (12 samples total); proteins were analyzed by two-way ANOVA (∼ Genotype + Differentiation + Genotype: Differentiation), GO enrichment, STRING, and Cytoscape.
- Neurite length was measured as the longest neurite per cell using ImageJ; primary neuron dendrites and axons were identified by Map2 and Tau staining and measured with NeuroJ. Western blotting, qRT-PCR, immunofluorescence, and anti-FLAG immunoprecipitation coupled to mass spectrometry were used for validation and interaction screening.
Limitations
- The paper states that DENND10’s GEF activity for Rabs or other small GTPases remains to be fully characterized, that an indirect effect on Rab27 activation via other small GTPases cannot be ruled out, and that the precise mechanisms of DENND10 within the CCC complex require further investigation.
- The text notes that sgDennd10_No2 contains low levels of C-terminal DENND10 peptides likely from truncated protein produced by cryptic alternative splicing, so it is a hypomorphic rather than complete knockout; this may limit full rescue by Rab27-QL.
- Evident from the study design: most mechanistic work uses CAD cells, which the authors note are not polarized into dendrites and axons, and primary neuron experiments were limited to two days in culture; no in vivo animal model is reported.
Model-written summary. Check it against the paper before relying on it.
Integrity signals
Registry
Cites
Statistics
Figures
Verification
Claims the paper makes
61 Own result · 34 Own interpretation · 12 Own method · 11 Not checked yet · 5 Supported · 4 Partly supported · 4 No full text of the sources · 3 No basis given · 2 Supported so far · accuracy not yet measured
Every source the paper cites for this claim was checked and supports it.
In the paper
“Notably, the putative Rab binding surface of DENND10 seems to overlap with its binding surface for CCDC22/CCDC93,25,26,27 suggesting potential competition or a “hand-over” mechanism.”
§ Endosomal protein DENND10 promotes developmental competence of neurite extension > Discussion
What the sources say
- Supportedcites [25] Laulumaa S. Kumpula E.P. Huiskonen J.T. Varjosalo M. Structure and interactions of the endogenous human Commander complex Nat. Struct. Mol. Biol. 31 2024 925 938 10.1038/s41594-024-01246-1 38459129 PMC11189303 source
The Results section (‘DENND10 and Retriever are scaffolded by CCDC22 and CCDC93’) identifies DENND10’s interface with the CCDC22/93 coils and states that the putative Rab-binding site is occupied by the I-coil. This supports the claimed apparent overlap; the proposed competition or ‘hand-over’ mechanism is the citing authors’ inference. (LLM, conf=0.91)
- Supportedcites [26] Boesch D.J. Singla A. Han Y. Kramer D.A. Liu Q. Suzuki K. Juneja P. Zhao X. Long X. Medlyn M.J. Structural organization of the retriever-CCC endosomal recycling complex Nat. Struct. Mol. Biol. 31 2024 910 924 10.1038/s41594-023-01184-4 38062209 PMC11260360 source
The Results section states that CCDC22–CCDC93 partially blocks DENND10’s probable GTPase-binding surface. Extended Data Fig. 6D explicitly describes partial overlap between the putative Rab-binding surface and the CCDC22–CCDC93-binding surface; the claim preserves that uncertainty. (LLM, conf=0.94)
- Supportedcites [27] Healy M.D. McNally K.E. Butkovič R. Chilton M. Kato K. Sacharz J. McConville C. Moody E.R.R. Shaw S. Planelles-Herrero V.J. Structure of the endosomal Commander complex linked to Ritscher-Schinzel syndrome Cellule 186 2023 2219 2237 10.1016/j.cell.2023.04.003 PMC10187114 37172566 source
The Results section states that comparison with the DENND1B–RAB35 complex suggests CCDC22/CCDC93 bind DENND10 using an overlapping surface (Figure S6D). The Discussion likewise says the CCDC22–CCDC93 interface would preclude Rab binding in the same region. These passages support the claim’s tentative wording. (LLM, conf=0.94)
hedgedcorrelational- Asserted: passes — The authors put it forward as true.
- Checkable: passes — It can be checked against evidence.
- Load-bearing: unclear — It is unclear whether the paper’s conclusions depend on it.
- Based: passes — The paper gives a reason why it holds.
- Supported
The cited sources support only part of this claim — read each source’s verdict below.
In the paper
“These findings demonstrate that DENND10 associates specifically and reproducibly with the CCC/Retriever endosomal complexes.”
- Also stated in: § Discussion · boosted
“Consistent with findings from other groups,25,26,27 our study demonstrated that DENND10 interacts with CCC/Retriever complex with high specificity.”
§ Endosomal protein DENND10 promotes developmental competence of neurite extension > Results > Dennd10 deficiency could be rescued by CCC complex subunit CCDC22
What the sources say
- Partly supportedcites [25] Laulumaa S. Kumpula E.P. Huiskonen J.T. Varjosalo M. Structure and interactions of the endogenous human Commander complex Nat. Struct. Mol. Biol. 31 2024 925 938 10.1038/s41594-024-01246-1 38459129 PMC11189303 sourceExperimental — accuracy not yet measured
The Results section, “DENND10 and Retriever are scaffolded by CCDC22 and CCDC93” (page unavailable), identifies a defined DENND10 binding site on the CCDC22/93 scaffold; the Discussion says DENND10 is stably bound there. This supports association with the Commander complex, which includes CCC and Retriever, but the cited passages do not establish that the association was reproducible across experiments. (LLM, conf=0.82)
- Supportedcites [26] Boesch D.J. Singla A. Han Y. Kramer D.A. Liu Q. Suzuki K. Juneja P. Zhao X. Long X. Medlyn M.J. Structural organization of the retriever-CCC endosomal recycling complex Nat. Struct. Mol. Biol. 31 2024 910 924 10.1038/s41594-023-01184-4 38062209 PMC11260360 source
The Results section, “DENND10 binds directly to the CCDC22-CCDC93 dimer,” reports consistent predictions of specific binding and validates the association with pull-down, co-immunoprecipitation, and purified-protein assays. It specifies that DENND10 binds directly to the CCC scaffold, while its association with Retriever is indirect. (LLM, conf=0.94)
- Supportedcites [27] Healy M.D. McNally K.E. Butkovič R. Chilton M. Kato K. Sacharz J. McConville C. Moody E.R.R. Shaw S. Planelles-Herrero V.J. Structure of the endosomal Commander complex linked to Ritscher-Schinzel syndrome Cellule 186 2023 2219 2237 10.1016/j.cell.2023.04.003 PMC10187114 37172566 source
The Results section reports that proteomic analyses routinely identified DENND10 as a Commander subunit and that it binds the CCC proteins CCDC22 and CCDC93; mutations at the predicted interface reduced or abolished binding. The Introduction describes those proteins as linking the CCC complex to Retriever within Commander, supporting the claimed association with the CCC/Retriever assembly. (LLM, conf=0.90)
boostedcorrelational- Asserted: passes — The authors put it forward as true.
- Checkable: passes — It can be checked against evidence.
- Load-bearing: passes — The paper’s conclusions depend on it.
- Based: passes — The paper gives a reason why it holds.
- Also stated in: § Discussion · boosted
The sources with a verdict support this claim; the rest weren’t checked yet, have no full text we could read, or their verdicts aren’t rated yet.
In the paper
“DENND10 is a potential regulator of Rab GTPase signaling and interacts with the CCC/Retriever endosomal complex.”
- Also stated in: § Introduction · boosted
“DENND10 has recently been identified as an integral subunit of the CCC/Retriever complex on endosomes in several structural studies.25,26,27”
§ Endosomal protein DENND10 promotes developmental competence of neurite extension > Abstract
What the sources say
- Not checked yetcites [25] Laulumaa S. Kumpula E.P. Huiskonen J.T. Varjosalo M. Structure and interactions of the endogenous human Commander complex Nat. Struct. Mol. Biol. 31 2024 925 938 10.1038/s41594-024-01246-1 38459129 PMC11189303 source
Checked before — its earlier verdict is held back until a new check runs.
- Supportedcites [26] Boesch D.J. Singla A. Han Y. Kramer D.A. Liu Q. Suzuki K. Juneja P. Zhao X. Long X. Medlyn M.J. Structural organization of the retriever-CCC endosomal recycling complex Nat. Struct. Mol. Biol. 31 2024 910 924 10.1038/s41594-023-01184-4 38062209 PMC11260360 source
The Results section (‘DENND10 binds directly to the CCDC22-CCDC93 dimer’) reports a direct interaction with the CCC scaffold and an indirect interaction with Retriever mediated by that scaffold (Fig. 6A). The ‘Overall model of the Retriever-CCC assembly’ section also identifies DENND10 as a component connected to Retriever through CCDC22-CCDC93 (Fig. 8A). (LLM, conf=0.94)
- Supportedcites [27] Healy M.D. McNally K.E. Butkovič R. Chilton M. Kato K. Sacharz J. McConville C. Moody E.R.R. Shaw S. Planelles-Herrero V.J. Structure of the endosomal Commander complex linked to Ritscher-Schinzel syndrome Cellule 186 2023 2219 2237 10.1016/j.cell.2023.04.003 PMC10187114 37172566 source
The Introduction identifies DENND10 as a subunit of Commander, which comprises the CCC and Retriever complexes. The Results section further reports that DENND10 binds the CCC proteins CCDC22 and CCDC93 and precipitates Commander subunits in cells. (LLM, conf=0.94)
boostedcorrelational- Asserted: passes — The authors put it forward as true.
- Checkable: passes — It can be checked against evidence.
- Load-bearing: passes — The paper’s conclusions depend on it.
- Based: passes — The paper gives a reason why it holds.
- Also stated in: § Introduction · boosted
A result the paper reports from its own data — it cites no other source for it, so there is none to check. The quote shows it is in the paper.
In the paper
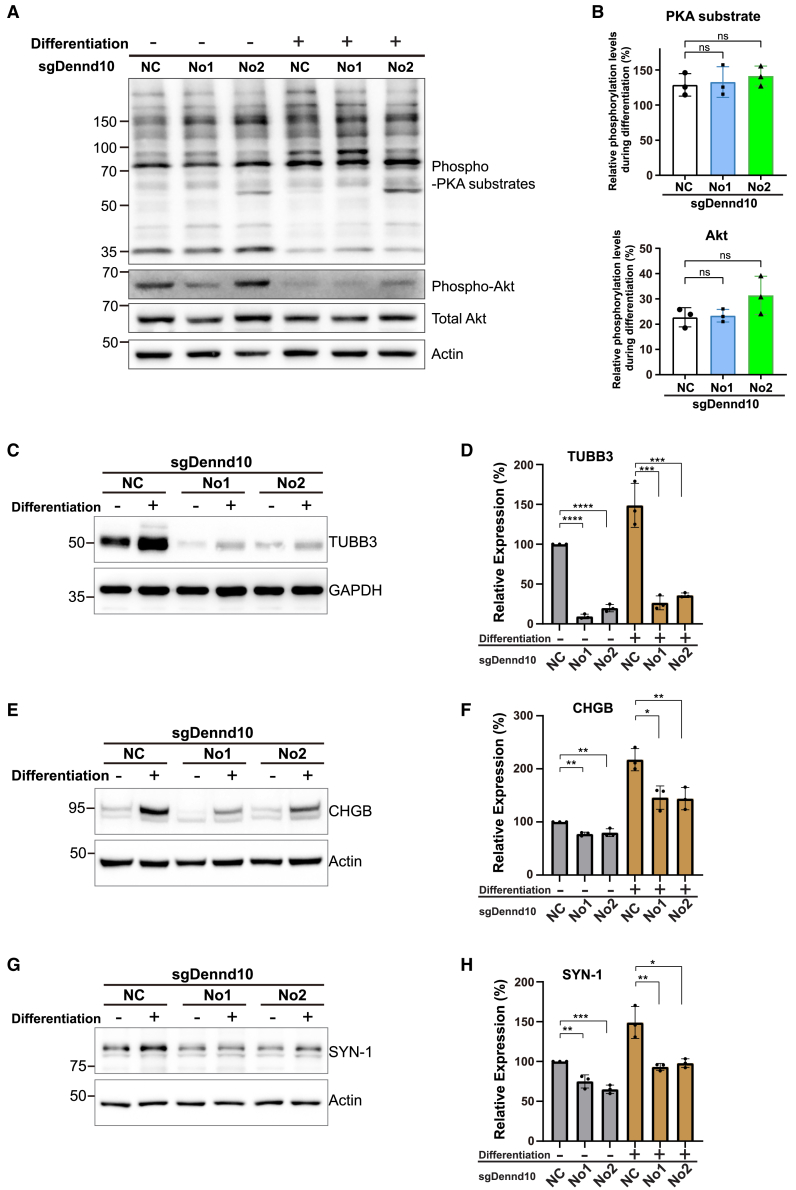
“Multiple proteins involved in vesicle exocytosis and cytoskeleton organization, such as TUBB3, CHGB, and SYN-1, were decreased in both conditions (Figures 3C–3H).”
§ Endosomal protein DENND10 promotes developmental competence of neurite extension > Discussion
plaindirect- Asserted: passes — The authors put it forward as true.
- Checkable: passes — It can be checked against evidence.
- Load-bearing: passes — The paper’s conclusions depend on it.
- Based: passes — The paper gives a reason why it holds.
A result the paper reports from its own data — it cites no other source for it, so there is none to check. The quote shows it is in the paper.
In the paper
“We found that the expression of either Rab27a-QL or Rab27b-QL mutant significantly extended neurite lengths in both sgDennd10 cell lines (Figure 4F).”
- Also stated in: § Discussion · hedged
“and that constitutively active Rab27-QL mutants could rescue neurite growth in sgDennd10 neurons.”
§ Endosomal protein DENND10 promotes developmental competence of neurite extension > Results > Rab27 activation is impaired in Dennd10-deficient neurons
plaindirect- Asserted: passes — The authors put it forward as true.
- Checkable: passes — It can be checked against evidence.
- Load-bearing: passes — The paper’s conclusions depend on it.
- Based: passes — The paper gives a reason why it holds.
- Also stated in: § Discussion · hedged
A result the paper reports from its own data — it cites no other source for it, so there is none to check. The quote shows it is in the paper.
In the paper
“First, differentiation treatment induces similar changes in Dennd10-deficient cells and NC cells.”
§ Endosomal protein DENND10 promotes developmental competence of neurite extension > Discussion
plain- Asserted: passes — The authors put it forward as true.
- Checkable: passes — It can be checked against evidence.
- Load-bearing: passes — The paper’s conclusions depend on it.
- Based: passes — The paper gives a reason why it holds.
A result the paper reports from its own data — it cites no other source for it, so there is none to check. The quote shows it is in the paper.
In the paper
“A similar reduction in neurite length was observed with two independent plasmid-based short hairpin RNA (shRNA) constructs targeting Dennd10 (Figures S1A–S1C).”
§ Endosomal protein DENND10 promotes developmental competence of neurite extension > Results > DENND10 is involved in neurite extension
plaindirect- Asserted: passes — The authors put it forward as true.
- Checkable: passes — It can be checked against evidence.
- Load-bearing: passes — The paper’s conclusions depend on it.
- Based: passes — The paper gives a reason why it holds.
A result the paper reports from its own data — it cites no other source for it, so there is none to check. The quote shows it is in the paper.
In the paper
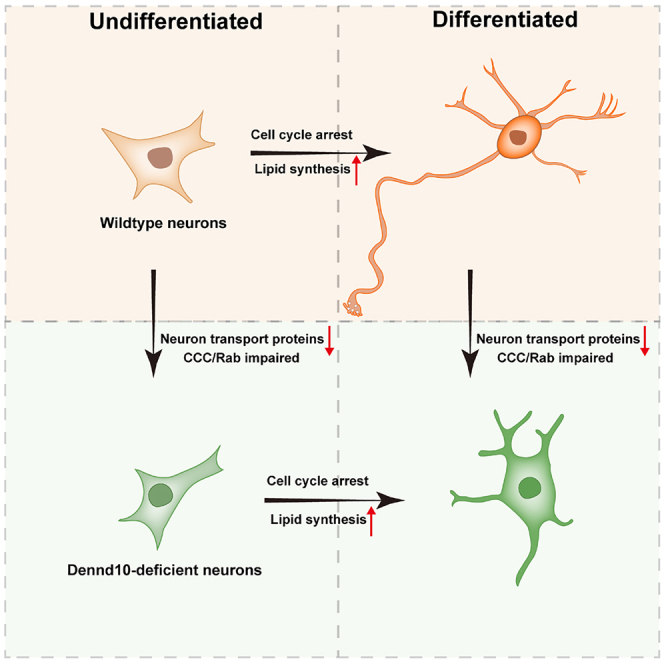
“Quantitative proteomics revealed two distinct processes of neurite outgrowth: differentiation-induced biochemical changes and a pre-existing vesicular transport system modulated by DENND10.”
§ Endosomal protein DENND10 promotes developmental competence of neurite extension > Abstract
plain- Asserted: passes — The authors put it forward as true.
- Checkable: passes — It can be checked against evidence.
- Load-bearing: passes — The paper’s conclusions depend on it.
- Based: passes — The paper gives a reason why it holds.
A result the paper reports from its own data — it cites no other source for it, so there is none to check. The quote shows it is in the paper.
In the paper
“However, in sgDennd10 cells, their localization in neurite tips was markedly reduced (Figures 4A–4D)”
§ Endosomal protein DENND10 promotes developmental competence of neurite extension > Results > Rab27 activation is impaired in Dennd10-deficient neurons
plaindirect- Asserted: passes — The authors put it forward as true.
- Checkable: passes — It can be checked against evidence.
- Load-bearing: passes — The paper’s conclusions depend on it.
- Based: passes — The paper gives a reason why it holds.
A result the paper reports from its own data — it cites no other source for it, so there is none to check. The quote shows it is in the paper.
In the paper
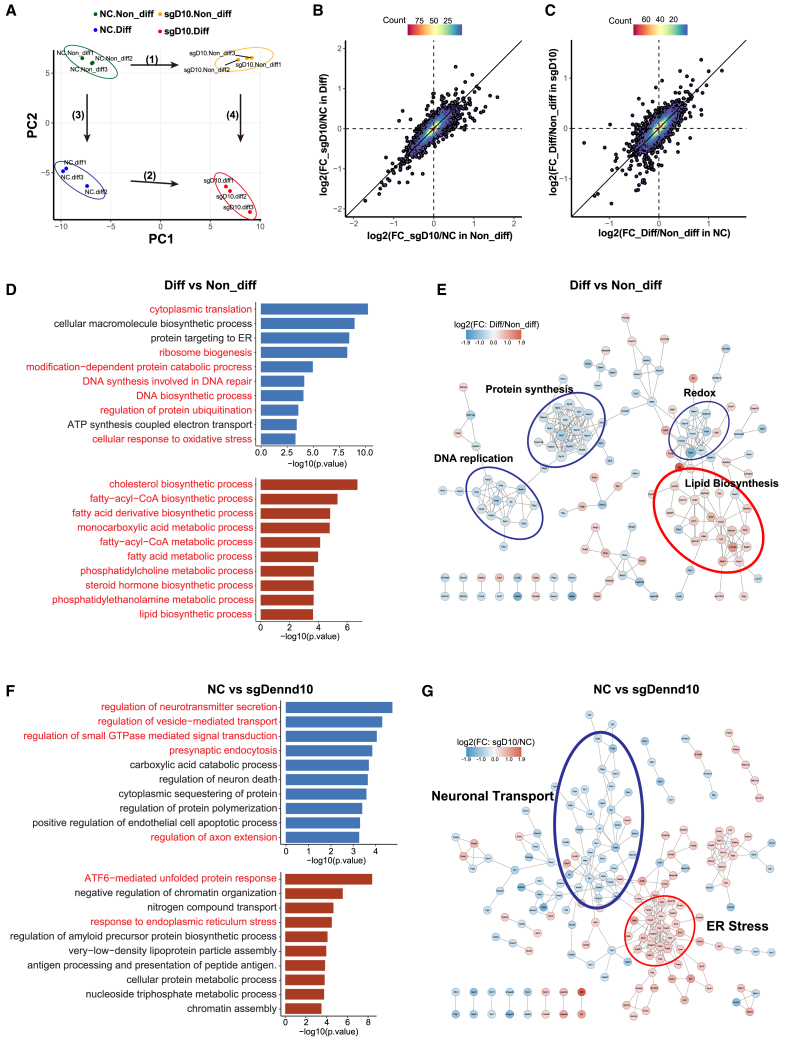
“Importantly, these biochemical changes occurred largely independently of DENND10, displaying similar patterns in both NC and sgDennd10 cells (Figure 2C)”
§ Endosomal protein DENND10 promotes developmental competence of neurite extension > Results > Changes in proteomic landscape during neurite outgrowth
plain- Asserted: passes — The authors put it forward as true.
- Checkable: passes — It can be checked against evidence.
- Load-bearing: unclear — It is unclear whether the paper’s conclusions depend on it.
- Based: passes — The paper gives a reason why it holds.
- Probably not a substantial claim. 35
- It may state two separate claims as one. 30
- The quote only partly states this claim. 1
Every source the paper cites for this claim was checked and supports it.
In the paper
“Previous studies reported that CCDC22 interacts with CAMSAP2, a microtubule-organizing protein involved in dendrite development,25”
§ Endosomal protein DENND10 promotes developmental competence of neurite extension > Results > Dennd10 deficiency could be rescued by CCC complex subunit CCDC22
What the sources say
- Supportedcites [25] Laulumaa S. Kumpula E.P. Huiskonen J.T. Varjosalo M. Structure and interactions of the endogenous human Commander complex Nat. Struct. Mol. Biol. 31 2024 925 938 10.1038/s41594-024-01246-1 38459129 PMC11189303 source
The Results section (‘Commander assembles into a hetero-hexadecameric complex’) explicitly says that CCDC22 interacts with CAMSAP2 and describes CAMSAP2 as a microtubule-organizing protein that functions in dendrite development. (LLM, conf=0.95)
plaincorrelational- Asserted: passes — The authors put it forward as true.
- Checkable: passes — It can be checked against evidence.
- Load-bearing: passes — The paper’s conclusions depend on it.
- Based: passes — The paper gives a reason why it holds.
Probably not a substantial claim.
- Supported
Every source the paper cites for this claim was checked and supports it.
In the paper
“This region is inherently flexible and exhibits high conformational heterogeneity, suggesting its potential role as a regulatory site.25”
§ Endosomal protein DENND10 promotes developmental competence of neurite extension > Discussion
What the sources say
- Supportedcites [25] Laulumaa S. Kumpula E.P. Huiskonen J.T. Varjosalo M. Structure and interactions of the endogenous human Commander complex Nat. Struct. Mol. Biol. 31 2024 925 938 10.1038/s41594-024-01246-1 38459129 PMC11189303 source
The Results section (‘DENND10 and Retriever are scaffolded by CCDC22 and CCDC93’; page unavailable) calls the region around DENND10’s putative Rab-binding site inherently flexible, and another Results passage reports conformational heterogeneity in this region. The Discussion (page unavailable) speculates that COMMD1 may regulate the site’s availability through allostery, consistent with the claim’s tentative wording. (LLM, conf=0.88)
hedged- Asserted: passes — The authors put it forward as true.
- Checkable: passes — It can be checked against evidence.
- Load-bearing: fails — The paper’s conclusions may not depend on it.
- Based: passes — The paper gives a reason why it holds.
Probably not a substantial claim. The paper’s conclusions may not depend on it. It may state two separate claims as one.
- Supported
The cited sources support only part of this claim — read each source’s verdict below.
In the paper
“its depletion has been shown to impair the sorting of Retromer cargoes.32”
§ Endosomal protein DENND10 promotes developmental competence of neurite extension > Introduction
What the sources say
- Partly supportedcites [32] Singla A. Fedoseienko A. Giridharan S.S.P. Overlee B.L. Lopez A. Jia D. Song J. Huff-Hardy K. Weisman L. Burstein E. Billadeau D.D. Endosomal PI(3)P regulation by the COMMD/CCDC22/CCDC93 (CCC) complex controls membrane protein recycling Nat. Commun. 10 2019 4271 10.1038/s41467-019-12221-6 31537807 PMC6753146 sourceExperimental — accuracy not yet measured
The Results section (‘CCC loss leads to retriever-independent recycling defects’; page unavailable) reports that FAM45A deletion causes the retromer cargo GLUT1 to accumulate in early endosomes, supporting impaired sorting. The Discussion also describes an effect of FAM45A on retromer-mediated recycling. Our copy does not identify FAM45A as DENND10, so it does not establish that the reported depletion was of the protein named in the claim. (LLM, conf=0.78)
plaindirect- Asserted: passes — The authors put it forward as true.
- Checkable: passes — It can be checked against evidence.
- Load-bearing: fails — The paper’s conclusions may not depend on it.
- Based: passes — The paper gives a reason why it holds.
Probably not a substantial claim. The paper’s conclusions may not depend on it.
- Partly supported
Every source the paper cites for this claim was checked and supports it.
In the paper
“Interestingly, it was reported that DENND10/FAM45A knockout in HeLa cells did not affect the trafficking of integrin β1, a typical Retriever cargo, but instead perturbed cargo recycling of the related Retromer complex.32”
§ Endosomal protein DENND10 promotes developmental competence of neurite extension > Discussion
What the sources say
- Supportedcites [32] Singla A. Fedoseienko A. Giridharan S.S.P. Overlee B.L. Lopez A. Jia D. Song J. Huff-Hardy K. Weisman L. Burstein E. Billadeau D.D. Endosomal PI(3)P regulation by the COMMD/CCDC22/CCDC93 (CCC) complex controls membrane protein recycling Nat. Commun. 10 2019 4271 10.1038/s41467-019-12221-6 31537807 PMC6753146 source
The Results section, “CCC loss leads to retriever-independent recycling defects,” reports that FAM45A deletion did not affect integrin β1 trafficking in HeLa cells. The same section reports that FAM45A deletion caused accumulation of GLUT1, a retromer cargo, in early endosomes. Page numbers were not provided in our copy. (LLM, conf=0.94)
plaindirect- Asserted: passes — The authors put it forward as true.
- Checkable: passes — It can be checked against evidence.
- Load-bearing: fails — The paper’s conclusions may not depend on it.
- Based: passes — The paper gives a reason why it holds.
Probably not a substantial claim. The paper’s conclusions may not depend on it. It may state two separate claims as one.
- Supported
Every source the paper cites for this claim was checked and supports it.
In the paper
“Endosomal recruitment of the Retromer requires Rab5 and Rab7.73”
§ Endosomal protein DENND10 promotes developmental competence of neurite extension > Discussion
What the sources say
- Supportedcites [73] Rojas R. van Vlijmen T. Mardones G.A. Prabhu Y. Rojas A.L. Mohammed S. Heck A.J.R. Raposo G. van der Sluijs P. Bonifacino J.S. Regulation of retromer recruitment to endosomes by sequential action of Rab5 and Rab7 J. Cell Biol. 183 2008 513 526 10.1083/jcb.200804048 18981234 PMC2575791 source
The Introduction states that Rab5 and Rab7 act sequentially to enable retromer recruitment to endosomes. The Abstract likewise says they act in concert to regulate that recruitment. (LLM, conf=0.94)
plaindirect- Asserted: passes — The authors put it forward as true.
- Checkable: passes — It can be checked against evidence.
- Load-bearing: fails — The paper’s conclusions may not depend on it.
- Based: passes — The paper gives a reason why it holds.
Probably not a substantial claim. The paper’s conclusions may not depend on it.
- Supported
The cited sources support only part of this claim — read each source’s verdict below.
In the paper
“For instance, a previous RNA-seq analysis on CAD differentiation identified an up-regulation of Acss2 mRNA, which produces a nuclear pool of acetyl-CoA and promotes histone acetylation, facilitating the expression of neuron-specific genes.45”
§ Endosomal protein DENND10 promotes developmental competence of neurite extension > Discussion
What the sources say
- Partly supportedcites [45] Mews P. Donahue G. Drake A.M. Luczak V. Abel T. Berger S.L. Acetyl-CoA synthetase regulates histone acetylation and hippocampal memory Nature 546 2017 381 386 10.1038/nature22405 28562591 PMC5505514 sourceExperimental — accuracy not yet measured
The Results (‘ACSS2 regulates neuronal gene expression’) report increased nuclear ACSS2 protein during CAD differentiation, while the Results (‘ACSS2 is recruited to transcriptionally active chromatin’) link ACSS2 to increased histone acetylation and neuronal-gene expression. The paper also describes ACSS2 as a source of nuclear acetyl-CoA. However, its RNA-seq account and Extended Data Figure 2 do not identify an up-regulation of Acss2 mRNA specifically; that part of the claim is unsupported by our copy. (LLM, conf=0.88)
plaindirect- Asserted: passes — The authors put it forward as true.
- Checkable: passes — It can be checked against evidence.
- Load-bearing: fails — The paper’s conclusions may not depend on it.
- Based: passes — The paper gives a reason why it holds.
Probably not a substantial claim. The paper’s conclusions may not depend on it. It may state two separate claims as one.
- Partly supported
The cited sources support only part of this claim — read each source’s verdict below.
In the paper
“It should be added that low levels of peptides from the C-terminal DENND10 sequence were detected in sgDennd10_No2 by mass spectrometry (see below, Table S1), likely due to truncated protein expression from cryptic alternative splicing events, a phenomenon observed in approximately 50% of CRISPR-edited cells.50”
§ Endosomal protein DENND10 promotes developmental competence of neurite extension > Results > DENND10 is involved in neurite extension
What the sources say
- Partly supportedcites [50] Tuladhar R. Yeu Y. Tyler Piazza J. Tan Z. Rene Clemenceau J. Wu X. Barrett Q. Herbert J. Mathews D.H. Kim J. CRISPR-Cas9-based mutagenesis frequently provokes on-target mRNA misregulation Nat. Commun. 10 2019 4056 10.1038/s41467-019-12028-5 31492834 PMC6731291 sourceExperimental — accuracy not yet measured
The Results section (‘Unanticipated gene expression outcomes with CRISPR editing’; page unavailable) reports unexpected protein-expression or mRNA-splicing changes in approximately 50% of the CRISPR-edited cell lines studied. It does not say cryptic alternative splicing occurred in 50%: some novel proteins were attributed to alternative translation initiation. The citation supports the general phenomenon, not the DENND10-specific mass-spectrometry finding or the stated frequency for splicing. (LLM, conf=0.88)
hedgedconditionalSingle case- Asserted: passes — The authors put it forward as true.
- Checkable: passes — It can be checked against evidence.
- Load-bearing: unclear — It is unclear whether the paper’s conclusions depend on it.
- Based: passes — The paper gives a reason why it holds.
It may state two separate claims as one.
- Partly supported
The sources with a verdict support this claim; the rest weren’t checked yet, have no full text we could read, or their verdicts aren’t rated yet.
In the paper
“Missense mutations in CCDC22 have been associated with intellectual disability.37,38”
§ Endosomal protein DENND10 promotes developmental competence of neurite extension > Results > Dennd10 deficiency could be rescued by CCC complex subunit CCDC22
What the sources say
- Supportedcites [37] Voineagu I. Huang L. Winden K. Lazaro M. Haan E. Nelson J. McGaughran J. Nguyen L.S. Friend K. Hackett A. CCDC22: a novel candidate gene for syndromic X-linked intellectual disability Mol. Psychiatr. 17 2012 4 7 10.1038/mp.2011.95 PMC3586744 21826058 source
The main text (page not provided) identifies CCDC22 c.49A>G/p.T17A as a missense variant in a family with X-linked intellectual disability and reports that it segregates with the disease. The claim says 'associated,' which reflects the paper's presentation of CCDC22 as a candidate gene rather than an established cause. (LLM, conf=0.92)
- Not checked yetcites [38] Kolanczyk M. Krawitz P. Hecht J. Hupalowska A. Miaczynska M. Marschner K. Schlack C. Emmerich D. Kobus K. Kornak U. Missense variant in CCDC22 causes X-linked recessive intellectual disability with features of Ritscher-Schinzel/3C syndrome Eur. J. Hum. Genet. 23 2015 633 638 10.1038/ejhg.2014.109 24916641 PMC4402616
plaincorrelational- Asserted: passes — The authors put it forward as true.
- Checkable: passes — It can be checked against evidence.
- Load-bearing: fails — The paper’s conclusions may not depend on it.
- Based: passes — The paper gives a reason why it holds.
Probably not a substantial claim. The paper’s conclusions may not depend on it.
- Supported
A result the paper reports from its own data — it cites no other source for it, so there is none to check. The quote shows it is in the paper.
In the paper
“The GDP-locked Rab27a-TN and Rab27b-TN mutants exhibited uniform diffusion throughout the cytoplasm, whereas the GTP-locked Rab27a-QL and Rab27b-QL mutants were enriched at the tip of neurites (Figure S5A)”
§ Endosomal protein DENND10 promotes developmental competence of neurite extension > Results > Rab27 activation is impaired in Dennd10-deficient neurons
plaincorrelational- Asserted: passes — The authors put it forward as true.
- Checkable: passes — It can be checked against evidence.
- Load-bearing: passes — The paper’s conclusions depend on it.
- Based: passes — The paper gives a reason why it holds.
It may state two separate claims as one.
A result the paper reports from its own data — it cites no other source for it, so there is none to check. The quote shows it is in the paper.
In the paper
“In total, 6997 proteins were identified, of which 6910 proteins were quantifiable (Table S1).”
§ Endosomal protein DENND10 promotes developmental competence of neurite extension > Results > Changes in proteomic landscape during neurite outgrowth
plainn = 12- Asserted: passes — The authors put it forward as true.
- Checkable: passes — It can be checked against evidence.
- Load-bearing: fails — The paper’s conclusions may not depend on it.
- Based: passes — The paper gives a reason why it holds.
Probably not a substantial claim. The paper’s conclusions may not depend on it. It may state two separate claims as one.
A result the paper reports from its own data — it cites no other source for it, so there is none to check. The quote shows it is in the paper.
In the paper
“We further focused on DEPs with FC greater than 1.3, which resulted in 363 DEPs for Genotype and 181 DEPs for Differentiation (Table S2).”
§ Endosomal protein DENND10 promotes developmental competence of neurite extension > Results > Changes in proteomic landscape during neurite outgrowth
plain- Asserted: passes — The authors put it forward as true.
- Checkable: passes — It can be checked against evidence.
- Load-bearing: fails — The paper’s conclusions may not depend on it.
- Based: passes — The paper gives a reason why it holds.
Probably not a substantial claim. The paper’s conclusions may not depend on it. It may state two separate claims as one.
A result the paper reports from its own data — it cites no other source for it, so there is none to check. The quote shows it is in the paper.
In the paper
“While the number of neurites tended to decrease in Ccdc22-deficient cells, the change did not reach statistical significance (Figure S7B)”
§ Endosomal protein DENND10 promotes developmental competence of neurite extension > Results > Dennd10 deficiency could be rescued by CCC complex subunit CCDC22
hedged- Asserted: passes — The authors put it forward as true.
- Checkable: passes — It can be checked against evidence.
- Load-bearing: unclear — It is unclear whether the paper’s conclusions depend on it.
- Based: passes — The paper gives a reason why it holds.
It may state two separate claims as one.
A result the paper reports from its own data — it cites no other source for it, so there is none to check. The quote shows it is in the paper.
In the paper
“In sgDennd10_No1, a large deletion encompassing most of Exon_1 was observed, whereas sgDennd10_No2 showed disruption of the 5′ splicing donor site of the subsequent intron (Figure 1B).”
§ Endosomal protein DENND10 promotes developmental competence of neurite extension > Results > DENND10 is involved in neurite extension
plain- Asserted: passes — The authors put it forward as true.
- Checkable: passes — It can be checked against evidence.
- Load-bearing: passes — The paper’s conclusions depend on it.
- Based: passes — The paper gives a reason why it holds.
It may state two separate claims as one.
A result the paper reports from its own data — it cites no other source for it, so there is none to check. The quote shows it is in the paper.
In the paper
“we observed a significant down-regulation of proteins involved in DNA biosynthesis and repair (POLD1, POLD3, POLE, and POLE2)”
- Also stated in: § Changes in proteomic landscape during neurite outgrowth · plain
“Conversely, DEPs that were up-regulated after differentiation were primarily related to lipid metabolism, including enzymes for the biosynthesis of phospholipid (LPCAT3, LPIN1, and PNPLA8), sterol lipids (NSDHL, MSMO1, DHCR7, LSS, and TM7SF2) and long chain fatty acid (TECR, ACSL4, HSD17B8, and AACS)”
§ Endosomal protein DENND10 promotes developmental competence of neurite extension > Results > Changes in proteomic landscape during neurite outgrowth
plaincorrelational- Asserted: passes — The authors put it forward as true.
- Checkable: passes — It can be checked against evidence.
- Load-bearing: unclear — It is unclear whether the paper’s conclusions depend on it.
- Based: passes — The paper gives a reason why it holds.
It may state two separate claims as one. The quote only partly states this claim.
- Also stated in: § Changes in proteomic landscape during neurite outgrowth · plain
A result the paper reports from its own data — it cites no other source for it, so there is none to check. The quote shows it is in the paper.
In the paper
“Additionally, in HeLa cells, mCherry-tagged DENND10 co-localized with Citrine-tagged CCDC22 on cytoplasmic vesicles, a subset of which were positive for endosomal marker CD63 (Figure S6C).”
§ Endosomal protein DENND10 promotes developmental competence of neurite extension > Results > Dennd10 deficiency could be rescued by CCC complex subunit CCDC22
plaincorrelational- Asserted: passes — The authors put it forward as true.
- Checkable: passes — It can be checked against evidence.
- Load-bearing: passes — The paper’s conclusions depend on it.
- Based: passes — The paper gives a reason why it holds.
It may state two separate claims as one.
A result the paper reports from its own data — it cites no other source for it, so there is none to check. The quote shows it is in the paper.
In the paper
“While the number of neurites increased slightly after CCDC22 expression, this change did not reach statistical significance (Figure S7C).”
§ Endosomal protein DENND10 promotes developmental competence of neurite extension > Results > Dennd10 deficiency could be rescued by CCC complex subunit CCDC22
plain- Asserted: passes — The authors put it forward as true.
- Checkable: passes — It can be checked against evidence.
- Load-bearing: unclear — It is unclear whether the paper’s conclusions depend on it.
- Based: passes — The paper gives a reason why it holds.
It may state two separate claims as one.
A result the paper reports from its own data — it cites no other source for it, so there is none to check. The quote shows it is in the paper.
In the paper
“we identified 4046 proteins that were significantly up- or downregulated (FDR <0.05) for the Genotype factor, 3683 proteins significantly altered for the Differentiation factor, and 139 proteins that exhibited significant interaction effects between Genotype and Differentiation (Table S1).”
§ Endosomal protein DENND10 promotes developmental competence of neurite extension > Results > Changes in proteomic landscape during neurite outgrowth
plaincorrelational- Asserted: passes — The authors put it forward as true.
- Checkable: passes — It can be checked against evidence.
- Load-bearing: unclear — It is unclear whether the paper’s conclusions depend on it.
- Based: passes — The paper gives a reason why it holds.
It may state two separate claims as one.
A result the paper reports from its own data — it cites no other source for it, so there is none to check. The quote shows it is in the paper.
In the paper
“It is worth mentioning that the up-regulation of ACSS2 protein was also observed in our proteomic dataset (Table S3).”
§ Endosomal protein DENND10 promotes developmental competence of neurite extension > Discussion
plain- Asserted: passes — The authors put it forward as true.
- Checkable: passes — It can be checked against evidence.
- Load-bearing: fails — The paper’s conclusions may not depend on it.
- Based: passes — The paper gives a reason why it holds.
Probably not a substantial claim. The paper’s conclusions may not depend on it.
A result the paper reports from its own data — it cites no other source for it, so there is none to check. The quote shows it is in the paper.
In the paper
“Intriguingly, these clusters formed a rectangle-like shape on the PCA plot.”
§ Endosomal protein DENND10 promotes developmental competence of neurite extension > Results > Changes in proteomic landscape during neurite outgrowth
plainn = 12- Asserted: passes — The authors put it forward as true.
- Checkable: passes — It can be checked against evidence.
- Load-bearing: fails — The paper’s conclusions may not depend on it.
- Based: passes — The paper gives a reason why it holds.
Probably not a substantial claim. The paper’s conclusions may not depend on it.
A result the paper reports from its own data — it cites no other source for it, so there is none to check. The quote shows it is in the paper.
In the paper
“Additionally, the number of neurites increased to varying degrees upon expression of Rab27-QL mutants (Figure S5B), with Rab27b-QL in sgDennd10 cells showing statistically significant increases”
§ Endosomal protein DENND10 promotes developmental competence of neurite extension > Results > Rab27 activation is impaired in Dennd10-deficient neurons
plaindirect- Asserted: passes — The authors put it forward as true.
- Checkable: passes — It can be checked against evidence.
- Load-bearing: unclear — It is unclear whether the paper’s conclusions depend on it.
- Based: passes — The paper gives a reason why it holds.
It may state two separate claims as one.
A result the paper reports from its own data — it cites no other source for it, so there is none to check. The quote shows it is in the paper.
In the paper
“The first principal component (PC1) displayed a strong correlation with the genotypes (NC vs. sgDennd10), while the second principal component (PC2) was associated with the differentiation condition (Non-diff vs. diff), separating the samples into four distinct clusters.”
§ Endosomal protein DENND10 promotes developmental competence of neurite extension > Results > Changes in proteomic landscape during neurite outgrowth
boostedcorrelationaln = 12- Asserted: passes — The authors put it forward as true.
- Checkable: passes — It can be checked against evidence.
- Load-bearing: passes — The paper’s conclusions depend on it.
- Based: passes — The paper gives a reason why it holds.
It may state two separate claims as one.
The paper states this without a source or data behind it here, so there is nothing to check it against. The quote shows it is in the paper.
In the paper
“In contrast, no significant enhancement was observed in NC cells, likely due to a ceiling effect for Rab27 activation under normal conditions.”
§ Endosomal protein DENND10 promotes developmental competence of neurite extension > Results > Rab27 activation is impaired in Dennd10-deficient neurons
hedged- Asserted: passes — The authors put it forward as true.
- Checkable: passes — It can be checked against evidence.
- Load-bearing: passes — The paper’s conclusions depend on it.
- Based: passes — The paper gives a reason why it holds.
It may state two separate claims as one.
A result the paper reports from its own data — it cites no other source for it, so there is none to check. The quote shows it is in the paper.
In the paper
“In primary cortical neurons, loss of DENND10 or CCDC22 led to shortened dendrites and impaired axon development.”
§ Endosomal protein DENND10 promotes developmental competence of neurite extension > Abstract
plaindirect- Asserted: passes — The authors put it forward as true.
- Checkable: passes — It can be checked against evidence.
- Load-bearing: passes — The paper’s conclusions depend on it.
- Based: passes — The paper gives a reason why it holds.
It may state two separate claims as one.
A result the paper reports from its own data — it cites no other source for it, so there is none to check. The quote shows it is in the paper.
In the paper
“On average, neurite lengths in differentiated sgDennd10_No1 and No2 cells were approximately 34% and 24% of those in NC cells, respectively (Figures 1C and 1D).”
§ Endosomal protein DENND10 promotes developmental competence of neurite extension > Results > DENND10 is involved in neurite extension
plaincorrelational- Asserted: passes — The authors put it forward as true.
- Checkable: passes — It can be checked against evidence.
- Load-bearing: passes — The paper’s conclusions depend on it.
- Based: passes — The paper gives a reason why it holds.
It may state two separate claims as one.
In the paper
“TUBB3, a neuron-specific cytoskeletal protein required for neurite extension,51 was predominantly localized to the neurites in NC cells but was mainly confined to the soma in sgDennd10 cells (Figure 1F).”
§ Endosomal protein DENND10 promotes developmental competence of neurite extension > Results > DENND10 is involved in neurite extension
What the sources say
- Not checked yetcites [51] Latremoliere A. Cheng L. DeLisle M. Wu C. Chew S. Hutchinson E.B. Sheridan A. Alexandre C. Latremoliere F. Sheu S.H. Neuronal-Specific TUBB3 Is Not Required for Normal Neuronal Function but Is Essential for Timely Axon Regeneration Cell Rep. 24 2018 1865 1879 10.1016/j.celrep.2018.07.029 30110642 PMC6155462
plaincorrelational- Asserted: passes — The authors put it forward as true.
- Checkable: passes — It can be checked against evidence.
- Load-bearing: passes — The paper’s conclusions depend on it.
- Based: passes — The paper gives a reason why it holds.
It may state two separate claims as one.
What the paper did — it cites no source for this, so there is none to check. The quote shows it is in the paper.
In the paper
“From left to right: n = 29, 34, 46, 38, and 41 neurons, respectively, from three independent experiments.”
§ Endosomal protein DENND10 promotes developmental competence of neurite extension > Results > DENND10 and CCDC22 are important for neurite development in primary neurons
plainn = 3- Asserted: passes — The authors put it forward as true.
- Checkable: passes — It can be checked against evidence.
- Load-bearing: fails — The paper’s conclusions may not depend on it.
- Based: passes — The paper gives a reason why it holds.
Probably not a substantial claim. The paper’s conclusions may not depend on it.
What the paper did — it cites no source for this, so there is none to check. The quote shows it is in the paper.
In the paper
“FDR of both protein identification and PSM identification; 1%.”
§ Endosomal protein DENND10 promotes developmental competence of neurite extension > STAR★Methods > Method details
plain- Asserted: passes — The authors put it forward as true.
- Checkable: passes — It can be checked against evidence.
- Load-bearing: fails — The paper’s conclusions may not depend on it.
- Based: passes — The paper gives a reason why it holds.
Probably not a substantial claim. The paper’s conclusions may not depend on it.
A conclusion the paper draws from its own results — it cites no other source for it, so there is none to check. The quote shows it is in the paper.
In the paper
“strongly suggesting that Dennd10 deficiency diminishes Rab27a and Rab27b activation and impairs their transport into neurites in CAD cells.”
§ Endosomal protein DENND10 promotes developmental competence of neurite extension > Results > Rab27 activation is impaired in Dennd10-deficient neurons
boosteddirect- Asserted: passes — The authors put it forward as true.
- Checkable: passes — It can be checked against evidence.
- Load-bearing: passes — The paper’s conclusions depend on it.
- Based: passes — The paper gives a reason why it holds.
It may state two separate claims as one.
In the paper
“Remarkably, a human-specific allele of the TKTL1 gene, which promotes the synthesis of specific membrane lipids, has been linked to increased neocortical neurogenesis in the human lineage compared to Neanderthals.71”
§ Endosomal protein DENND10 promotes developmental competence of neurite extension > Discussion
What the sources say
- Not checked yetcites [71] Pinson A. Xing L. Namba T. Kalebic N. Peters J. Oegema C.E. Traikov S. Reppe K. Riesenberg S. Maricic T. Human TKTL1 implies greater neurogenesis in frontal neocortex of modern humans than Neanderthals Science 377 2022 eabl6422 10.1126/science.abl6422 36074851
plaincorrelational- Asserted: passes — The authors put it forward as true.
- Checkable: passes — It can be checked against evidence.
- Load-bearing: fails — The paper’s conclusions may not depend on it.
- Based: passes — The paper gives a reason why it holds.
Probably not a substantial claim. The paper’s conclusions may not depend on it.
What the paper did — it cites no source for this, so there is none to check. The quote shows it is in the paper.
In the paper
“All animal protocols were approved by the Animal Care and Use Committee at Soochow University (202410A0190).”
§ Endosomal protein DENND10 promotes developmental competence of neurite extension > STAR★Methods > Experimental model and study participant details
plain- Asserted: passes — The authors put it forward as true.
- Checkable: passes — It can be checked against evidence.
- Load-bearing: fails — The paper’s conclusions may not depend on it.
- Based: passes — The paper gives a reason why it holds.
Probably not a substantial claim. The paper’s conclusions may not depend on it.
In the paper
“While DENND10 interacts with Rab27 in a nucleotide-dependent manner in vitro,24”
§ Endosomal protein DENND10 promotes developmental competence of neurite extension > Discussion > Limitations of the study
What the sources say
- Not checked — no full text of the sourcecites [24] Zhang J. Zhang K. Qi L. Hu Q. Shen Z. Liu B. Deng J. Zhang C. Zhang Y. DENN domain-containing protein FAM45A regulates the homeostasis of late/multivesicular endosomes Biochim. Biophys. Acta Mol. Cell Res. 1866 2019 916 929 10.1016/j.bbamcr.2019.02.006 30771381 source
plaincorrelational- Asserted: passes — The authors put it forward as true.
- Checkable: passes — It can be checked against evidence.
- Load-bearing: fails — The paper’s conclusions may not depend on it.
- Based: passes — The paper gives a reason why it holds.
Probably not a substantial claim. The paper’s conclusions may not depend on it.
In the paper
“TBC1D5, a GTPase-activating protein (GAP) for Rab7, is a sub-stoichiometric component of the Retromer, linking endosomal recruitment of the Retromer with the maturation of the endosomes.29”
§ Endosomal protein DENND10 promotes developmental competence of neurite extension > Discussion
What the sources say
- Not checked — no full text of the sourcecites [29] Chen K.E. Healy M.D. Collins B.M. Towards a molecular understanding of endosomal trafficking by Retromer and Retriever Traffic 20 2019 465 478 10.1111/tra.12649 30993794 source
plaincorrelational- Asserted: passes — The authors put it forward as true.
- Checkable: passes — It can be checked against evidence.
- Load-bearing: fails — The paper’s conclusions may not depend on it.
- Based: passes — The paper gives a reason why it holds.
Probably not a substantial claim. The paper’s conclusions may not depend on it. It may state two separate claims as one.
None of the sources cited for this claim have been checked yet.
In the paper
“Rab27 is known to be critical for anterograde transport within neurites and synaptic vesicle exocytosis.65,66”
§ Endosomal protein DENND10 promotes developmental competence of neurite extension > Results > Rab27 activation is impaired in Dennd10-deficient neurons
What the sources say
- Not checked yetcites [65] Arimura N. Kimura T. Nakamuta S. Taya S. Funahashi Y. Hattori A. Shimada A. Ménager C. Kawabata S. Fujii K. Anterograde transport of TrkB in axons is mediated by direct interaction with Slp1 and Rab27 Dev. Cell 16 2009 675 686 10.1016/j.devcel.2009.03.005 19460344
- Not checked yetcites [66] Yu E. Kanno E. Choi S. Sugimori M. Moreira J.E. Llinás R.R. Fukuda M. Role of Rab27 in synaptic transmission at the squid giant synapse Proc. Natl. Acad. Sci. USA 105 2008 16003 16008 10.1073/pnas.0804825105 18840683 PMC2562534
boosteddirect- Asserted: passes — The authors put it forward as true.
- Checkable: passes — It can be checked against evidence.
- Load-bearing: passes — The paper’s conclusions depend on it.
- Based: passes — The paper gives a reason why it holds.
Probably not a substantial claim. It may state two separate claims as one.
In the paper
“It has been shown that disruption in phospholipid synthesis leads to defective dendrite growth and maintenance in fruit flies.69”
§ Endosomal protein DENND10 promotes developmental competence of neurite extension > Discussion
What the sources say
- Not checked yetcites [69] Meltzer S. Bagley J.A. Perez G.L. O'Brien C.E. DeVault L. Guo Y. Jan L.Y. Jan Y.N. Phospholipid Homeostasis Regulates Dendrite Morphogenesis in Drosophila Sensory Neurons Cell Rep. 21 2017 859 866 10.1016/j.celrep.2017.09.089 29069593 PMC5687885
plaindirect- Asserted: passes — The authors put it forward as true.
- Checkable: passes — It can be checked against evidence.
- Load-bearing: fails — The paper’s conclusions may not depend on it.
- Based: passes — The paper gives a reason why it holds.
Probably not a substantial claim. The paper’s conclusions may not depend on it.
What the paper did — it cites no source for this, so there is none to check. The quote shows it is in the paper.
In the paper
“Equal masses of proteins from each sample were precipitated with cold acetone at −20°C.”
§ Endosomal protein DENND10 promotes developmental competence of neurite extension > STAR★Methods > Method details
plain- Asserted: passes — The authors put it forward as true.
- Checkable: passes — It can be checked against evidence.
- Load-bearing: fails — The paper’s conclusions may not depend on it.
- Based: passes — The paper gives a reason why it holds.
Probably not a substantial claim. The paper’s conclusions may not depend on it.
In the paper
“Membrane expansion during neurite outgrowth likely necessitates the de novo synthesis of membrane lipids.68”
§ Endosomal protein DENND10 promotes developmental competence of neurite extension > Discussion
What the sources say
- Not checked yetcites [68] Roy D. Tedeschi A. The Role of Lipids, Lipid Metabolism and Ectopic Lipid Accumulation in Axon Growth, Regeneration and Repair after CNS Injury and Disease Cells 10 2021 1078 10.3390/cells10051078 PMC8147289 34062747
hedgedconditional- Asserted: passes — The authors put it forward as true.
- Checkable: passes — It can be checked against evidence.
- Load-bearing: fails — The paper’s conclusions may not depend on it.
- Based: passes — The paper gives a reason why it holds.
Probably not a substantial claim. The paper’s conclusions may not depend on it.
A conclusion the paper draws from its own results — it cites no other source for it, so there is none to check. The quote shows it is in the paper.
In the paper
“These results suggest that both DENND10 and CCDC22 are critical for neurite growth and development in vivo.”
§ Endosomal protein DENND10 promotes developmental competence of neurite extension > Results > DENND10 and CCDC22 are important for neurite development in primary neurons
hedgeddirect- Asserted: passes — The authors put it forward as true.
- Checkable: passes — It can be checked against evidence.
- Load-bearing: passes — The paper’s conclusions depend on it.
- Based: passes — The paper gives a reason why it holds.
It may state two separate claims as one.
What the paper did — it cites no source for this, so there is none to check. The quote shows it is in the paper.
In the paper
“Six to eight random fields were imaged per coverslip with a 63× objective (N.A. = 1.4).”
§ Endosomal protein DENND10 promotes developmental competence of neurite extension > STAR★Methods > Method details
plain- Asserted: passes — The authors put it forward as true.
- Checkable: passes — It can be checked against evidence.
- Load-bearing: fails — The paper’s conclusions may not depend on it.
- Based: passes — The paper gives a reason why it holds.
Probably not a substantial claim. The paper’s conclusions may not depend on it.
In the paper
“Another study indeed identified DENND10/FAM45A following the IP of the Retromer subunit.36”
§ Endosomal protein DENND10 promotes developmental competence of neurite extension > Discussion
What the sources say
- Not checked yetcites [36] McMillan K.J. Gallon M. Jellett A.P. Clairfeuille T. Tilley F.C. McGough I. Danson C.M. Heesom K.J. Wilkinson K.A. Collins B.M. Cullen P.J. Atypical parkinsonism–associated retromer mutant alters endosomal sorting of specific cargo proteins J. Cell Biol. 214 2016 389 399 10.1083/jcb.201604057 27528657 PMC4987296
plaincorrelational- Asserted: passes — The authors put it forward as true.
- Checkable: passes — It can be checked against evidence.
- Load-bearing: fails — The paper’s conclusions may not depend on it.
- Based: passes — The paper gives a reason why it holds.
Probably not a substantial claim. The paper’s conclusions may not depend on it.
What the paper did — it cites no source for this, so there is none to check. The quote shows it is in the paper.
In the paper
“Protein concentrations of the supernatant were measured by BCA assay and adjusted to the same level.”
§ Endosomal protein DENND10 promotes developmental competence of neurite extension > STAR★Methods > Method details
plain- Asserted: passes — The authors put it forward as true.
- Checkable: passes — It can be checked against evidence.
- Load-bearing: fails — The paper’s conclusions may not depend on it.
- Based: passes — The paper gives a reason why it holds.
Probably not a substantial claim. The paper’s conclusions may not depend on it. It may state two separate claims as one.
In the paper
“Paradoxically, a genome-wide screening identified Rab27 and Rab3 as negative regulators of neuronal regeneration.72”
§ Endosomal protein DENND10 promotes developmental competence of neurite extension > Discussion
What the sources say
- Not checked yetcites [72] Sekine Y. Lin-Moore A. Chenette D.M. Wang X. Jiang Z. Cafferty W.B. Hammarlund M. Strittmatter S.M. Functional Genome-wide Screen Identifies Pathways Restricting Central Nervous System Axonal Regeneration Cell Rep. 23 2018 415 428 10.1016/j.celrep.2018.03.058 29642001 PMC5937716
plaindirect- Asserted: passes — The authors put it forward as true.
- Checkable: passes — It can be checked against evidence.
- Load-bearing: fails — The paper’s conclusions may not depend on it.
- Based: passes — The paper gives a reason why it holds.
Probably not a substantial claim. The paper’s conclusions may not depend on it.
A conclusion the paper draws from its own results — it cites no other source for it, so there is none to check. The quote shows it is in the paper.
In the paper
“It is also important to recognize that the role of Rab27 in neurite growth could be context-dependent.”
§ Endosomal protein DENND10 promotes developmental competence of neurite extension > Discussion
hedgedconditional- Asserted: passes — The authors put it forward as true.
- Checkable: passes — It can be checked against evidence.
- Load-bearing: fails — The paper’s conclusions may not depend on it.
- Based: fails — The paper may give no reason why it holds.
Probably not a substantial claim. The paper’s conclusions may not depend on it. The paper may give no reason why it holds.
In the paper
“A decrease in malonyl-CoA, the precursor of fatty acid biosynthesis, results in impaired axonal growth and reduced accumulation of late endolysosomes in axon terminals.70”
§ Endosomal protein DENND10 promotes developmental competence of neurite extension > Discussion
What the sources say
- Not checked yetcites [70] Palomo-Guerrero M. Fadó R. Casas M. Pérez-Montero M. Baena M. Helmer P.O. Domínguez J.L. Roig A. Serra D. Hayen H. Sensing of nutrients by CPT1C regulates late endosome/lysosome anterograde transport and axon growth Elife 8 2019 e51063 10.7554/eLife.51063 PMC6927751 31868590
plaindirect- Asserted: passes — The authors put it forward as true.
- Checkable: passes — It can be checked against evidence.
- Load-bearing: fails — The paper’s conclusions may not depend on it.
- Based: passes — The paper gives a reason why it holds.
Probably not a substantial claim. The paper’s conclusions may not depend on it. It may state two separate claims as one.
In the paper
“In a previous study, we found that DENND10 is mainly localized in endosomes and lysosomes, where it regulates the positioning, maturation, and secretion of endosomes.24”
§ Endosomal protein DENND10 promotes developmental competence of neurite extension > Introduction
What the sources say
- Not checked — no full text of the sourcecites [24] Zhang J. Zhang K. Qi L. Hu Q. Shen Z. Liu B. Deng J. Zhang C. Zhang Y. DENN domain-containing protein FAM45A regulates the homeostasis of late/multivesicular endosomes Biochim. Biophys. Acta Mol. Cell Res. 1866 2019 916 929 10.1016/j.bbamcr.2019.02.006 30771381 source
plaindirect- Asserted: passes — The authors put it forward as true.
- Checkable: passes — It can be checked against evidence.
- Load-bearing: fails — The paper’s conclusions may not depend on it.
- Based: passes — The paper gives a reason why it holds.
Probably not a substantial claim. The paper’s conclusions may not depend on it. It may state two separate claims as one.
What the paper did — it cites no source for this, so there is none to check. The quote shows it is in the paper.
In the paper
“From left to right: n = 81, 86, and 94 cells, respectively, from three independent experiments.”
§ Endosomal protein DENND10 promotes developmental competence of neurite extension > Results > Dennd10 deficiency could be rescued by CCC complex subunit CCDC22
plainn = 81- Asserted: passes — The authors put it forward as true.
- Checkable: passes — It can be checked against evidence.
- Load-bearing: fails — The paper’s conclusions may not depend on it.
- Based: passes — The paper gives a reason why it holds.
Probably not a substantial claim. The paper’s conclusions may not depend on it.
A conclusion the paper draws from its own results — it cites no other source for it, so there is none to check. The quote shows it is in the paper.
In the paper
“indicating that they are essential for neuronal differentiation but not directly related to the neurite shortening phenotype observed in sgDennd10 cells.”
§ Endosomal protein DENND10 promotes developmental competence of neurite extension > Results > Changes in proteomic landscape during neurite outgrowth
hedged- Asserted: passes — The authors put it forward as true.
- Checkable: passes — It can be checked against evidence.
- Load-bearing: unclear — It is unclear whether the paper’s conclusions depend on it.
- Based: passes — The paper gives a reason why it holds.
It may state two separate claims as one.
None of the sources cited for this claim have been checked yet.
In the paper
“Rab11 and Rab35, two small GTPases found on recycling endosomes, promote neurite outgrowth and axonal elongation.7,13”
§ Endosomal protein DENND10 promotes developmental competence of neurite extension > Discussion
What the sources say
- Not checked yetcites [7] Quiroga S. Bisbal M. Cáceres A. Regulation of plasma membrane expansion during axon formation Dev. Neurobiol. 78 2018 170 180 10.1002/dneu.22553 29090510
- Not checked yetcites [13] Petrova V. Nieuwenhuis B. Fawcett J.W. Eva R. Axonal Organelles as Molecular Platforms for Axon Growth and Regeneration after Injury Int. J. Mol. Sci. 22 2021 1798 10.3390/ijms22041798 PMC7918155 33670312
plaindirect- Asserted: passes — The authors put it forward as true.
- Checkable: passes — It can be checked against evidence.
- Load-bearing: fails — The paper’s conclusions may not depend on it.
- Based: passes — The paper gives a reason why it holds.
Probably not a substantial claim. The paper’s conclusions may not depend on it.
What the paper did — it cites no source for this, so there is none to check. The quote shows it is in the paper.
In the paper
“Raw p values were adjusted for multi-comparison with the false discovery rate (FDR) method using the “p.adjust” function.”
§ Endosomal protein DENND10 promotes developmental competence of neurite extension > STAR★Methods > Method details
plain- Asserted: passes — The authors put it forward as true.
- Checkable: passes — It can be checked against evidence.
- Load-bearing: fails — The paper’s conclusions may not depend on it.
- Based: passes — The paper gives a reason why it holds.
Probably not a substantial claim. The paper’s conclusions may not depend on it.
What the paper did — it cites no source for this, so there is none to check. The quote shows it is in the paper.
In the paper
“Equal amounts of the supernatant were incubated with anti-FLAG M2 affinity gel (Sigma A2220) overnight at 4°C on a rotator.”
§ Endosomal protein DENND10 promotes developmental competence of neurite extension > STAR★Methods > Method details
plain- Asserted: passes — The authors put it forward as true.
- Checkable: passes — It can be checked against evidence.
- Load-bearing: fails — The paper’s conclusions may not depend on it.
- Based: passes — The paper gives a reason why it holds.
Probably not a substantial claim. The paper’s conclusions may not depend on it.
What the paper did — it cites no source for this, so there is none to check. The quote shows it is in the paper.
In the paper
“From left to right: n = 231, 203, 214, 226, 218, and 196 cells, respectively, from six independent experiments.”
§ Endosomal protein DENND10 promotes developmental competence of neurite extension > Results > Dennd10 deficiency could be rescued by CCC complex subunit CCDC22
plainn = 231- Asserted: passes — The authors put it forward as true.
- Checkable: passes — It can be checked against evidence.
- Load-bearing: fails — The paper’s conclusions may not depend on it.
- Based: passes — The paper gives a reason why it holds.
Probably not a substantial claim. The paper’s conclusions may not depend on it.
What the paper did — it cites no source for this, so there is none to check. The quote shows it is in the paper.
In the paper
“The Rpl32 gene was used as the internal control.”
§ Endosomal protein DENND10 promotes developmental competence of neurite extension > STAR★Methods > Method details
plain- Asserted: passes — The authors put it forward as true.
- Checkable: passes — It can be checked against evidence.
- Load-bearing: fails — The paper’s conclusions may not depend on it.
- Based: passes — The paper gives a reason why it holds.
Probably not a substantial claim. The paper’s conclusions may not depend on it.
A conclusion the paper draws from its own results — it cites no other source for it, so there is none to check. The quote shows it is in the paper.
In the paper
“Mechanistically, DENND10 exerts its influence by regulating both Rab GTPases and the CCC/Retriever complex.”
§ Endosomal protein DENND10 promotes developmental competence of neurite extension > Introduction
plaindirect- Asserted: passes — The authors put it forward as true.
- Checkable: passes — It can be checked against evidence.
- Load-bearing: passes — The paper’s conclusions depend on it.
- Based: passes — The paper gives a reason why it holds.
It may state two separate claims as one.
In the paper
“Conversely, loss-of-function mutations or down-regulation of Rab5, Rab4, Rab35, Rab33a or Rab10 result in impaired axonal growth.13”
§ Endosomal protein DENND10 promotes developmental competence of neurite extension > Discussion
What the sources say
- Not checked yetcites [13] Petrova V. Nieuwenhuis B. Fawcett J.W. Eva R. Axonal Organelles as Molecular Platforms for Axon Growth and Regeneration after Injury Int. J. Mol. Sci. 22 2021 1798 10.3390/ijms22041798 PMC7918155 33670312
plaindirect- Asserted: passes — The authors put it forward as true.
- Checkable: passes — It can be checked against evidence.
- Load-bearing: fails — The paper’s conclusions may not depend on it.
- Based: passes — The paper gives a reason why it holds.
Probably not a substantial claim. The paper’s conclusions may not depend on it. It may state two separate claims as one.
A conclusion the paper draws from its own results — it cites no other source for it, so there is none to check. The quote shows it is in the paper.
In the paper
“On the one hand, differentiation treatment halts cell cycle and promotes lipid biosynthesis, producing surplus membrane material, as represented by Edge 3 and Edge 4 in the PCA plot (Figure 2A).”
§ Endosomal protein DENND10 promotes developmental competence of neurite extension > Discussion
plaindirect- Asserted: passes — The authors put it forward as true.
- Checkable: passes — It can be checked against evidence.
- Load-bearing: unclear — It is unclear whether the paper’s conclusions depend on it.
- Based: passes — The paper gives a reason why it holds.
It may state two separate claims as one.
The paper relies on this without support.
Physiological roles of DENND10, particularly in the nervous system, remain little understood.
“However, the physiological roles of DENND10, particularly in the nervous system, remain little understood.”
“To this end, DENND10 had no known physiological functions yet.”
The paper relies on this without support.
The precise role of DENND10 within the CCC/Retriever complex remains unclear.
“While the precise role of DENND10 within the CCC/Retriever complex remains unclear, its depletion has been shown to impair the sorting of Retromer cargoes.32”
The paper relies on this without support.
Constitutively active Rab27-QL mutants bypass the requirement for GEFs such as DENND10.
“These mutants are expected to bypass the requirement for GEFs such as DENND10.”
The paper relies on this without support.
DENND10 deficiency causes dysregulation within the CCC/Retriever complex.
“it is reasonable to propose that DENND10 deficiency causes dysregulation within the CCC/Retriever complex, although the exact nature of this defect remains unclear.”
Self-check
Percentages, sums and reported differences re-computed from the paper’s own numbers.
Each contradiction between two passages listed here was confirmed by an independent check.
Rated major: it would touch a result — a value a result rests on, reported and recomputed p-values on opposite sides of the significance level, two passages that conflict with no sign which is right, or a cited work retracted before this paper was published.
In the paper
§ Endosomal protein DENND10 promotes developmental competence of neurite extension > Results > Dennd10 deficiency could be rescued by CCC complex subunit CCDC22
“CAD cells were co-transfected with mCherry-DENND10 (red) and Citrine-CCDC22 (green), permeabilized with 1% saponin to remove cytosolic proteins, and then fixed.”
§ Endosomal protein DENND10 promotes developmental competence of neurite extension > STAR★Methods > Method details
“For imaging Cit-CCDC22 and mCherry-DENND10, cells were briefly treated with 0.1% saponin for 1 min to decrease cytosolic signals before fixation.”
Citations
Cites
NIH Image to ImageJ: 25 years of image analysis
Schneider, C. A., Rasband, W. S., & Eliceiri, K. W. (2012) · Nature Methods · doi:10.1038/nmeth.2089 · Cited by 64,638
Cytoscape: A software Environment for integrated models of biomolecular interaction networks
Shannon, P., Markiel, A., Ozier, O., Baliga, N. S., Wang, J. T., Ramage, D., Amin, N., Schwikowski, B., & Ideker, T. (2003) · Genome Research · doi:10.1101/gr.1239303 · Cited by 51,888
Genome engineering using the CRISPR-Cas9 system
Ran, F. A., Hsu, P. D., Wright, J., Agarwala, V., Scott, D. A., & Zhang, F. (2013) · Nature Protocols · doi:10.1038/nprot.2013.143 · Cited by 11,133
Enrichr: a comprehensive gene set enrichment analysis web server 2016 update
Kuleshov, M. V., Jones, M. R., Rouillard, A. D., Fernandez, N. F., Duan, Q., Wang, Z., Koplev, S., Jenkins, S. L., Jagodnik, K. M., Lachmann, A., et al. (2016) · Nucleic Acids Research · doi:10.1093/nar/gkw377 · Cited by 10,799
Szklarczyk, D., Gable, A. L., Nastou, K. C., Lyon, D., Kirsch, R., Pyysalo, S., Doncheva, N. T., Legeay, M., Fang, T., Bork, P., et al. (2021) · Nucleic Acids Research · doi:10.1093/nar/gkaa1074 · Cited by 8,056
Improved vectors and genome-wide libraries for CRISPR screening
Sanjana, N. E., Shalem, O., & Zhang, F. (2014) · Nature Methods · doi:10.1038/nmeth.3047 · Cited by 5,239
DeJesus-Hernandez, M., Mackenzie, I. R., Boeve, B. F., Boxer, A. L., Baker, M., Rutherford, N. J., Nicholson, A. M., Finch, N. A., Flynn, H., Adamson, J., et al. (2011) · Neuron · doi:10.1016/j.neuron.2011.09.011 · Cited by 4,936
CHOPCHOP v3: expanding the CRISPR web toolbox beyond genome editing
Labun, K., Montague, T. G., Krause, M., Cleuren, Y. N. T., Tjeldnes, H., & Valen, E. (2019) · Nucleic Acids Research · doi:10.1093/nar/gkz365 · Cited by 2,075
Design and validation of a tool for neurite tracing and analysis in fluorescence microscopy images
Meijering, E. H. W., Jacob, M., Sarria, J. ‐. F., Steiner, P., Hirling, H., & Unser, M. A. (2004) · Cytometry Part A · doi:10.1002/cyto.a.20022 · Cited by 1,637
The pathogenesis of Parkinson's disease
Morris, H. R., Spillantini, M. G., Sue, C. M., & Williams‐Gray, C. H. (2024) · The Lancet · doi:10.1016/s0140-6736(23)01478-2 · Cited by 1,164
A Mutation in VPS35, Encoding a Subunit of the Retromer Complex, Causes Late-Onset Parkinson Disease
Zimprich, A., Benet-Pagès, A., Struhal, W., Graf, E., Eck, S. H., Offman, M. N., Haubenberger, D., Spielberger, S., Schulte, E. C., Lichtner, P., et al. (2011) · The American Journal of Human Genetics · doi:10.1016/j.ajhg.2011.06.008 · Cited by 816
VPS35 mutations in Parkinson disease
Vilariño-Güell, C., Wider, C., Ross, O. A., Dachsel, J. C., Kachergus, J. M., Lincoln, S. J., Soto-Ortolaza, A. I., Cobb, S. A., Wilhoite, G. J., Bacon, J. A., et al. (2011) · The American Journal of Human Genetics · doi:10.1016/j.ajhg.2011.06.001 · Cited by 800
Acetyl-CoA synthetase regulates histone acetylation and hippocampal memory
Mews, P., Donahue, G., Drake, A. M., Luczak, V., Abel, T., & Berger, S. L. (2017) · Nature · doi:10.1038/nature22405 · Cited by 514
Rab family of small GTPases: an updated view on their regulation and functions
Homma, Y., Hiragi, S., & Fukuda, M. (2020) · FEBS Journal · doi:10.1111/febs.15453 · Cited by 482
Regulation of retromer recruitment to endosomes by sequential action of Rab5 and Rab7
Rojas, R., van Vlijmen, T., Mardones, G. A., Prabhu, Y., Rojas, A. L., Mohammed, S., Heck, A. J. R., Raposo, G., van der Sluijs, P., & Bonifacino, J. S. (2008) · The Journal of Cell Biology · doi:10.1083/jcb.200804048 · Cited by 455
Szklarczyk, D., Gable, A. L., Nastou, K. C., Lyon, D., Kirsch, R. L., Pyysalo, S., Doncheva, N. T., Legeay, M., Fang, T., Peer Bork, B., et al. (2021) · Nucleic Acids Research · doi:10.1093/nar/gkab835 · Cited by 450
Repeated ER–endosome contacts promote endosome translocation and neurite outgrowth
Raiborg, C., Wenzel, E. M., Pedersen, N. M., Olsvik, H. L., Schink, K. O., Schultz, S. W., Vietri, M., Nisi, V., Bucci, C., Brech, A., et al. (2015) · Nature · doi:10.1038/nature14359 · Cited by 439
Qi, Y., Wang, J. K. T., McMillian, M., & Chikaraishi, D. M. (1997) · The Journal of Neuroscience · doi:10.1523/jneurosci.17-04-01217.1997 · Cited by 330
Family-wide characterization of the DENN domain Rab GDP-GTP exchange factors
Yoshimura, S.-I., Gerondopoulos, A., Linford, A., Rigden, D. J., & Barr, F. A. (2010) · Journal of Cell Biology · doi:10.1083/jcb.201008051 · Cited by 317
Neurogenesis and the Cell Cycle
Ohnuma, S., & Harris, W. A. (2003) · Neuron · doi:10.1016/s0896-6273(03)00632-9 · Cited by 270
Plasma membrane expansion: a neuron's Herculean task
Pfenninger, K. H. (2009) · Nature reviews. Neuroscience · doi:10.1038/nrn2593 · Cited by 268
ER stress and UPR in Alzheimer’s disease: mechanisms, pathogenesis, treatments
Ajoolabady, A., Lindholm, D., Ren, J., & Pratico, D. (2022) · Cell Death & Disease · doi:10.1038/s41419-022-05153-5 · Cited by 261
Zhang, D., Iyer, L. M., He, F., & Aravind, L. (2012) · Frontiers in Genetics · doi:10.3389/fgene.2012.00283 · Cited by 244
Human TKTL1 implies greater neurogenesis in frontal neocortex of modern humans than Neanderthals
Pinson, A., Xing, L., Namba, T., Kalebic, N., Peters, J., Oegema, C. E., Traikov, S., Reppe, K., Riesenberg, S., Maričić, T., et al. (2022) · Science · doi:10.1126/science.abl6422 · Cited by 236
CRISPR-Cas9-based mutagenesis frequently provokes on-target mRNA misregulation
Tuladhar, R., Yeu, Y., Tyler Piazza, J., Tan, Z., Rene Clemenceau, J., Wu, X., Barrett, Q., Herbert, J., Mathews, D. H., Kim, J., et al. (2019) · Nature Communications · doi:10.1038/s41467-019-12028-5 · Cited by 219
Dimerization of mammalian kinesin-3 motors results in superprocessive motion
Soppina, V., Norris, S. R., Dizaji, A. S., Kortus, M., Veatch, S. L., Peckham, M., & Verhey, K. J. (2014) · Proceedings of the National Academy of Sciences · doi:10.1073/pnas.1400759111 · Cited by 211
Anterograde Transport of TrkB in Axons Is Mediated by Direct Interaction with Slp1 and Rab27
Arimura, N., Kimura, T., Nakamuta, S., Taya, S., Funahashi, Y., Hattori, A., Shimada, A., Ménager, C., Kawabata, S., Fujii, K., et al. (2009) · Developmental Cell · doi:10.1016/j.devcel.2009.03.005 · Cited by 206
Towards a molecular understanding of endosomal trafficking by Retromer and Retriever
Chen, K., Healy, M. D., & Collins, B. M. (2019) · Traffic · doi:10.1111/tra.12649 · Cited by 193
Integrin Signaling Switches the Cytoskeletal and Exocytic Machinery that Drives Neuritogenesis
Gupton, S. L., & Gertler, F. B. (2010) · Developmental Cell · doi:10.1016/j.devcel.2010.02.017 · Cited by 189
Latrémolière, A., Cheng, L., DeLisle, M. M., Wu, C., Chew, S., Hutchinson, E. B., Sheridan, A. R., Alexandre, C., Latrémolière, F., Sheu, S., et al. (2018) · Cell Reports · doi:10.1016/j.celrep.2018.07.029 · Cited by 178
Endosomal retrieval of cargo: Retromer is not alone
McNally, K. E., & Cullen, P. J. (2018) · Trends in Cell Biology · doi:10.1016/j.tcb.2018.06.005 · Cited by 169
Expanding the genetic heterogeneity of intellectual disability
Anazi, S., Maddirevula, S., Salpietro, V., Asi, Y. T., Alsahli, S., Alhashem, A., Shamseldin, H. E., AlZahrani, F., Patel, N., Ibrahim, N., et al. (2017) · Human Genetics · doi:10.1007/s00439-017-1843-2 · Cited by 160
Golgi-independent secretory trafficking through recycling endosomes in neuronal dendrites and spines
Bowen, A. B., Bourke, A. M., Hiester, B. G., Hanus, C., & Kennedy, M. J. (2017) · eLife · doi:10.7554/elife.27362 · Cited by 135
Relative Protein Quantification Using Tandem Mass Tag Mass Spectrometry
Zhang, L., & Elias, J. E. (2017) · Methods in molecular biology · doi:10.1007/978-1-4939-6747-6_14 · Cited by 133
da Costa, C. A., Manaa, W. E., Duplan, E., & Checler, F. (2020) · Cells · doi:10.3390/cells9112495 · Cited by 114
Singla, A., Fedoseienko, A., Giridharan, S. S. P., Overlee, B. L., Lopez, A., Jia, D., Song, J., Huff-Hardy, K., Weisman, L., Burstein, E., et al. (2019) · Nature Communications · doi:10.1038/s41467-019-12221-6 · Cited by 113
Self-citationDosage suppression genetic interaction networks enhance functional wiring diagrams of the cell
Magtanong, L., Ho, C. H., Barker, S. L., Jiao, W., Baryshnikova, A., Bahr, S., Smith, A. M., Heisler, L. E., Choy, J. S., Kuzmin, E., et al. (2011) · Nature Biotechnology · doi:10.1038/nbt.1855 · Cited by 108
Systems-wide Studies Uncover Commander, a Multiprotein Complex Essential to Human Development
Mallam, A. L., & Marcotte, E. M. (2017) · Cell Systems · doi:10.1016/j.cels.2017.04.006 · Cited by 94
Structure of the endosomal Commander complex linked to Ritscher-Schinzel syndrome
Healy, M. D., McNally, K. E., Butkovič, R., Chilton, M., Kato, K., Sacharz, J., McConville, C., Moody, E. R. R., Shaw, S., Planelles-Herrero, V. J., et al. (2023) · Cell · doi:10.1016/j.cell.2023.04.003 · Cited by 91
VPS35 mutation in Japanese patients with typical Parkinson's disease
Ando, M., Funayama, M., Li, Y., Kashihara, K., Murakami, Y., Ishizu, N., Toyoda, C., Noguchi, K., Hashimoto, T., Nakano, N., et al. (2012) · Movement Disorders · doi:10.1002/mds.25145 · Cited by 91
Neuronal endolysosomal transport and lysosomal functionality in maintaining axonostasis
Roney, J. C., Cheng, X., & Sheng, Z. (2022) · The Journal of Cell Biology · doi:10.1083/jcb.202111077 · Cited by 91
Dey, G., Jaimovich, A., Collins, S. R., Seki, A., & Meyer, T. (2015) · Cell Reports · doi:10.1016/j.celrep.2015.01.025 · Cited by 82
Ropers, F. G., Derivery, E., Hu, H., Garshasbi, M., Karbasiyan, M., Herold, M. J., Nürnberg, G., Ullmann, R., Gautreau, A. M., Sperling, K., et al. (2011) · Human Molecular Genetics · doi:10.1093/hmg/ddr158 · Cited by 81
Elliott, A. M., Simard, L. R., Coghlan, G., Chudley, A. E., Chodirker, B. N., Greenberg, C. R., Burch, T., Ly, V., Hatch, G. M., & Zelinski, T. (2013) · Journal of Medical Genetics · doi:10.1136/jmedgenet-2013-101715 · Cited by 70
Roy, D., & Tedeschi, A. (2021) · Cells · doi:10.3390/cells10051078 · Cited by 70
Neuroprotection Signaling of Nuclear Akt in Neuronal Cells
Ahn, J. (2014) · Experimental Neurobiology · doi:10.5607/en.2014.23.3.200 · Cited by 69
Lu, J., Han, S., Lv, X., Li, X., Zhang, Z., Kuang, H., Chen, Z., Lv, C.-A., Peng, W., Yang, Z., et al. (2023) · Nature Communications · doi:10.1038/s41467-023-39710-z · Cited by 67
Pfenninger, K. H., & Johnson, M. (1983) · The Journal of Cell Biology · doi:10.1083/jcb.97.4.1038 · Cited by 65
CCDC22: a novel candidate gene for syndromic X-linked intellectual disability
Voineagu, I., Huang, L., Winden, K., Lazaro, M., Haan, E., Nelson, J., McGaughran, J., Nguyen, L. S., Friend, K., Hackett, A., et al. (2012) · Molecular Psychiatry · doi:10.1038/mp.2011.95 · Cited by 61
Sekine, Y., Lin-Moore, A. T., Chenette, D. M., Wang, X., Jiang, Z., Cafferty, W. B. J., Hammarlund, M., & Strittmatter, S. M. (2018) · Cell Reports · doi:10.1016/j.celrep.2018.03.058 · Cited by 59
Activation of protein kinase A induces neuronal differentiation of HiB5 hippocampal progenitor cells
Kim, G., Choe, Y., Park, J., Cho, S., & Kim, K. (2002) · Molecular Brain Research · doi:10.1016/s0169-328x(02)00550-8 · Cited by 58
The role of Rab GTPases in the pathobiology of Parkinson’ disease
Bonet‐Ponce, L., & Cookson, M. R. (2019) · Current Opinion in Cell Biology · doi:10.1016/j.ceb.2019.03.009 · Cited by 58
Longhena, F., Faustini, G., Brembati, V., Pizzi, M., Benfenati, F., & Bellucci, A. (2021) · Neuroscience & Biobehavioral Reviews · doi:10.1016/j.neubiorev.2021.08.011 · Cited by 58
Kolanczyk, M., Krawitz, P., Hecht, J., Hupalowska, A., Miaczynska, M., Marschner, K., Schlack, C., Emmerich, D., Kobus, K., Kornak, U., et al. (2015) · European Journal of Human Genetics · doi:10.1038/ejhg.2014.109 · Cited by 54
Sensing of nutrients by CPT1C regulates late endosome/lysosome anterograde transport and axon growth
Palomo-Guerrero, M., Fadó, R., Casas, M., Pérez-Montero, M., Baena, M., Helmer, P. O., Domínguez, J. L., Roig, A., Serra, D., Hayen, H., et al. (2019) · eLife · doi:10.7554/elife.51063 · Cited by 54
Spatiotemporal organization of exocytosis emerges during neuronal shape change
Urbina, F., Gomez, S. M., & Gupton, S. L. (2018) · The Journal of Cell Biology · doi:10.1083/jcb.201709064 · Cited by 53
Structural organization of the retriever–CCC endosomal recycling complex
Boesch, D. J., Singla, A., Han, Y., Kramer, D. A., Liu, Q., Suzuki, K., Juneja, P., Zhao, X., Long, X., Medlyn, M. J., et al. (2024) · Nature Structural & Molecular Biology · doi:10.1038/s41594-023-01184-4 · Cited by 52
Understanding the contributions of VPS35 and the retromer in neurodegenerative disease
Williams, E. T., Chen, X., Otero, P. A., & Moore, D. J. (2022) · Neurobiology of Disease · doi:10.1016/j.nbd.2022.105768 · Cited by 51
Courtland, J. L., Bradshaw, T. W., Waitt, G., Soderblom, E. J., Ho, T., Rajab, A., Vancini, R., Kim, I. H., & Soderling, S. H. (2021) · eLife · doi:10.7554/elife.61590 · Cited by 49
Atypical parkinsonism–associated retromer mutant alters endosomal sorting of specific cargo proteins
McMillan, K. J., Gallon, M., Jellett, A. P., Clairfeuille, T., Tilley, F. C., McGough, I. J., Danson, C. M., Heesom, K. J., Wilkinson, K. A., Collins, B. M., et al. (2016) · The Journal of Cell Biology · doi:10.1083/jcb.201604057 · Cited by 46
Structure and interactions of the endogenous human Commander complex
Laulumaa, S., Kumpula, E.-P., Huiskonen, J. T., & Varjosalo, M. (2024) · Nature Structural & Molecular Biology · doi:10.1038/s41594-024-01246-1 · Cited by 46
Kato, K., Oka, Y., Muramatsu, H., Vasilev, F. F., Otomo, T., Oishi, H., Kawano, Y., Kidokoro, H., Nakazawa, Y., Ogi, T., et al. (2020) · Journal of Medical Genetics · doi:10.1136/jmedgenet-2019-106213 · Cited by 42
Dense‐core vesicle biogenesis and exocytosis in neurons lacking chromogranins A and B
Domínguez, N., van Weering, J. R. T., Borges, R., Toonen, R. F. G., & Verhage, M. (2017) · Journal of Neurochemistry · doi:10.1111/jnc.14263 · Cited by 41
Phospholipid Homeostasis Regulates Dendrite Morphogenesis in Drosophila Sensory Neurons
Meltzer, S., Bagley, J. A., Perez, G. L., O’Brien, C. E., DeVault, L., Guo, Y., Jan, L. Y., & Jan, Y. N. (2017) · Cell Reports · doi:10.1016/j.celrep.2017.09.089 · Cited by 40
Role of Rab GTPases in Alzheimer’s Disease
Zhang, X., Huang, T. Y., Yancey, J., Luo, H., & Zhang, Y. (2018) · ACS Chemical Neuroscience · doi:10.1021/acschemneuro.8b00387 · Cited by 37
Self-citationMuresan, Z., & Muresan, V. (2006) · Molecular and Cellular Biology · doi:10.1128/mcb.00371-06 · Cited by 35
Axonal Organelles as Molecular Platforms for Axon Growth and Regeneration after Injury
Petrova, V., Nieuwenhuis, B., Fawcett, J. W., & Eva, R. (2021) · International Journal of Molecular Sciences · doi:10.3390/ijms22041798 · Cited by 35
Role of Rab27 in synaptic transmission at the squid giant synapse
Yu, E., Kanno, E., Choi, S., Sugimori, M., Moreira, J. E., Llinás, R. R., & Fukuda, M. (2008) · Proceedings of the National Academy of Sciences · doi:10.1073/pnas.0804825105 · Cited by 34
Wang, H., & Oxford, G. S. (2000) · Journal of Neurophysiology · doi:10.1152/jn.2000.84.6.2888 · Cited by 32
Therapeutic Targeting of Rab GTPases: Relevance for Alzheimer’s Disease
Jordan, K. L., Koss, D. J., Outeiro, T. F., & Giorgini, F. (2022) · Biomedicines · doi:10.3390/biomedicines10051141 · Cited by 32
Regulation of plasma membrane expansion during axon formation
Quiroga, S., Bisbal, M., & Cáceres, A. (2017) · Developmental Neurobiology · doi:10.1002/dneu.22553 · Cited by 29
DENN domain-containing protein FAM45A regulates the homeostasis of late/multivesicular endosomes
Zhang, J., Zhang, K., Qi, L., Hu, Q., Shen, Z., Liu, B., Deng, J., Zhang, C., & Zhang, Y. (2019) · Biochimica et Biophysica Acta (BBA) - Molecular Cell Research · doi:10.1016/j.bbamcr.2019.02.006 · Cited by 29
Self-citationQureshi, Y. H., Baez, P., & Reitz, C. (2020) · Molecular and Cellular Biology · doi:10.1128/mcb.00262-20 · Cited by 25
Cell type-specific functions of Alzheimer's disease endocytic risk genes
Maninger, J.-K., Nowak, K., Goberdhan, S., O'Donoghue, R., & Connor-Robson, N. (2024) · Philosophical Transactions of the Royal Society B: Biological Sciences · doi:10.1098/rstb.2022.0378 · Cited by 22
Kumar, R., Francis, V., Kulasekaran, G., Khan, M. Z., Armstrong, G. A. B., & McPherson, P. S. (2022) · Science Advances · doi:10.1126/sciadv.abk3088 · Cited by 20
“Fork and bracket” syndrome expands the spectrum of SBF1 -related sensory motor polyneuropathies
Romani, M., Mehawej, C., Mazza, T., Mégarbané, A., & Valente, E. M. (2016) · Neurology Genetics · doi:10.1212/nxg.0000000000000061 · Cited by 19
Disruption of ST5 is associated with mental retardation and multiple congenital anomalies
Göhring, I., Tagariello, A., Endele, S. U., Stolt, C. C., Ghassibe‐Sabbagh, M., Fisher, M. E., Thiel, C. T., Trautmann, U., Vikkula, M., Winterpacht, A., et al. (2009) · Journal of Medical Genetics · doi:10.1136/jmg.2009.069799 · Cited by 18
Explosion in the complexity of membrane protein recycling
McDonald, F. J. (2021) · American Journal of Physiology-Cell Physiology · doi:10.1152/ajpcell.00171.2020 · Cited by 13
Chesta, M. E., Carbajal, A., Arce, C. A., & Bisig, C. G. (2014) · FEBS Journal · doi:10.1111/febs.12967 · Cited by 8
On the role of vesicle transport in neurite growth: Modeling and experiments
Humpert, I., Meo, D. D., Püschel, A. W., & Pietschmann, J. (2021) · Mathematical Biosciences · doi:10.1016/j.mbs.2021.108632 · Cited by 7
Endosomal protein DENND10/FAM45A integrates extracellular vesicle release with cancer cell migration
Sun, S., Li, Q., Liu, G., Huang, X., Li, A., Guo, H., Qi, L., Zhang, J., Song, J., Su, X., et al. (2024) · BMC Biology · doi:10.1186/s12915-024-01948-4 · Cited by 4
Self-citationMicrotubule binding of the kinesin-4 KIF7 and its regulation by autoinhibitionPreprint
Blasius, T. L., Yue, Y., & Verhey, K. J. (2019) · bioRxiv (Cold Spring Harbor Laboratory) · doi:10.1101/772327
Cited by
Still being checked.
Metadata
- Authors
- Li, A., Zhang, J., Ma, C., Qi, L., Hu, Q., Li, Q., Fang, Y., Song, J., Liu, Y., & Zhang, Y.
- Affiliations
- Soochow University (CN)
- Xi’an Jiaotong-Liverpool University (CN)
- Corresponding author
- Song, Jianrui
- Liu, Yaobo
- Zhang, Yanling
- Venue
- iScience
- Publisher
- Elsevier BV
- Published
- 2025-05
- Volume
- 28
- Issue
- 5
- Pages
- 112385
- ISSN
- 2589-0042 (ISSN-L)
- PMC
- PMC12051703
- OpenAlex
- W4409258666
- Cited by
- 0
- References
- 82
- FWCI
- 0.00
- Type
- journal article
- Language
- en
- Open access
- gold
- doi.org
- Licence
- Locations
- iScience (publishedVersion, cc-by-nc-nd)
- Europe PMC (PubMed Central) (publishedVersion, cc-by-nc-nd)
- PubMed Central (publishedVersion, cc-by-nc-nd)
- PubMed (publishedVersion)
- DOAJ (DOAJ: Directory of Open Access Journals) (submittedVersion, cc-by-sa)
- Funders
- Jiangsu Provincial Key Research and Development Program (BE2023701)
- Key Technologies Research and Development Program
- Jiangsu Province Natural Science Foundation (BK20211312)
- National Key Research and Development Program of China (2023YFC2306502, 81971164, 2023YFC2412502, 82171376)
- Key Research and Development Program of Jiangxi Province
- Priority Academic Program Development of Jiangsu Higher Education Institutions
- University of Michigan
- National Natural Science Foundation of China (31571465, 31401220)
- Xi’an Jiaotong-Liverpool University (RDF-23-02-014)
- Topics
- Life Sciences › Biochemistry, Genetics and Molecular Biology › Cell Biology › Cellular transport and secretion
- Life Sciences › Neuroscience › Cellular and Molecular Neuroscience › Axon Guidance and Neuronal Signaling
- Life Sciences › Neuroscience › Cellular and Molecular Neuroscience › Neuroscience and Neuropharmacology Research
- Keywords
- neurite outgrowth, neuronal morphogenesis, endosomal proteins, Rab27, vesicle trafficking, axon development, dendrite formation, cortical neurons, neuronal differentiation
About these checks
Registry, retraction, Cites and statistics results are computed, not judged, with one exception: a printed reference that no index lists is read once by a model before it counts as a citation error. Claims are extracted by a model and kept only when their quote appears verbatim in the text; each cited source is then checked, with a model’s help, for whether it says what the claim relies on. Those verdicts can be wrong — read the claim’s quote and the cited source before relying on one.
A language model drew the claims from the paper on 2026-11-09, under version 3 of the claim definition (model deepseek-v4.1-flash, prompt extract-v3).
A second model labelled each claim on 2026-11-09 (model jev-1.13-20260917, definition revision gold-guideline-v0.2).
Cited sources are checked with a language model’s help (gpt-6-sol).
Statistics and arithmetic are recomputed, not judged.
Confidence bands are shown only for fields calibrated on our annotated test set. None is calibrated yet, so no band is shown.
What counts as a claim ›How we measure confidence ›How we check this ›
Are you an author, or do you see a problem with this page? Request a review
