

The DOI matches its Crossref record; 42 of the 42 references it cites were found in a registry or an index.
Protein quality control during aging involves recruitment of the macroautophagy pathway by BAG3
Open accessAbstract
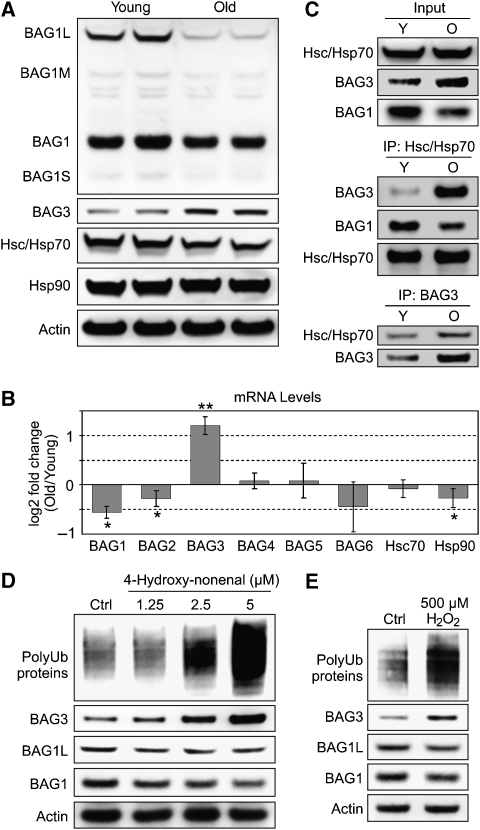
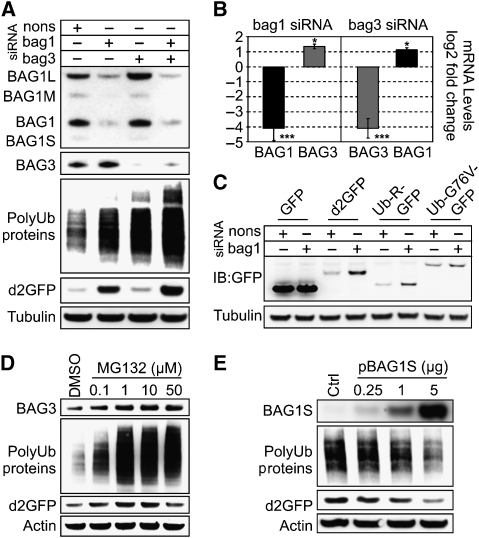
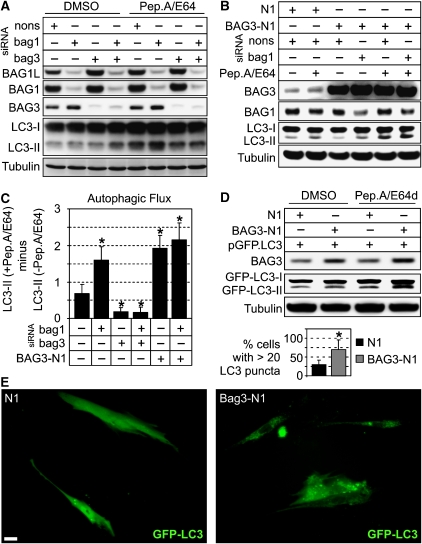
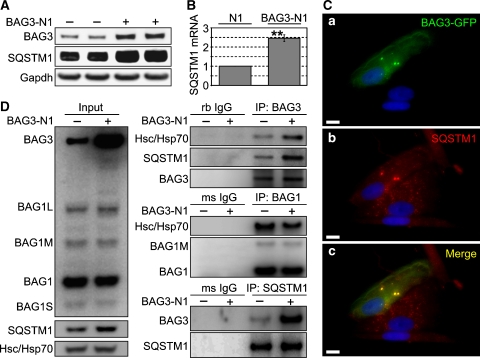
The Hsc/Hsp70 co-chaperones of the BAG (Bcl-2-associated athanogene) protein family are modulators of protein quality control. We examined the specific roles of BAG1 and BAG3 in protein degradation during the aging process. We show that BAG1 and BAG3 regulate proteasomal and macroautophagic pathways, respectively, for the degradation of polyubiquitinated proteins. Moreover, using models of cellular aging, we find that a switch from BAG1 to BAG3 determines that aged cells use more intensively the macroautophagic system for turnover of polyubiquitinated proteins. This increased macroautophagic flux is regulated by BAG3 in concert with the ubiquitin-binding protein p62/SQSTM1. The BAG3/BAG1 ratio is also elevated in neurons during aging of the rodent brain, where, consistent with a higher macroautophagy activity, we find increased levels of the autophagosomal marker LC3-II as well as a higher cathepsin activity. We conclude that the BAG3-mediated recruitment of the macroautophagy pathway is an important adaptation of the protein quality control system to maintain protein homeostasis in the presence of an enhanced pro-oxidant and aggregation-prone milieu characteristic of aging.
Overview
The claims and statistics of this paper haven’t been checked yet.
Run the check — free, no account needed. It reads the open-access text and checks the sources it cites.
Integrity signals
Registry
Cites
Statistics
Figures
Verification
Claims the paper makes
The claims and statistics of this paper haven’t been checked yet.
Run the check — free, no account needed. It reads the open-access text and checks the sources it cites.
Claims other papers make about this one
Each is checked against this paper’s own text: does it say what the citing paper says it does?
The source backs part of the claim, not all of it — or backs it for a different population, condition or comparison.
In the citing paper
“Increasing data indicate a significant association between senescence and autophagy in various cell systems (Gerland et al. 2003; Gamerdinger et al. 2009; Sasaki et al. 2010; Capparelli et al. 2012; Dörr et al. 2013).”
From Cellular senescence and its effector programs (2014) · cites this paper as Gamerdinger et al. 2009
Experimental — accuracy not yet measuredThe cited source says what the claim attributes to it.
In the citing paper
“Gamerdinger et al. (2009) showed a gradual shift in the degradation pathway for polyubiquitinated proteins from the proteasome pathway to autophagy during replicative senescence in HDFs.”
From Cellular senescence and its effector programs (2014) · cites this paper as Gamerdinger et al. 2009
Self-check
Percentages, sums and reported differences re-computed from the paper’s own numbers.
The self-check needs the paper’s full text.
Citations
Cites
Pfaffl, M. W. (2002) · Nucleic Acids Research · doi:10.1093/nar/30.9.e36 · Cited by 7,377
Pankiv, S., Clausen, T. H., Lamark, T., Brech, A., Bruun, J.-A., Outzen, H., Øvervatn, A., Bjørkøy, G., & Johansen, T. (2007) · Journal of Biological Chemistry · doi:10.1074/jbc.m702824200 · Cited by 4,578
Mitochondria, Oxidants, and Aging
Balaban, R. S., Nemoto, S., & Finkel, T. (2005) · Cell · doi:10.1016/j.cell.2005.02.001 · Cited by 4,388
How to Interpret LC3 Immunoblotting
Mizushima, N., & Yoshimori, T. (2007) · Autophagy · doi:10.4161/auto.4600 · Cited by 2,595 · cited 1×
“A well-established marker for autophagy is LC3-II, and the autophagic flux can be measured by monitoring LC3-II accumulation in the presence of lysosomal inhibitors (Mizushima and Yoshimori, 2007).”
BackgroundAdapting Proteostasis for Disease Intervention
Balch, W. E., Morimoto, R. I., Dillin, A., & Kelly, J. W. (2008) · Science · doi:10.1126/science.1141448 · Cited by 2,495
Impairment of the Ubiquitin-Proteasome System by Protein Aggregation
Bence, N., Sampat, R. M., & Kopito, R. R. (2001) · Science · doi:10.1126/science.292.5521.1552 · Cited by 2,209
The roles of intracellular protein-degradation pathways in neurodegeneration
Rubinsztein, D. C. (2006) · Nature · doi:10.1038/nature05291 · Cited by 1,625
Autophagy Genes Are Essential for Dauer Development and Life-Span Extension in C. elegans
Meléndez, A., Tallóczy, Z., Seaman, M., Eskelinen, E.-L., Hall, D. H., & Levine, B. (2003) · Science · doi:10.1126/science.1087782 · Cited by 1,270
Folding of Newly Translated Proteins In Vivo: The Role of Molecular Chaperones
Frydman, J. (2001) · Annual Review of Biochemistry · doi:10.1146/annurev.biochem.70.1.603 · Cited by 1,184
Pathways of chaperone-mediated protein folding in the cytosol
Young, J. C., Agashe, V. R., Siegers, K., & Hartl, F. U. (2004) · Nature Reviews Molecular Cell Biology · doi:10.1038/nrm1492 · Cited by 1,121
Self-citation
Cited by
Sorted by citations
Guidelines for the use and interpretation of assays for monitoring autophagy (3rd edition).
Klionsky, D. J., Abdelmohsen, K., Abe, A., Abedin, M. J., Abeliovich, H., Acevedo Arozena, A., Adachi, H., Adams, C. M., Adams, P. D., Adeli, K., et al. (2016) · Autophagy · doi:10.1080/15548627.2015.1100356 · Cited by 5,894
Molecular chaperones in protein folding and proteostasis
Hartl, F. U., Bracher, A., & Hayer-Hartl, M. (2011) · Nature · doi:10.1038/nature10317 · Cited by 3,381
“and of factors functionally coupling these chaperones with the UPS and the autophagy syste”
BackgroundSelf-citationGuidelines for the use and interpretation of assays for monitoring autophagy (4th edition) 1
Klionsky, D. J., Abdel-Aziz, A. K., Abdelfatah, S., Abdellatif, M., Abdoli, A., Abel, S., Abeliovich, H., Abildgaard, M. H., Abudu, Y. P., Acevedo-Arozena, A., et al. (2021) · Autophagy · doi:10.1080/15548627.2020.1797280 · Cited by 2,897
Self-citationSelective autophagy mediated by autophagic adapter proteins
Johansen, T., & Lamark, T. (2011) · Autophagy · doi:10.4161/auto.7.3.14487 · Cited by 1,788
Regulation of Mammalian Autophagy in Physiology and Pathophysiology
Ravikumar, B., Sarkar, S., Davies, J. E., Futter, M., García-Arencibia, M., Green-Thompson, Z. W., Jiménez-Sánchez, M., Korolchuk, V. I., Lichtenberg, M., Luo, S., et al. (2010) · Physiological Reviews · doi:10.1152/physrev.00030.2009 · Cited by 1,789
Molecular Chaperone Functions in Protein Folding and Proteostasis
Kim, Y., Hipp, M. S., Bracher, A., Hayer-Hartl, M. K., & Hartl, F. U. (2013) · Annual Review of Biochemistry · doi:10.1146/annurev-biochem-060208-092442 · Cited by 1,545
Self-citationIn vivo aspects of protein folding and quality control
Balchin, D., Hayer-Hartl, M. K., & Hartl, F. U. (2016) · Science · doi:10.1126/science.aac4354 · Cited by 1,477
“Both proteasomal and lysosomal clearance pathways are tightly coupled to the Hsp70 and Hsp90 chaperone systems via BAG-domain proteins and specific ubiquitin ligases, such as the cochaperone CHIP (139, 140).”
BackgroundInfluentialSelf-citationAutophagy, mitochondria and oxidative stress: cross-talk and redox signalling.
Lee, J., Giordano, S., & Zhang, J. (2012) · Biochemical Journal · doi:10.1042/bj20111451 · Cited by 1,438
Rosenzweig, R., Nillegoda, N. B., Mayer, M. P., & Bukau, B. (2019) · Nature Reviews Molecular Cell Biology · doi:10.1038/s41580-019-0133-3 · Cited by 1,285
A Role for Ubiquitin in Selective Autophagy
Kirkin, V., McEwan, D. G., Novak, I., & Đikić, I. (2009) · Molecular Cell · doi:10.1016/j.molcel.2009.04.026 · Cited by 1,268
“Further, a senescence-activated Hsc/Hsp70 cochaperone BAG3 (Figure 1) has been proposed to mediate autophagic degradation of ubiquitinated proteins in aging cells (Gamerdinger et al., 2009).”
BackgroundProteasomal and Autophagic Degradation Systems
Đikić, I. (2017) · Annual Review of Biochemistry · doi:10.1146/annurev-biochem-061516-044908 · Cited by 1,217
Cellular senescence and its effector programs
Salama, R., Sadaie, M., Hoare, M., & Narita, M. (2014) · Genes & Development · doi:10.1101/gad.235184.113 · Cited by 855
“Increasing data indicate a significant association between senescence and autophagy in various cell systems (Gerland et al. 2003; Gamerdinger et al. 2009; Sasaki et al. 2010; Capparelli et al. 2012; Dörr et al. 2013).”
BackgroundUbiquitination and selective autophagy
Shaid, S., Brandts, C. H., Serve, H., & Dikic, I. (2013) · Cell Death & Differentiation · doi:10.1038/cdd.2012.72 · Cited by 800
“tion of misfolded proteins and gather them into p62-containing aggregates.(27) Bag1, highly expressed in young cells, promotes high use of proteasomal degradation, whereas Bag3 was upregulated in ageing cells correlating with increased”
BackgroundInfluentialHeat shock proteins: Biological functions, pathological roles, and therapeutic opportunities
Hu, C., Yang, J. C., Qi, Z., Wu, H., Wang, B., Zou, F., Mei, H., Liu, J. L., Wang, W., & Liu, Q. (2022) · MedComm · doi:10.1002/mco2.161 · Cited by 881
Ubiquitin-Dependent And Independent Signals In Selective Autophagy
Khaminets, A., Behl, C., & Đikić, I. (2015) · Trends in Cell Biology · doi:10.1016/j.tcb.2015.08.010 · Cited by 754
Self-citationMatsumoto, G., Wada, K., Okuno, M., Kurosawa, M., & Nukina, N. (2011) · Molecular Cell · doi:10.1016/j.molcel.2011.07.039 · Cited by 714
“Recently, BAG3 has been reported as a regulator of autophagic flux in concert with p62 (Gamerdinger et al., 2009).”
BackgroundSelective autophagy: ubiquitin-mediated recognition and beyond
Kraft, C., Peter, M., & Hofmann, K. (2010) · Nature Cell Biology · doi:10.1038/ncb0910-836 · Cited by 639
“To cope with this burden, ageing cells upregulate components that recognize misfolded proteins and trigger their sequestration in p62-containing bodie”
BackgroundHeger, M., van Golen, R. F., Broekgaarden, M., & Michel, M. C. (2013) · Pharmacological Reviews · doi:10.1124/pr.110.004044 · Cited by 594
Chaperone-Assisted Selective Autophagy Is Essential for Muscle Maintenance
Arndt, V., Dick, N., Tawo, R., Dreiseidler, M., Wenzel, D., Hesse, M., Fürst, D. O., Säftig, P., Saint, R. B., Fleischmann, B. K., et al. (2010) · Current Biology · doi:10.1016/j.cub.2009.11.022 · Cited by 572
“BAG-1 seem to act as molecular switches in this situation [3, 8 ]. Distinct chaperone machineries thus not only define diverse folding pathways but also specific and versatile degradation pathways that are equally important for cellular homeostasis, according to the principle ‘‘degrade to maintain.’’ Finally, our find…”
InfluentialThe Hsp90 chaperone machinery: Conformational dynamics and regulation by co-chaperones
Li, J., Soroka, J., & Buchner, J. (2012) · Biochimica et Biophysica Acta (BBA) - Molecular Cell Research · doi:10.1016/j.bbamcr.2011.09.003 · Cited by 498
Aggrephagy: Selective Disposal of Protein Aggregates by Macroautophagy
Lamark, T., & Johansen, T. (2012) · International Journal of Cell Biology · doi:10.1155/2012/736905 · Cited by 514
“This correlates with an increased formation of p62 bodies [68].”
BackgroundAmm, I., Sommer, T., & Wolf, D. H. (2013) · Biochimica et Biophysica Acta (BBA) - Molecular Cell Research · doi:10.1016/j.bbamcr.2013.06.031 · Cited by 509
“They bind to Hsp70 and can either cause delivery of proteins to the proteasome (BAG-1) [77], negatively regulate CHIP ubiquitination activity (BAG-2, BAG-5) [78,79] or mediate substrate delivery to the lysosome (BAG-3) [80].”
BackgroundFrom Ancient Pathways to Aging Cells—Connecting Metabolism and Cellular Senescence
Wiley, C. D., & Campisi, J. (2016) · Cell Metabolism · doi:10.1016/j.cmet.2016.05.010 · Cited by 440
“…evidence indicate a senescence-associated increase in autophagy, especially macroautophagy, the process bywhich protein complexes and organelles associate withmembrane-bound autophagosomes that eventually fuse with lysosomes (Capparelli et al., 2012; Gamerdinger et al., 2009; Singh et al., 2012).”
BackgroundSellier, C., Campanari, M., Julie Corbier, C., Gaucherot, A., Kolb‐Cheynel, I., Oulad‐Abdelghani, M., Ruffenach, F., Page, A., Ciura, S., Kabashi, E., et al. (2016) · The EMBO Journal · doi:10.15252/embj.201593350 · Cited by 414
“…(BCL2-associated athanogene 3) and the ubiquitin ligase STUB1 (also known as CHIP) to initiate aggrephagy, also named chaperone-assisted selective autophagy (CASA), which is the selective autophagy of chaperone-bound misfolded or aggregated proteins (Gamerdinger et al , 2009; Arndt et al , 2010).”
Mechanisms of Selective Autophagy
Lamark, T., & Johansen, T. (2021) · Annual Review of Cell and Developmental Biology · doi:10.1146/annurev-cellbio-120219-035530 · Cited by 429
Stricher, F., Macri, C., Ruff, M., & Muller, S. (2013) · Autophagy · doi:10.4161/auto.26448 · Cited by 445
“A role of CASA has also been hypothesized during aging, since increased expression of BAG3 during this process stimulates macroautophagy activity in a SQSTM1-dependent manner.(209)”
BackgroundLi, Y., Li, S., & Wu, H. (2022) · Cells · doi:10.3390/cells11050851 · Cited by 408
“Chaperones and proteases play a key role of PQC when protein aggregates occur.”
BackgroundInfluentialHöhn, A., Weber, D., Jung, T., Ott, C., Hugo, M., Kochlik, B., Kehm, R., König, J., Grune, T., & Castro, J. P. (2016) · Redox Biology · doi:10.1016/j.redox.2016.12.001 · Cited by 388
BAG3 mediates chaperone‐based aggresome‐targeting and selective autophagy of misfolded proteins
Gamerdinger, M., Kaya, A. M., Uwe Wolfrum, B., Clement, A. M., & Behl, C. (2011) · EMBO Reports · doi:10.1038/embor.2010.203 · Cited by 362
“Here, we describe the identification of a new chaperone-based aggresome-targeting mechanism controlled by the heat-shock protein 70 (Hsp70) co-chaperone Bcl-2-associated athanogene 3 (BAG3), which was recently implicated in selective autophagy (Gamerdinger et al, 2009; Arndt et al, 2010).”
BackgroundMethodInfluentialSelf-citationNorton, N., Li, D., Rieder, M. J., Siegfried, J. D., Rampersaud, E., Zuchner, S. L., Mangos, S., Gonzalez‐Quintana, J., Wang, L., McGee, S. R., et al. (2011) · The American Journal of Human Genetics · doi:10.1016/j.ajhg.2011.01.016 · Cited by 366
Villard, E., Perret, C., Gary, F., Proust, C., Dilanian, G., Hengstenberg, C., Ruppert, V., Arbustini, E., Wichter, T., Germain, M., et al. (2011) · European Heart Journal · doi:10.1093/eurheartj/ehr105 · Cited by 349
Crippa, V., Sau, D., Rusmini, P., Boncoraglio, A., Onesto, E., Bolzoni, E., Galbiati, M., Fontana, E., Marino, M., Carra, S., et al. (2010) · Human Molecular Genetics · doi:10.1093/hmg/ddq257 · Cited by 330
“Generally, this small Hsp is poorly activated by these two insults (11,19).”
BackgroundHealing and Hurting: Molecular Mechanisms, Functions, and Pathologies of Cellular Senescence
Adams, P. D. (2009) · Molecular Cell · doi:10.1016/j.molcel.2009.09.021 · Cited by 326
Autophagy and the Immune System
Kuballa, P., Nolte, W. M., Castoreno, A. B., & Xavier, R. J. (2012) · Annual Review of Immunology · doi:10.1146/annurev-immunol-020711-074948 · Cited by 335
BAG3: a multifaceted protein that regulates major cell pathways
Rosati, A., Graziano, V., Laurenzi, V. D., Pascale, M. C., & Turco, M. C. (2011) · Cell Death and Disease · doi:10.1038/cddis.2011.24 · Cited by 318
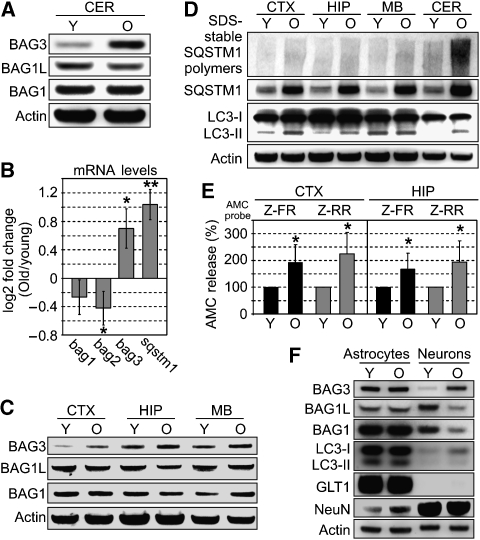
“increases, concomitantly with an increase in autophagy, in an in vitro model of cell aging (replicative senescence: I90 cells) and in rodent brain neurons during aging.(75) The authors attribute BAG3 increase to oxidative stress due to the”
InfluentialSarkar, T. J., Quarta, M., Mukherjee, S., Colville, A., Paine, P., Doan, L., Tran, C. M., Chu, C. R., Horvath, S., Qi, L. S., et al. (2020) · Nature Communications · doi:10.1038/s41467-020-15174-3 · Cited by 308
Heat shock proteins: Cellular and molecular mechanisms in the central nervous system
Stetler, R. A., Gan, Y., Zhang, W., Liou, A. K. F., Gao, Y., Cao, G., & Chen, J. (2010) · Progress in Neurobiology · doi:10.1016/j.pneurobio.2010.05.002 · Cited by 313
Öst, A., Svensson, K., Ruishalme, I., Brännmark, C., Franck, N., Krook, H., Sandström, P., Kjølhede, P., & Strålfors, P. (2010) · Molecular Medicine · doi:10.2119/molmed.2010.00023 · Cited by 274
Scotter, E. L., Vance, C. A., Nishimura, A. L., Lee, Y., Chen, H.-J., Urwin, H., Sardone, V., Mitchell, J. C., Rogelj, B., Rubinsztein, D. C., et al. (2014) · Journal of Cell Science · doi:10.1242/jcs.140087 · Cited by 282
“As we age, the efficiency of both the UPS and autophagy decline (Gamerdinger et al., 2009; Tydlacka et al., 2008; Zhou et al., 2003).”
BackgroundImpact of cellular senescence signature on ageing research
Sikora, E., Arendt, T., Bennett, M., & Narita, M. (2011) · Ageing Research Reviews · doi:10.1016/j.arr.2010.10.002 · Cited by 264
Breaking BAG: The Co-Chaperone BAG3 in Health and Disease
Behl, C. (2016) · Trends in Pharmacological Sciences · doi:10.1016/j.tips.2016.04.007 · Cited by 266
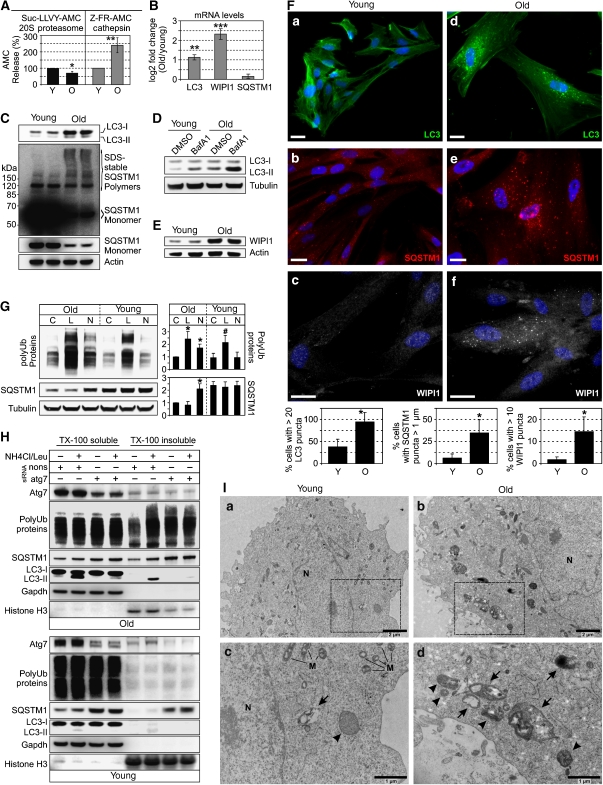
“so-called cytoplasmic punctae that can be co-labeled with LC3 as well as WIPI1 [18].”
BackgroundInfluentialSelf-citationProtein damage, repair and proteolysis
Chondrogianni, N., Petropoulos, I., Grimm, S., Georgila, K., Catalgol, B., Friguet, B., Grune, T., & Gonos, E. S. (2012) · Molecular Aspects of Medicine · doi:10.1016/j.mam.2012.09.001 · Cited by 271
Autophagy Impairment Induces Premature Senescence in Primary Human Fibroblasts
Kang, H. T., Lee, K. B., Kim, S. Y., Choi, H. R., & Park, S. C. (2011) · PLoS ONE · doi:10.1371/journal.pone.0023367 · Cited by 254
“In addition, the decline of the p62 monomer, which is required for the transport of poly-ubiquitinated proteins into the autophagosome, may induce defective clearance and accumulation of polyubiquitinated proteins in cells as previously reported [39].”
BackgroundResultCha‐Molstad, H., Yu, J. E., Feng, Z., Lee, S. H., Kim, J. G., Yang, P., Han, B., Sung, K. W., Yoo, Y. D., Hwang, J., et al. (2017) · Nature Communications · doi:10.1038/s41467-017-00085-7 · Cited by 252
Functional Modules of the Proteostasis NetworkPreprint
Jayaraj, G. G., Hipp, M. S., & Hartl, F. U. (2019) · Cold Spring Harbor Perspectives in Biology · doi:10.1101/cshperspect.a033951 · Cited by 254
“Aggregated proteins accumulate in ubiquitin positive deposits to which the autophagic machinery is recruited by chaperones in a process known as chaperone-assisted selective autophagy (CASA) (Carra et al. 2008; Gamerdinger et al. 2009; Arndt et al. 2010).”
BackgroundSelf-citationShaping proteostasis at the cellular, tissue, and organismal level
Sala, A. J., Bott, L. C., & Morimoto, R. I. (2017) · The Journal of Cell Biology · doi:10.1083/jcb.201612111 · Cited by 256
“Cofactors with tetratricopeptide repeat (TPR) domains, such as CHIP (C terminus of Hsp70 interacting protein, also known as STUB1), and BAG domain–containing nucleotide exchange factors interact with the HSP70/HSP90 machinery and direct substrates for degradation by the UPS or lysosomes (Agarraberes and Dice, 2001; De…”
BackgroundHsp70 – a master regulator in protein degradation
Fernández-Fernández, M. R., Gragera, M., Ochoa‐Ibarrola, L., Quintana‐Gallardo, L., & Valpuesta, J. (2017) · FEBS Letters · doi:10.1002/1873-3468.12751 · Cited by 260
Protein oxidation in aging and the removal of oxidized proteins
Höhn, A., König, J., & Grune, T. (2013) · Journal of Proteomics · doi:10.1016/j.jprot.2013.01.004 · Cited by 253
“[320] Gamerdinger M, Hajieva P, Kaya AM, Wolfrum U, Hartl FU, Behl C.”
BackgroundEjlerskov, P., Rasmussen, I., Nielsen, T. T., Bergström, A., Tohyama, Y., Jensen, P. H., & Vilhardt, F. (2013) · Journal of Biological Chemistry · doi:10.1074/jbc.m112.401174 · Cited by 242
“Selectivity is provided by ubiquitin-binding adaptor proteins p62/SQSTM1, NBR1, and HDAC6 (15,16), which link ubiquitinated cargo to LC3B, and in the case of HDAC6, additionally to dynein-dynactin motor proteins (16-20).”
BackgroundKennedy, A. L., Morton, J. P., Manoharan, I., Nelson, D. M., Jamieson, N. B., Pawlikowski, J. S., McBryan, T., Doyle, B., McKay, C., Oien, K. A., et al. (2011) · Molecular Cell · doi:10.1016/j.molcel.2011.02.020 · Cited by 213
“Senescent cells also upregulate autophagy (Gamerdinger et al., 2009; Young et al., 2009), an organelle recycling process, and this might contribute to remodeling of senescent cells and provide the raw materials for altered biosynthetic processes.”
The nucleotide exchange factors of Hsp70 molecular chaperones
Bracher, A., & Verghese, J. (2015) · Frontiers in Molecular Biosciences · doi:10.3389/fmolb.2015.00010 · Cited by 212
“Interestingly, Bag3 is the only stress-inducible BAG-domain protein (Franceschelli et al., 2008), and its increased abundance might tip the balance from proteasomal to lysosomal degradation (Gamerdinger et al., 2009).”
BackgroundSelective Autophagy in Cancer Development and Therapy
Đikić, I., Johansen, T., & Kirkin, V. (2010) · Cancer Research · doi:10.1158/0008-5472.can-09-4027 · Cited by 217
“It is suggested that the shift in BAG1-BAG3 expression ratio during cell senescence can activate autophagy in aged cells (23).”
Willis, M. S., Townley-Tilson, W. H. D., Kang, E., Homeister, J. W., & Patterson, C. (2010) · Circulation Research · doi:10.1161/circresaha.109.208801 · Cited by 214
Cemma, M., Kim, P. K., & Brumell, J. H. (2011) · Autophagy · doi:10.4161/auto.7.3.14046 · Cited by 200
Proteostasis in cardiac health and disease
Henning, R. H., & Brundel, B. J. J. M. (2017) · Nature Reviews Cardiology · doi:10.1038/nrcardio.2017.89 · Cited by 193
The ubiquitin-proteasome system and autophagy: Coordinated and independent activities
Cohen‐Kaplan, V., Livneh, I., Avni, N., Cohen-Rosenzweig, C., & Ciechanover, A. J. (2016) · The International Journal of Biochemistry & Cell Biology · doi:10.1016/j.biocel.2016.07.019 · Cited by 205
The Role of the Multifunctional BAG3 Protein in Cellular Protein Quality Control and in Disease
Stürner, E., & Behl, C. (2017) · Frontiers in Molecular Neuroscience · doi:10.3389/fnmol.2017.00177 · Cited by 202
“An increased cellular BAG3 level was additionally verified during cellular aging in neuronal cells as well as in lung fibroblasts (Gamerdinger et al., 2009).”
BackgroundInfluentialSelf-citationOgrodnik, M., Salmonowicz, H., & Gladyshev, V. N. (2019) · Aging Cell · doi:10.1111/acel.12841 · Cited by 184
Identification of the key structural motifs involved in HspB8/HspB6–Bag3 interaction
Fuchs, M., Poirier, D. J., Seguin, S. J., Lambert, H., Carra, S., Charette, S. J., & Landry, J. (2010) · Biochemical Journal · doi:10.1042/bj20090907 · Cited by 190
Kaminskyy, V. O., & Zhivotovsky, B. (2011) · Biochimica et Biophysica Acta (BBA) - Proteins and Proteomics · doi:10.1016/j.bbapap.2011.05.013 · Cited by 193
Mechanisms tailoring the expression of heat shock proteins to proteostasis challenges
Boopathy, L. R. A., Jacob‐Tomas, S., Alecki, C., & Vera, M. (2022) · Journal of Biological Chemistry · doi:10.1016/j.jbc.2022.101796 · Cited by 183
Chaperone-assisted degradation: multiple paths to destruction
Kettern, N., Dreiseidler, M., Tawo, R., & Höhfeld, J. (2010) · Biological Chemistry · doi:10.1515/bc.2010.058 · Cited by 180
Salminen, A., Kaarniranta, K., & Kauppinen, A. (2013) · Ageing Research Reviews · doi:10.1016/j.arr.2012.11.004 · Cited by 173
Heat shock proteins as potential targets for protective strategies in neurodegeneration
Kampinga, H. H., & Bergink, S. (2016) · The Lancet Neurology · doi:10.1016/s1474-4422(16)00099-5 · Cited by 176
Ulbricht, A., Gehlert, S., Leciejewski, B., Schiffer, T., Bloch, W., & Höhfeld, J. (2015) · Autophagy · doi:10.1080/15548627.2015.1017186 · Cited by 169
“The complex comprises the molecular chaperones HSPA8/HSC70 and HSPB8/HSP22, coupled by the cochaperone BAG3 that is essential for the initiation of CASA.(3,14,15) BAG3 cooperates with the HSPA8-associated ubiquitin ligase STUB1/CHIP and its partner UBE2D (ubiquitin-conjugating enzyme E2D) in the ubiquitination of chap…”
BackgroundRauch, J. N., & Gestwicki, J. E. (2013) · Journal of Biological Chemistry · doi:10.1074/jbc.m113.521997 · Cited by 167
“BAG1 is involved in multiple processes, including proteasomal degradation (32–34), whereas BAG3 is linked to autophagy (37), and BAG2 coordinates the removal of protein aggregates (36).”
BackgroundHsp70 chaperone: a master player in protein homeostasis
Fernández-Fernández, M. R., & Valpuesta, J. (2018) · F1000Research · doi:10.12688/f1000research.15528.1 · Cited by 157
Goode, A., Butler, K., Long, J., Cavey, J., Scott, D., Shaw, B., Sollenberger, J., Gell, C., Johansen, T., Oldham, N. J., et al. (2016) · Autophagy · doi:10.1080/15548627.2016.1170257 · Cited by 153
Small Heat Shock Proteins, Big Impact on Protein Aggregation in Neurodegenerative Disease
Webster, J. M., Darling, A. L., Uversky, V. N., & Blair, L. J. (2019) · Frontiers in Pharmacology · doi:10.3389/fphar.2019.01047 · Cited by 164
BAG3 induces the sequestration of proteasomal clients into cytoplasmic puncta
Minoia, M., Boncoraglio, A., Vinet, J., Morelli, F., Brunsting, J. F., Poletti, A., Schipper-Krom, S., Reits, E. A., Kampinga, H. H., & Carra, S. (2014) · Autophagy · doi:10.4161/auto.29409 · Cited by 166
“First, we investigated the effect of proteasomal inhibition on the subcellular localization of BAG3.”
BackgroundInfluentialThe Life and Death of a Plant Cell
Kabbage, M., Kessens, R., Bartholomay, L. C., & Williams, B. (2017) · Annual Review of Plant Biology · doi:10.1146/annurev-arplant-043015-111655 · Cited by 161
MiR-34 modulates Caenorhabditis elegans lifespan via repressing the autophagy gene atg9
Yang, J., Chen, D., He, Y., Meléndez, A., Feng, Z., Hong, Q., Bai, X., Li, Q., Cai, G., Wang, J., et al. (2011) · AGE · doi:10.1007/s11357-011-9324-3 · Cited by 161
The role of molecular chaperones in human misfolding diseases
Broadley, S. A., & Hartl, F. U. (2009) · FEBS Letters · doi:10.1016/j.febslet.2009.04.029 · Cited by 159
“autophagic degradation pathway during the ageing process [27].”
BackgroundSelf-citationAutophagy Suppresses Age-Dependent Ischemia and Reperfusion Injury in Livers of Mice
Wang, J., Ahn, I., Fischer, T. D., Byeon, J. I., Dunn, W. A., Behrns, K. E., Leeuwenburgh, C., & Kim, J. (2011) · Gastroenterology · doi:10.1053/j.gastro.2011.08.005 · Cited by 146
Jurcău, A. (2021) · International Journal of Molecular Sciences · doi:10.3390/ijms222111847 · Cited by 152
Kalia, L. V., Kalia, S. K., Chau, H., Lozano, A. M., Hyman, B. T., & McLean, P. J. (2011) · PLoS ONE · doi:10.1371/journal.pone.0014695 · Cited by 148
“More recent evidence has shown that the ratio of the BAG domain-containing proteins BAG1 and BAG3 may shift protein degradation towards different pathways [59] and thus regulate proteostasis.”
BackgroundThe remarkable multivalency of the Hsp70 chaperones
Zuiderweg, E. R. P., Hightower, L. E., & Gestwicki, J. E. (2017) · Cell Stress and Chaperones · doi:10.1007/s12192-017-0776-y · Cited by 137
“BAG1 and BAG3 represent key players of cellular by stimulating the turnover of polyubiquitinated proteins by proteasomal and autophagic degradation pathways, respectively (Gamerdinger et al. 2009).”
Loss-of-function mutations in co-chaperone BAG3 destabilize small HSPs and cause cardiomyopathy
Fang, X., Bogomolovas, J., Wu, T., Zhang, W., Liu, C., Veevers, J., Stroud, M. J., Zhang, Z., Ma, X., Mu, Y., et al. (2017) · Journal of Clinical Investigation · doi:10.1172/jci94310 · Cited by 132
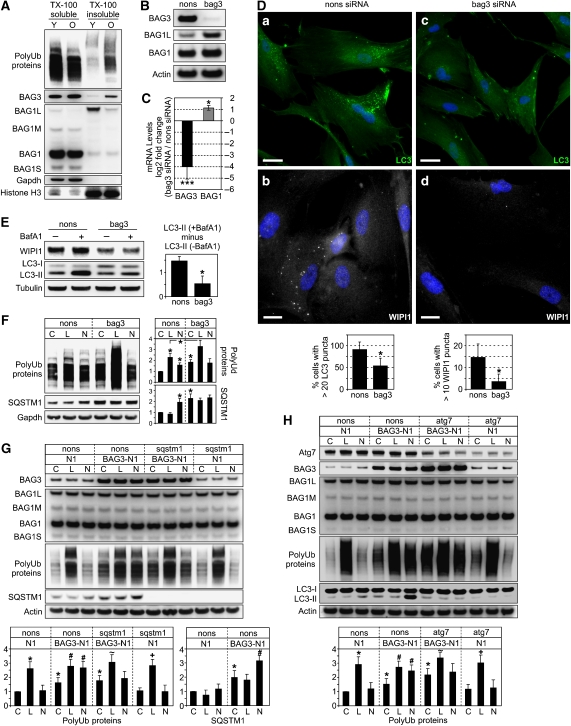
“As it has also been reported that BAG3 is involved in autophagy (37), we next investigated how the loss of BAG3 might affect autophagic flux by examining the levels of the autophago someassociated protein light chain 3B (LC3B) (38), which is present in cytosolic form (LC3B-I) until it becomes targeted to nascent autop…”
The chaperone-assisted selective autophagy complex dynamics and dysfunctions
Tedesco, B., Vendredy, L., Timmerman, V., & Poletti, A. (2023) · Autophagy · doi:10.1080/15548627.2022.2160564 · Cited by 136
Protein Disaggregation in Multicellular Organisms
Nillegoda, N. B., Wentink, A. S., & Bukau, B. (2018) · Trends in Biochemical Sciences · doi:10.1016/j.tibs.2018.02.003 · Cited by 127
Pharmacological Targeting of the Hsp70 Chaperone
Patury, S., Miyata, Y., & Gestwicki, J. E. (2009) · Current Topics in Medicinal Chemistry · doi:10.2174/156802609789895674 · Cited by 130
“In addition to being implicated in cancer, protein misfolding disorders and infection, Hsp70 and its co-chaperones have been associated with numerous other diseases, including Crohn’s disease [130], Behcet’s disease [131], ischemic stroke [132] and ALS [133], and this chaperone also plays roles in normal aging [134, 1…”
Autophagy: links with the proteasome
Lamark, T., & Johansen, T. (2009) · Current Opinion in Cell Biology · doi:10.1016/j.ceb.2009.11.002 · Cited by 124
Zientara‐Rytter, K., & Subramani, S. E. (2019) · Cells · doi:10.3390/cells8010040 · Cited by 128
“Since all studies on the BAG1/BAG3 ratio and BAG3-mediated autophagy have come from the animal kingdom [206], it is worth asking if such modulation of the PQC system is also present in plants where the BAG protein family is conserved [211–215].”
BackgroundThe lysosomal proteome of senescent cells contributes to the senescence secretome
Rovira, M., Sereda, R., Pladevall‐Morera, D., Ramponi, V., Marín, I., Maus, M., Madrigal‐Matute, J., Díaz, A., García, F., Muñoz, J., et al. (2022) · Aging Cell · doi:10.1111/acel.13707 · Cited by 135
Tsuboi, K., Nishitani, M., Takakura, A., Imai, Y., Komatsu, M., & Kawashima, H. (2015) · Journal of Biological Chemistry · doi:10.1074/jbc.m114.632257 · Cited by 126
“Furthermore, p62 protein, a selective substrate of autophagy, and the high molecular weight forms of p62 (33) significantly accumulated in cKO mice.”
BackgroundAutophagy in Age-Associated Neurodegeneration
Metaxakis, A., Ploumi, C., & Tavernarakis, N. (2018) · Cells · doi:10.3390/cells7050037 · Cited by 127
“Interestingly, BAG3 is associated with p62/SQSTM1, which mediates the interaction with the LC3-II-marked phagophores [168,171].”
BackgroundLi, Y., Xue, Y., Xu, X., Wang, G., Liu, Y., Wu, H., Li, W., Wang, Y., Chen, Z., Zhang, W., et al. (2018) · The EMBO Journal · doi:10.15252/embj.201798786 · Cited by 117
“Although R-GFP is an N-end rule substrate, HSC70 may also be involved in its proteasomal degradation, as knockdown of BAG1, a HSC70 co-chaperone that mediates the interaction between HSC70 and proteasome, caused accumulation of R-GFP (Gamerdinger et al , 2009).”
Autophagy in regulation of Toll-like receptor signaling
Into, T., Inomata, M., Takayama, E., & Takigawa, T. (2012) · Cellular Signalling · doi:10.1016/j.cellsig.2012.01.020 · Cited by 121
The role of heat shock proteins and co-chaperones in heart failure
Ranek, M. J., Stachowski, M. J., Kirk, J. A., & Willis, M. S. (2017) · Philosophical Transactions of the Royal Society B Biological Sciences · doi:10.1098/rstb.2016.0530 · Cited by 121
Quality Control Against Misfolded Proteins in the Cytosol: A Network for Cell Survival
KUBOTA, H. Y. (2009) · The Journal of Biochemistry · doi:10.1093/jb/mvp139 · Cited by 119
Sulforaphane enhances progerin clearance in H utchinson– G ilford progeria fibroblasts
Gabriel, D., Roedl, D., Gordon, L. B., & Djabali, K. (2014) · Aging Cell · doi:10.1111/acel.12300 · Cited by 114
“Cells rely on two proteolytic systems to maintain proteostasis: the lysosomal system (or autophagy) and the ubiquitin – proteasome system (Gamerdinger et al. , 2009).”
InfluentialRadiation-induced autophagy: mechanisms and consequences
Chaurasia, M., Bhatt, A. N., Das, A., Dwarakanath, B. S. R., & Sharma, K. (2016) · Free Radical Research · doi:10.3109/10715762.2015.1129534 · Cited by 119
“Bag1 helps in the removal of ubiquitinated proteins via UPS, whereas Bag3 helps in the autophagic removal of degraded proteins [36].”
BackgroundThe ubiquitin-proteasome system in cardiac proteinopathy: a quality control perspective
Su, H., & Wang, X. (2009) · Cardiovascular Research · doi:10.1093/cvr/cvp287 · Cited by 118
“BAG3 recruits the autophagic system by teaming up with p62/SQSTM.(55) It seems that concentrating”
BackgroundInfluentialGamerdinger, M., Carra, S., & Behl, C. (2011) · Journal of Molecular Medicine · doi:10.1007/s00109-011-0795-6 · Cited by 118
“Interestingly, the decreased proteasomal activation and the increased macroautophagy activation in aged cells/tissue have been correlated with decreased levels of BAG1 and increased levels of BAG3 [ 21 ].”
InfluentialSelf-citationIKKγ protein is a target of BAG3 regulatory activity in human tumor growth
Ammirante, M., Rosati, A., Arra, C., Basile, A. M., Falco, A., Festa, M., Pascale, M. C., d’Avenia, M., Marzullo, L., Belisario, M. A., et al. (2010) · Proceedings of the National Academy of Sciences · doi:10.1073/pnas.0907696107 · Cited by 113
“Moreover, BAG3 is known to play a role in other cellular processes, such as autophagy (50, 51) and cell motility (46–48), that also involve the NF-κB pathway (52–55).”
BackgroundZhang, Y., Guo, X., Yan, W., Chen, Y., Ke, M., Cheng, C., Zhu, X., Xue, W., Zhou, Q., Zheng, L., et al. (2017) · Nature Communications · doi:10.1038/s41467-017-02355-w · Cited by 109
BAG3 facilitates the clearance of endogenous tau in primary neurons
Lei, Z., Brizzee, C. O., & Johnson, G. V. W. (2014) · Neurobiology of Aging · doi:10.1016/j.neurobiolaging.2014.08.012 · Cited by 107
Molecular chaperones and neuronal proteostasis
Smith, H., Li, W., & Cheetham, M. E. (2015) · Seminars in Cell and Developmental Biology · doi:10.1016/j.semcdb.2015.03.003 · Cited by 108
“autophagosome receptor p62 [34], enabling the recruitment of Hsp70-Hsp22-Bag3 bound cargo into the autophagosome for degradation.”
BackgroundMolecular Chaperones: A Double-Edged Sword in Neurodegenerative Diseases
Tittelmeier, J., Nachman, E., & Nussbaum-Krammer, C. I. (2020) · Frontiers in Aging Neuroscience · doi:10.3389/fnagi.2020.581374 · Cited by 114
“Also, TDP-43 is degraded by chaperone-assisted selective autophagy (CASA), where the sHsp HSPB8 works together with HSC70, BAG3, and CHIP to deliver substrates to autophagy.”
BackgroundInfluentialProtein Homeostasis, Aging and Alzheimer’s Disease
Morawe, T., Hiebel, C., Kern, A., & Behl, C. (2012) · Molecular Neurobiology · doi:10.1007/s12035-012-8246-0 · Cited by 105
“This correlates with decreased levels of BAG1 and increased levels of BAG3 in aged cells, an age-related BAG1/BAG3 switch that serves as an induction control of the macroautophagic pathway (BAG3-mediated selective macroautophagy) and may be considered as a backup of the UPS in PQC ([40, 72]).”
BackgroundInfluentialSelf-citation
Metadata
- Authors
- Gamerdinger, M., Hajieva, P., Kaya, A. M., Wolfrum, U., Hartl, F. U., & Behl, C.
- Affiliations
- Johannes Gutenberg University Mainz (DE)
- Max Planck Institute of Biochemistry (DE)
- Corresponding author
- Behl, Christian
- Venue
- The EMBO Journal
- Published
- 2009-02-19
- Volume
- 28
- Issue
- 7
- Pages
- 889-901
- ISSN
- 0261-4189 (ISSN-L)
- 1460-2075
- PMC
- PMC2647772
- OpenAlex
- W2094186182
- Cited by
- 522
- References
- 42
- Citations by year
- 2026: 20 · 2025: 20 · 2024: 20 · 2023: 24 · 2022: 33 · 2021: 32 · 2020: 25 · 2019: 23 · 2018: 37 · 2017: 47 · 2016: 38 · 2015: 33 · 2014: 32 · 2013: 35 · 2012: 25
- FWCI
- 23.16
- Type
- journal article
- Language
- en
- Open access
- hybrid
- doi.org
- Licence
- Locations
- The EMBO Journal (publishedVersion, cc-by-nc-sa)
- PubMed Central (publishedVersion, cc-by-nc-sa)
- PubMed (publishedVersion)
- Max Planck Institute for Plasma Physics (submittedVersion)
- Topics
- Life Sciences › Biochemistry, Genetics and Molecular Biology › Cell Biology › Autophagy in Disease and Therapy
- Life Sciences › Biochemistry, Genetics and Molecular Biology › Molecular Biology › Heat shock proteins research
- Life Sciences › Biochemistry, Genetics and Molecular Biology › Molecular Biology › Ubiquitin and proteasome pathways
- Keywords
- protein quality control, aging, BAG3, BAG-1, macroautophagy, autophagy, polyubiquitinated proteins, proteasome, p62, LC3-II, cathepsin activity, neuronal aging, brain aging, proteostasis, protein aggregation, oxidative stress
- MeSH terms
- Animals, Autophagy, DNA-Binding Proteins, Humans, Immunohistochemistry, Transcription Factors, Cellular Senescence, Rats, Sprague-Dawley, Microscopy, Electron, Transmission, Proteasome Endopeptidase Complex, Adaptor Proteins, Signal Transducing, Apoptosis Regulatory Proteins, Mice, Rats
About these checks
Registry, retraction, Cites and statistics results are computed, not judged, with one exception: a printed reference that no index lists is read once by a model before it counts as a citation error. Claims are extracted by a model and kept only when their quote appears verbatim in the text; each cited source is then checked, with a model’s help, for whether it says what the claim relies on. Those verdicts can be wrong — read the claim’s quote and the cited source before relying on one.
Statistics and arithmetic are recomputed, not judged.
Confidence bands are shown only for fields calibrated on our annotated test set. None is calibrated yet, so no band is shown.
What counts as a claim ›How we measure confidence ›How we check this ›
Are you an author, or do you see a problem with this page? Request a review
