

The DOI matches its Crossref record; 53 of the 55 references it cites were found in a registry or an index; 69 of the 85 sources its claims cite were checked for support.
Altered mitochondrial dynamics and function in APOE4-expressing astrocytes
Open accessAbstract
APOE4 is a major risk factor for sporadic Alzheimer’s disease; however, it is unclear how it exerts its pathological effects. Others and we have previously shown that autophagy is impaired in APOE4 compared to APOE3 astrocytes, and demonstrated differences in the expression of mitochondrial dynamics proteins in brains of APOE3 and APOE4 transgenic mice. Here, we investigated the effect of APOE4 expression on several aspects of mitochondrial function and network dynamics, including fusion, fission, and mitophagy, specifically in astrocytes. We found that APOE3 and APOE4 astrocytes differ in their mitochondrial dynamics, suggesting that the mitochondria of APOE4 astrocytes exhibit reduced fission and mitophagy. APOE4 astrocytes also show impaired mitochondrial function. Importantly, the autophagy inducer rapamycin enhanced mitophagy and improved mitochondrial functioning in APOE4 astrocytes. Collectively, the results demonstrate that APOE4 expression is associated with altered mitochondrial dynamics, which might lead to impaired mitochondrial function in astrocytes. This, in turn, may contribute to the pathological effects of APOE4 in Alzheimer’s disease.
Overview
AI snapshot
Written from the paper’s full text.
TL;DR
APOE4-expressing astrocytes show altered mitochondrial dynamics—reduced fission and parkin-mediated mitophagy—and impaired mitochondrial function compared with APOE3 astrocytes. Rapamycin-induced mitophagy improved mitochondrial function in APOE4 astrocytes, suggesting a possible rescue pathway.
Key findings
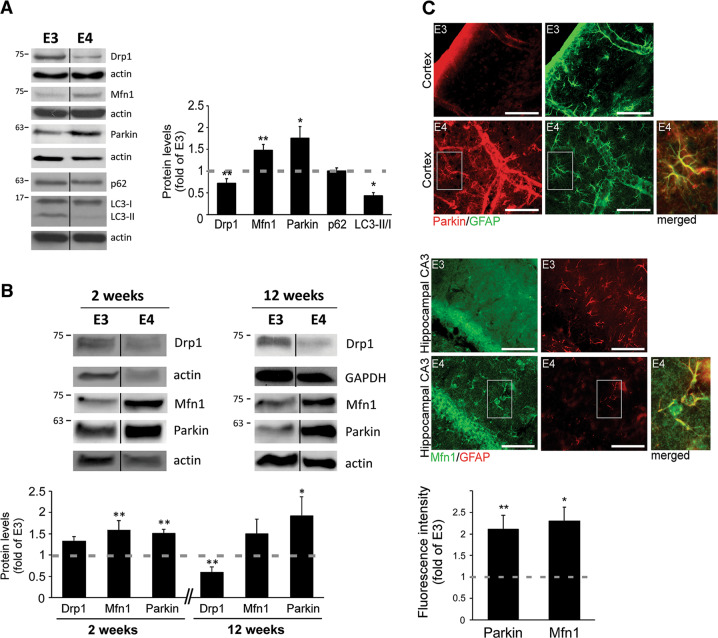
- APOE4 astrocytes had lower Drp1 (fission), higher Mfn1 (fusion), and increased parkin levels; they also showed a reduced LC3-II/LC3-I ratio, indicating decreased autophagy. Similar mitochondrial-dynamics protein changes were detected in primary APOE4 mouse astrocytes and in GFAP-positive astrocytes in APOE3/APOE4 mouse brain sections.
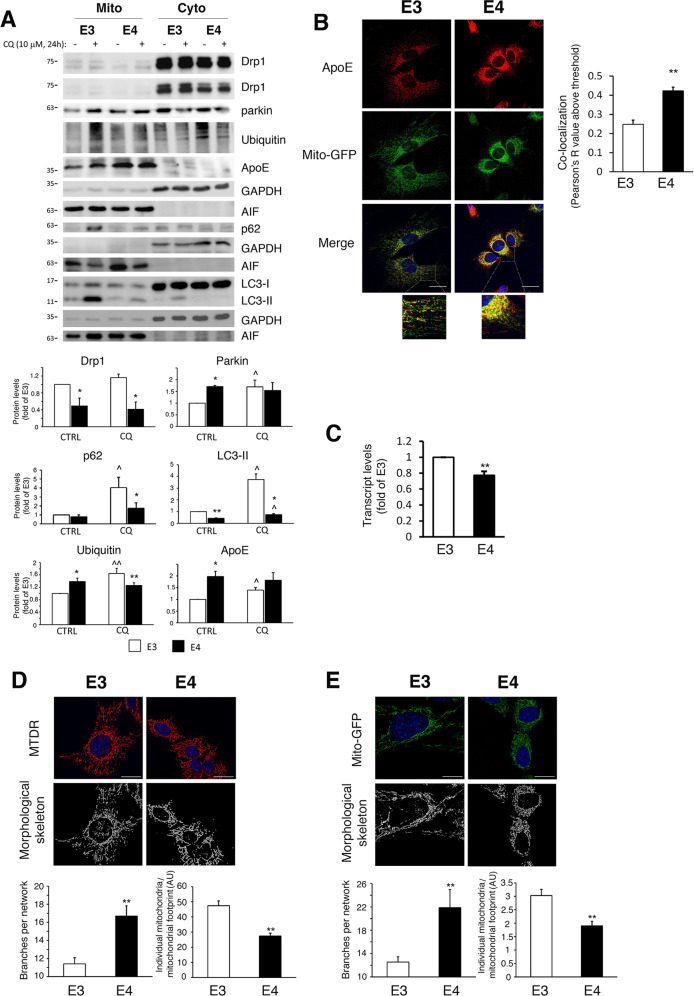
- Mitochondrial networks in APOE4 astrocytes were more hyperfused, with more branching and fewer individual mitochondria (n ≥ 50 cells).
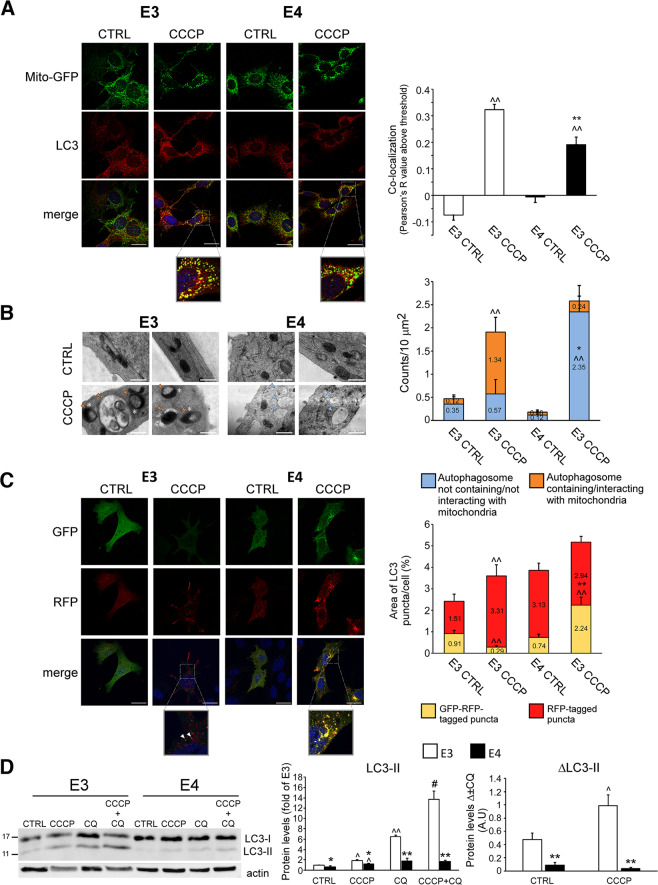
- After CCCP-induced mitochondrial damage, mitophagy was impaired in APOE4 astrocytes: ~90% of autophagosomes in APOE3 astrocytes were fused with lysosomes versus ~55% in APOE4 astrocytes; EM showed APOE4 astrocytes formed autophagosomes that did not contain mitochondria.
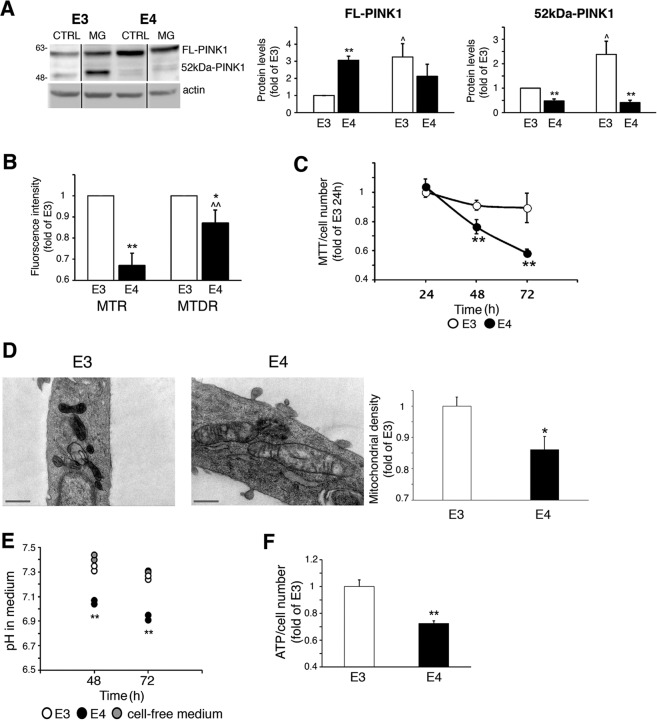
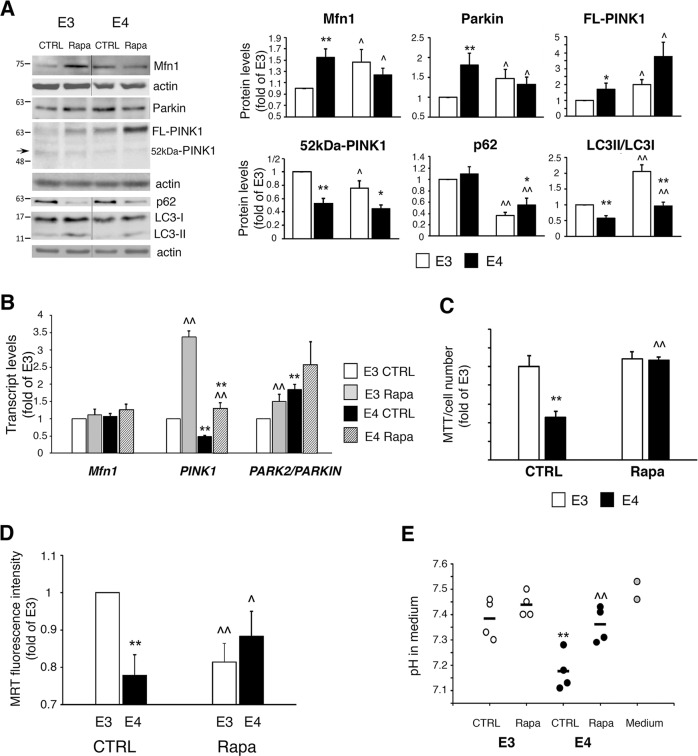
- APOE4 astrocytes showed impaired mitochondrial function, including lower MMP-sensitive MitoTracker Red fluorescence, higher full-length PINK1 and lower cleaved PINK1, reduced MTT metabolism, less dense cristae, lower medium pH, and reduced ATP levels. Rapamycin (150 nM) enhanced mitophagy and restored mitochondrial metabolism, augmented MMP, and corrected medium pH in APOE4 astrocytes.
Methods
- Human APOE3/APOE4 targeted-replacement astrocyte cell lines, mouse primary astrocytes, and brain sections from APOE3/APOE4 targeted-replacement mice were used.
- Analyses included immunoblot, immunoprecipitation, mitochondrial fractionation, qRT-PCR, confocal microscopy with MitoTracker/Mito-GFP and MiNa morphology analysis, electron microscopy, MTT and CellTiter-Glo assays, flow cytometry for MMP/mitochondrial mass, and medium pH measurement.
- Experiments were performed at least 3 times; differences were tested with one-sided Student’s t test, with p < 0.05 considered significant.
Limitations
- The paper states that the mechanism by which APOE4 affects mitochondrial dynamics is yet to be investigated; it may involve direct apoE4 interaction with mitochondria or indirect effects through autophagy/lysosomal machinery.
- Evident from the text: most mechanistic work uses immortalized APOE3/APOE4 astrocyte cell lines and mouse primary astrocytes, with limited in vivo functional rescue data; rapamycin restoration was shown in cultured astrocytes, not in mice or human tissue.
- Evident from the text: some findings were context-dependent, e.g., Drp1 differences in primary astrocytes were detected only in 12-week cultures, and the hyperfused APOE4 network was not accompanied by greater mitochondrial mass, suggesting a static hyperfused state rather than increased biogenesis.
Model-written summary. Check it against the paper before relying on it.
Integrity signals
Registry
Cites
Statistics
Figures
Verification
Claims the paper makes
62 Own result · 38 Own interpretation · 20 Partly supported · 17 Supported · 7 Supported so far · 4 No full text of the sources · 3 Own method · 2 Couldn’t confirm · 2 No basis given · accuracy not yet measured
The cited sources that could be checked couldn’t confirm or dispute this claim.
In the paper
“indicating decreased autophagy30”
§ Altered mitochondrial dynamics and function in APOE4-expressing astrocytes > Results > Altered mitochondrial dynamics proteins expression and morphology in APOE4 astrocytes
What the sources say
- Could not verifycites [30] Klionsky, D. J. et al. Guidelines for the use and interpretation of assays for monitoring autophagy (3rd edition). Autophagy 12, 1–222 (2016). sourceExperimental — accuracy not yet measured
The selective-autophagy section (p. 141) mentions astrocytes degrading axon-derived mitochondria, but does not discuss APOE4 or reduced autophagy in APOE4 astrocytes. Searches for APOE4, apolipoprotein E, and astrocytes found no passage in our copy that addresses the claimed decrease; the copy is also marked as truncated. (LLM, conf=0.70)
hedgeddirect- Asserted: passes — The authors put it forward as true.
- Checkable: passes — It can be checked against evidence.
- Load-bearing: passes — The paper’s conclusions depend on it.
- Based: passes — The paper gives a reason why it holds.
- Could not verify
The sources with a verdict support this claim; the rest weren’t checked yet, have no full text we could read, or their verdicts aren’t rated yet.
In the paper
“Previously, others and we have found that APOE4 is associated with impaired autophagy in astrocytes13,14, which is linked to reduced clearance of Aβ plaques and protein aggregates13,14.”
- Also stated in: § Abstract · boosted
“Others and we have previously shown that autophagy is impaired in APOE4 compared to APOE3 astrocytes”
- Also stated in: § Discussion · plain
“APOE4 is associated with impaired autophagy in astrocytes13,14”
§ Altered mitochondrial dynamics and function in APOE4-expressing astrocytes > Introduction
What the sources say
- Not checked — no full text of the sourcecites [13] Simonovitch, S. et al. Impaired autophagy in APOE4 astrocytes. J. Alzheimers Dis. 51, 915–927 (2016). source
- Supportedcites [14] Parcon, P. A., et al. Apolipoprotein E4 inhibits autophagy gene products through direct, specific binding to CLEAR motifs. Alzheimer’s Demen. https://doi.org/10.1016/j.jalz.2017.07.754 (2017). source
The Discussion explicitly reports lower autophagy in astrocytes from apoE4-targeted replacement mice. It also reports reduced ability to clear amyloid plaques in those astrocytes. Although the paper cites an earlier study for this finding, reporting and relying on that finding supports the attributed claim. (LLM, conf=0.93)
boostedcorrelational- Asserted: passes — The authors put it forward as true.
- Checkable: passes — It can be checked against evidence.
- Load-bearing: passes — The paper’s conclusions depend on it.
- Based: passes — The paper gives a reason why it holds.
- Also stated in: § Abstract · boosted
Every source the paper cites for this claim was checked and supports it.
In the paper
“Also, our recent findings revealed differences in the expression of mitochondrial dynamics proteins in APOE4 transgenic mouse brains15.”
- Also stated in: § Abstract · boosted
“demonstrated differences in the expression of mitochondrial dynamics proteins in brains of APOE3 and APOE4 transgenic mice”
§ Altered mitochondrial dynamics and function in APOE4-expressing astrocytes > Introduction
What the sources say
- Supportedcites [15] Simonovitch, S., Schmukler, E., Masliah, E., Pinkas-Kramarski, R. & Michaelson, D. M. The effects of APOE4 on mitochondrial dynamics and proteins in vivo. J. Alzheimers Dis. 70, 861–875 (2019). source
The Introduction describes mice whose Apoe gene was replaced with human APOE4 or APOE3. The Results report higher MFN1 and lower DRP-1 protein levels in ApoE4 mouse hippocampi than in ApoE3 controls, directly supporting the claimed differences in mitochondrial-dynamics protein expression. (LLM, conf=0.94)
boostedcorrelational- Asserted: passes — The authors put it forward as true.
- Checkable: passes — It can be checked against evidence.
- Load-bearing: passes — The paper’s conclusions depend on it.
- Based: passes — The paper gives a reason why it holds.
- Also stated in: § Abstract · boosted
The cited sources support only part of this claim — read each source’s verdict below.
In the paper
“increased parkin levels (targets mitochondria for mitophagy, followed by proteasomal/lysosomal degradation26–29)”
§ Altered mitochondrial dynamics and function in APOE4-expressing astrocytes > Results > Altered mitochondrial dynamics proteins expression and morphology in APOE4 astrocytes
What the sources say
- Partly supportedcites [26] Vives-Bauza, C. et al. PINK1-dependent recruitment of Parkin to mitochondria in mitophagy. Proc. Natl Acad. Sci. USA 107, 378–383 (2010). sourceExperimental — accuracy not yet measured
The paper’s discussion of the findings (indexed as Abstract; page unavailable) reports PINK1-dependent recruitment of Parkin to mitochondria and proposes that damaged mitochondria are delivered to perinuclear lysosomes for autophagic degradation. It does not support the parenthetical’s additional reference to proteasomal degradation. The citation is attached to that mechanistic explanation, not to the citing authors’ observation of increased Parkin levels in APOE4 astrocytes. (LLM, conf=0.86)
- Partly supportedcites [27] Narendra, D., Tanaka, A., Suen, D. F. & Youle, R. J. Parkin is recruited selectively to impaired mitochondria and promotes their autophagy. J. Cell Biol. 183, 795–803 (2008). sourceExperimental — accuracy not yet measured
The citation is attached to the parenthetical mechanism, not the observation of increased Parkin levels in APOE4 astrocytes. The Results and discussion (page unavailable) show that Parkin is recruited to impaired mitochondria and promotes their autophagic, lysosome-dependent removal, but do not establish the claimed proteasomal degradation step. (LLM, conf=0.85)
- Supportedcites [28] Seirafi, M., Kozlov, G. & Gehring, K. Parkin structure and function. FEBS J. 282, 2076–2088 (2015). source
The citation is attached to the parenthetical account of parkin’s role in mitochondrial clearance, not to the statement that APOE4 astrocytes have increased parkin levels. The sections “Parkin is an RBR E3 ubiquitin ligase” and “Parkin recruitment to mitochondria” describe parkin-dependent recruitment of autophagosome and proteasome machinery and elimination of damaged mitochondria by autophagy. No page numbers are available in our copy. (LLM, conf=0.87)
- Supportedcites [29] Rakovic, A. et al. Phosphatase and tensin homolog (PTEN)-induced putative kinase 1 (PINK1)-dependent ubiquitination of endogenous Parkin attenuates mitophagy: study in human primary fibroblasts and induced pluripotent stem cell-derived neurons. J. Biol. Chem. 288, 2223–2237 (2013). source
The citation is attached to the parenthetical description of Parkin’s role, not to the citing authors’ observation of increased Parkin in APOE4 astrocytes. The source’s introductory passage (page unavailable) describes Parkin recruitment to depolarized mitochondria, their degradation by mitophagy, and proteasomal degradation of mitochondrial proteins. It does not make a claim about APOE4 astrocytes. (LLM, conf=0.88)
plaincorrelational- Asserted: passes — The authors put it forward as true.
- Checkable: passes — It can be checked against evidence.
- Load-bearing: passes — The paper’s conclusions depend on it.
- Based: passes — The paper gives a reason why it holds.
- Rests on an assumption: The human APOE3 and APOE4 targeted-replacement astrocyte cell lines differ only in APOE genotype.
- Partly supported
The cited sources support only part of this claim — read each source’s verdict below.
In the paper
“Mitochondrial dysfunction plays a fundamental role in AD pathogenesis2 and represents an early event2.”
§ Altered mitochondrial dynamics and function in APOE4-expressing astrocytes > Introduction
What the sources say
- Partly supportedcites [2] Swerdlow, R. H. Mitochondria and mitochondrial cascades in Alzheimer’s disease. J. Alzheimer’s Dis.: JAD 62, 1403–1416 (2018). sourceExperimental — accuracy not yet measured
The Conclusions state that mitochondrial and bioenergetic changes seem to precede detectable changes in Aβ homeostasis, supporting an early role in AD. But the paper also says both primary and secondary mitochondrial cascades are possible, so it does not establish mitochondrial dysfunction as an early event in all AD cases. (LLM, conf=0.84)
plaindirect- Asserted: passes — The authors put it forward as true.
- Checkable: passes — It can be checked against evidence.
- Load-bearing: passes — The paper’s conclusions depend on it.
- Based: passes — The paper gives a reason why it holds.
- Partly supported
The sources with a verdict support this claim; the rest weren’t checked yet, have no full text we could read, or their verdicts aren’t rated yet.
In the paper
“rapamycin treatment, which was shown to stimulate mitophagy40,41,53, partially improved APOE4 astrocytes’ mitochondrial function.”
§ Altered mitochondrial dynamics and function in APOE4-expressing astrocytes > Discussion
What the sources say
- Not checked — no full text of the sourcecites [40] Bartolome, A. et al. MTORC1 regulates both general autophagy and mitophagy induction after oxidative phosphorylation uncoupling. Mol. Cellular Biol. 37, e00441 (2017). source
- Not checked — no full text of the sourcecites [41] Li, Q. et al. Rapamycin attenuates mitochondrial dysfunction via activation of mitophagy in experimental ischemic stroke. Biochem. Biophys. Res. Commun. 444, 182–188 (2014). source
- Supportedcites [53] Ebrahimi-Fakhari, D. et al. Impaired mitochondrial dynamics and mitophagy in neuronal models of tuberous sclerosis complex. Cell Rep. 17, 1053–1070 (2016). source
The citation is attached to the statement that rapamycin stimulates mitophagy, not to the citing authors’ finding about APOE4 astrocytes. In the Results section on stimulating autophagy (Fig. 7B), the paper reports that rapamycin stimulated recruitment of autophagosomes to damaged mitochondria, although acute treatment did not substantially increase global mitochondrial turnover (Fig. 7A). (LLM, conf=0.88)
plaindirect- Asserted: passes — The authors put it forward as true.
- Checkable: passes — It can be checked against evidence.
- Load-bearing: passes — The paper’s conclusions depend on it.
- Based: passes — The paper gives a reason why it holds.
The sources with a verdict support this claim; the rest weren’t checked yet, have no full text we could read, or their verdicts aren’t rated yet.
In the paper
“their fluorescence of MitoTracker Deep Red, which is less sensitive to MMP21,24,25, was significantly greater compared to MitoTracker Red (Fig. 5b)”
§ Altered mitochondrial dynamics and function in APOE4-expressing astrocytes > Results > APOE4 astrocytes exhibit impaired mitochondrial function
What the sources say
- Not checked — no full text of the sourcecites [21] Esteban-Martinez, L., Villarejo-Zori, B. & Boya, P. Cytofluorometric assessment of mitophagic flux in mammalian cells and tissues. Methods Enzymol. 588, 209–217 (2017). source
- Supportedcites [24] Mauro-Lizcano, M. et al. New method to assess mitophagy flux by flow cytometry. Autophagy 11, 833–843 (2015). source
The citation is attached to the statement that MitoTracker Deep Red is less sensitive to mitochondrial membrane potential, not to the citing authors’ APOE4 astrocyte result in Fig. 5b. The source paper’s Discussion says that the probe remains in mitochondria independently of altered membrane potential after binding, and that its fluorescence changes do not merely reflect membrane-potential changes. (LLM, conf=0.84)
- Could not verifycites [25] Ebrahimi-Fakhari, D. et al. Impaired mitochondrial dynamics and mitophagy in neuronal models of tuberous sclerosis complex. Cell Rep. 17, 2162 (2016). sourceExperimental — accuracy not yet measured
The citation in the printed sentence appears attached to the statement that MitoTracker Deep Red is less sensitive to mitochondrial membrane potential; the fluorescence comparison is attributed to the citing paper’s Fig. 5b. Searches of our copy for the MitoTracker dyes, membrane-potential sensitivity, and APOE4 astrocytes found no passage addressing either point. The available Acknowledgments and correction text provide no relevant evidence. (LLM, conf=0.73)
plaincorrelational- Asserted: passes — The authors put it forward as true.
- Checkable: passes — It can be checked against evidence.
- Load-bearing: passes — The paper’s conclusions depend on it.
- Based: passes — The paper gives a reason why it holds.
Every source the paper cites for this claim was checked and supports it.
In the paper
“suggestive of increased compensatory glycolysis39 (Fig. 5e)”
§ Altered mitochondrial dynamics and function in APOE4-expressing astrocytes > Results > APOE4 astrocytes exhibit impaired mitochondrial function
What the sources say
- Supportedcites [39] Celotto, A. M., Chiu, W. K., Van Voorhies, W. & Palladino, M. J. Modes of metabolic compensation during mitochondrial disease using the Drosophila model of ATP6 dysfunction. PLoS ONE 6, e25823 (2011). source
The Results section (‘Metabolic compensation: glycolysis’) uses lactic acid as a measure of glycolytic flux and reports increased lactic acid in young ATP6-mutant flies, interpreting increased glycolysis as an early compensatory mechanism. The citation supports the proposed glycolysis interpretation; the lower medium pH in APOE4 astrocytes is the citing paper’s observation, not a finding attributed to this source. (LLM, conf=0.86)
hedgedconditional- Asserted: passes — The authors put it forward as true.
- Checkable: passes — It can be checked against evidence.
- Load-bearing: unclear — It is unclear whether the paper’s conclusions depend on it.
- Based: passes — The paper gives a reason why it holds.
- Supported
The cited sources support only part of this claim — read each source’s verdict below.
In the paper
“less dense cristae, which is another indicator of impaired mitochondrial activity37,38”
§ Altered mitochondrial dynamics and function in APOE4-expressing astrocytes > Results > APOE4 astrocytes exhibit impaired mitochondrial function
What the sources say
- Partly supportedcites [37] Woods, D. C. Mitochondrial heterogeneity: evaluating mitochondrial subpopulation dynamics in stem cells. Stem Cells Int. 2017, 7068567 (2017). sourceExperimental — accuracy not yet measured
In §1, “Mitochondrial Structure and Diversity” (page not provided), the paper associates low cristae density with slow respiration and describes stem-cell mitochondria with few cristae as having limited oxidative capacity. That supports a link to lower mitochondrial activity, but the paper also presents sparse cristae as a normal feature of stem cells, not necessarily an indicator of impairment. (LLM, conf=0.84)
- Not checked — no full text of the sourcecites [38] Nielsen, J. et al. Plasticity in mitochondrial cristae density allows metabolic capacity modulation in human skeletal muscle. J. Physiol. 595, 2839–2847 (2017). source
hedgedcorrelational- Asserted: passes — The authors put it forward as true.
- Checkable: passes — It can be checked against evidence.
- Load-bearing: passes — The paper’s conclusions depend on it.
- Based: passes — The paper gives a reason why it holds.
- Partly supported
The cited sources support only part of this claim — read each source’s verdict below.
In the paper
“the APOE4 astrocytes exhibit reduced mitochondrial metabolism as measured by MTT20,36 (Fig. 5c)”
§ Altered mitochondrial dynamics and function in APOE4-expressing astrocytes > Results > APOE4 astrocytes exhibit impaired mitochondrial function
What the sources say
- Partly supportedcites [20] Rai, Y. et al. Mitochondrial biogenesis and metabolic hyperactivation limits the application of MTT assay in the estimation of radiation induced growth inhibition. Sci. Rep. 8, 1531 (2018). sourceExperimental — accuracy not yet measured
The Introduction (page unavailable) says the MTT assay measures mitochondrial metabolic rate, supporting the use of MTT as a metabolic measure. The paper does not report a reduction in APOE4 astrocytes; its findings concern irradiated cells. (LLM, conf=0.87)
- Partly supportedcites [36] Aguer, C. et al. Galactose enhances oxidative metabolism and reveals mitochondrial dysfunction in human primary muscle cells. PLoS ONE 6, e28536 (2011). sourceExperimental — accuracy not yet measured
The Materials and Methods section (‘Cell redox environment’) uses MTT to assess cellular redox state, and the Discussion explains how MTT reduction reflects cellular NAD(P)H. The paper studies human muscle cells, not APOE4 astrocytes, and does not report reduced mitochondrial metabolism in those cells. It supports the use of MTT as a metabolic readout, but not the stated APOE4 finding. (LLM, conf=0.87)
plaindirect- Asserted: passes — The authors put it forward as true.
- Checkable: passes — It can be checked against evidence.
- Load-bearing: passes — The paper’s conclusions depend on it.
- Based: passes — The paper gives a reason why it holds.
- Partly supported
- Probably not a substantial claim. 29
- It may state two separate claims as one. 39
- The quote only partly states this claim. 1
Every source the paper cites for this claim was checked and supports it.
In the paper
“Several pathways mediate mitophagy, including the PINK1/parkin pathway5,8.”
§ Altered mitochondrial dynamics and function in APOE4-expressing astrocytes > Introduction
What the sources say
- Supportedcites [5] Pickles, S., Vigie, P. & Youle, R. J. Mitophagy and quality control mechanisms in mitochondrial maintenance. Curr. Biol. 28, R170–R185 (2018). source
The section 'The Many Faces of Mitophagy' describes PINK1/Parkin-dependent mitophagy alongside distinct mechanisms involving Atg32, NIX and BNIP3. This supports the claim that several pathways mediate mitophagy, including PINK1/Parkin. (LLM, conf=0.94)
- Supportedcites [8] Truban, D., Hou, X., Caulfield, T. R., Fiesel, F. C. & Springer, W. PINK1, parkin, and mitochondrial quality control: what can we learn about Parkinson’s disease pathobiology? J. Parkinson’s Dis. 7, 13–29 (2017). source
The PINK1/Parkin-directed mitochondrial quality control section identifies mitophagy as a well-characterized function of the PINK1/Parkin pathway and describes how it targets damaged mitochondria for clearance. This supports the claim for which the citation is attached: that PINK1/Parkin is a mitophagy pathway. (LLM, conf=0.92)
plaindirect- Asserted: passes — The authors put it forward as true.
- Checkable: passes — It can be checked against evidence.
- Load-bearing: fails — The paper’s conclusions may not depend on it.
- Based: passes — The paper gives a reason why it holds.
Probably not a substantial claim. The paper’s conclusions may not depend on it.
- Supported
Every source the paper cites for this claim was checked and supports it.
In the paper
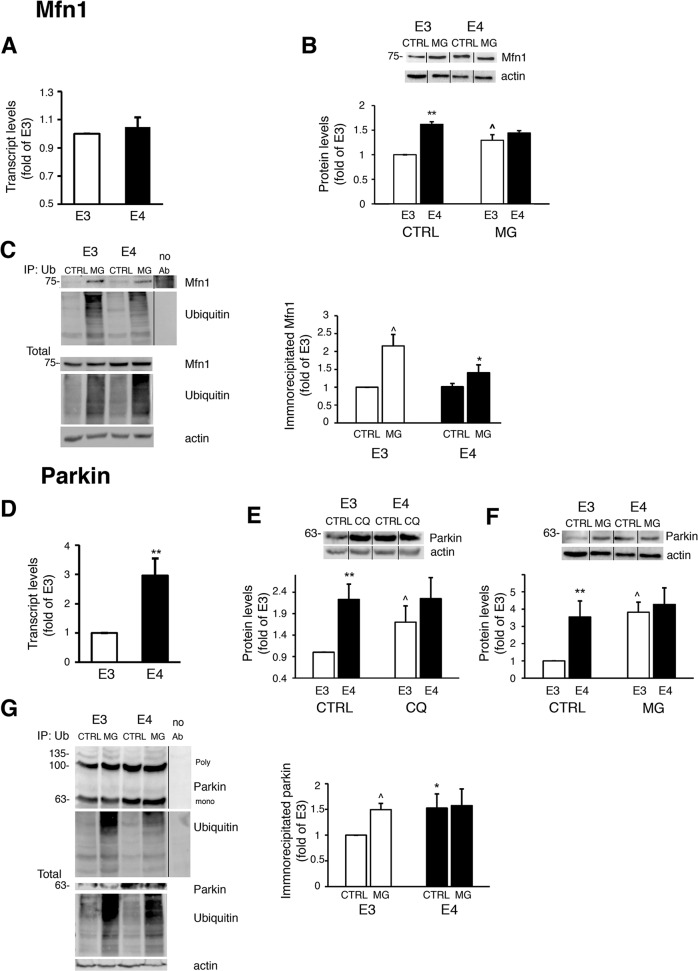
“During mitophagy, Mfn1 undergoes ubiquitination by parkin followed by proteasomal degradation, which suppresses mitochondrial fusion and allows the removal of mitochondria from the network8.”
§ Altered mitochondrial dynamics and function in APOE4-expressing astrocytes > Results > APOE4-expressing astrocytes exhibit altered synthesis, ubiquitination and proteasomal/lysosomal degradation of mitochondrial dynamics proteins
What the sources say
- Supportedcites [8] Truban, D., Hou, X., Caulfield, T. R., Fiesel, F. C. & Springer, W. PINK1, parkin, and mitochondrial quality control: what can we learn about Parkinson’s disease pathobiology? J. Parkinson’s Dis. 7, 13–29 (2017). source
The PINK1/Parkin-directed mitochondrial quality control section (page not provided) identifies Mitofusin-1 as a Parkin-pathway target eliminated via the proteasome. It says this prevents damaged mitochondria from rejoining the healthy network and facilitates their later engulfment by autophagosomes. (LLM, conf=0.90)
plaindirect- Asserted: passes — The authors put it forward as true.
- Checkable: passes — It can be checked against evidence.
- Load-bearing: passes — The paper’s conclusions depend on it.
- Based: passes — The paper gives a reason why it holds.
Probably not a substantial claim. It may state two separate claims as one.
- Supported
Every source the paper cites for this claim was checked and supports it.
In the paper
“the levels of two other mitochondrial parkin substrates, namely Tom40 and Tom2035, exhibited higher levels in APOE4 astrocytes (Fig. S2d).”
§ Altered mitochondrial dynamics and function in APOE4-expressing astrocytes > Results > APOE4-expressing astrocytes exhibit altered synthesis, ubiquitination and proteasomal/lysosomal degradation of mitochondrial dynamics proteins
What the sources say
- Supportedcites [35] Yoshii, S. R., Kishi, C., Ishihara, N. & Mizushima, N. Parkin mediates proteasome-dependent protein degradation and rupture of the outer mitochondrial membrane. J. Biol. Chem. 286, 19630–19640 (2011). source
The citation is attached to the identification of Tom40 and Tom20 as mitochondrial Parkin substrates, not to the citing authors’ observation of higher levels in APOE4 astrocytes (Fig. S2d). The source’s Results section reports Parkin-dependent degradation of both proteins after mitochondrial depolarization. (LLM, conf=0.93)
plaincorrelational- Asserted: passes — The authors put it forward as true.
- Checkable: passes — It can be checked against evidence.
- Load-bearing: passes — The paper’s conclusions depend on it.
- Based: passes — The paper gives a reason why it holds.
It may state two separate claims as one.
- Supported
Every source the paper cites for this claim was checked and supports it.
In the paper
“Several studies demonstrated a link between APOE4 and mitochondrial dysfunction, mainly in neurons9–11; yet the effect of APOE4 on mitochondrial dynamics was less studied.”
§ Altered mitochondrial dynamics and function in APOE4-expressing astrocytes > Introduction
What the sources say
- Supportedcites [9] Dose, J., Huebbe, P., Nebel, A. & Rimbach, G. APOE genotype and stress response—a mini review. Lipids Health Dis. 15, 121 (2016). source
The section “Association of the APOE genotype with the ER stress response and mitochondrial function” (page not provided) reports multiple studies linking APOE4 to impaired mitochondrial function. It describes greater mitochondrial dysfunction in APOE4 than APOE3 neurons and notes that astrocytes in one study showed no genotype-specific effect, supporting the qualification “mainly in neurons.” (LLM, conf=0.93)
- Supportedcites [10] Nakamura, T., Watanabe, A., Fujino, T., Hosono, T. & Michikawa, M. Apolipoprotein E4 (1-272) fragment is associated with mitochondrial proteins and affects mitochondrial function in neuronal cells. Mol. Neurodegeneration 4, 35 (2009). source
The Results section reports lower mitochondrial respiratory complex III and IV activities in neuronal Neuro2a cells expressing the apoE4(1–272) fragment than in cells expressing intact apoE4. This supports citing the study as one example of a link between APOE4 and mitochondrial dysfunction in neuronal cells; it does not need to establish the findings of the other studies cited alongside it. (LLM, conf=0.93)
- Supportedcites [11] Chen, H. K. et al. Apolipoprotein E4 domain interaction mediates detrimental effects on mitochondria and is a potential therapeutic target for Alzheimer disease. J. Biol. Chem. 286, 5215–5221 (2011). source
The Discussion reports that apoE4 reduced mitochondrial respiratory-complex expression and impaired respiratory function in neuronal cells. The neuronal-cell results also show lower levels of respiratory-complex subunits in apoE4-expressing neurons than in apoE3-expressing neurons. This paper therefore supports its cited role as one study linking apoE4 to mitochondrial dysfunction, mainly in neurons. (LLM, conf=0.92)
boostedcorrelational- Asserted: passes — The authors put it forward as true.
- Checkable: passes — It can be checked against evidence.
- Load-bearing: passes — The paper’s conclusions depend on it.
- Based: passes — The paper gives a reason why it holds.
Probably not a substantial claim.
- Supported
The cited sources support only part of this claim — read each source’s verdict below.
In the paper
“Damaged mitochondria are degraded by selective autophagy, termed mitophagy, following fission5.”
§ Altered mitochondrial dynamics and function in APOE4-expressing astrocytes > Introduction
What the sources say
- Partly supportedcites [5] Pickles, S., Vigie, P. & Youle, R. J. Mitophagy and quality control mechanisms in mitochondrial maintenance. Curr. Biol. 28, R170–R185 (2018). sourceExperimental — accuracy not yet measured
The Introduction (page not provided) defines mitophagy as selective autophagic elimination of mitochondria, and the Mitophagy in mammals section includes mitochondrial damage as a trigger. But the Quality control at the sub-organelle level section describes fission and autophagosome formation as coupled and says loss of Drp1 delays, but does not abolish, mitophagy. It does not support presenting fission as a step that always precedes degradation. (LLM, conf=0.85)
plaindirect- Asserted: passes — The authors put it forward as true.
- Checkable: passes — It can be checked against evidence.
- Load-bearing: fails — The paper’s conclusions may not depend on it.
- Based: passes — The paper gives a reason why it holds.
Probably not a substantial claim. The paper’s conclusions may not depend on it.
- Partly supported
Every source the paper cites for this claim was checked and supports it.
In the paper
“Several proteins are required for mitochondrial fusion, including the mitofusins (Mfn1/Mfn2)3,4.”
§ Altered mitochondrial dynamics and function in APOE4-expressing astrocytes > Introduction
What the sources say
- Supportedcites [3] Eisner, V., Picard, M. & Hajnoczky, G. Mitochondrial dynamics in adaptive and maladaptive cellular stress responses. Nat. Cell Biol. 20, 755–765 (2018). source
The “Mitochondrial fusion and fission dynamics” section describes outer mitochondrial membrane merging as mediated by MFN1 and MFN2 GTPases, and inner membrane fusion as mediated by OPA1. This supports the claim that several proteins participate in mitochondrial fusion, including both mitofusins. (LLM, conf=0.94)
- Supportedcites [4] Tilokani, L., Nagashima, S., Paupe, V. & Prudent, J. Mitochondrial dynamics: overview of molecular mechanisms. Essays Biochem. 62, 341–360 (2018). source
The section “Mitofusins and outer mitochondrial membrane fusion” identifies Mfn1 and Mfn2 as the proteins that ensure outer mitochondrial membrane fusion. Its Figure 3 description also identifies OPA1 as driving inner membrane fusion, supporting the claim that several proteins participate in mitochondrial fusion. (LLM, conf=0.94)
plaindirect- Asserted: passes — The authors put it forward as true.
- Checkable: passes — It can be checked against evidence.
- Load-bearing: fails — The paper’s conclusions may not depend on it.
- Based: passes — The paper gives a reason why it holds.
Probably not a substantial claim. The paper’s conclusions may not depend on it.
- Supported
Every source the paper cites for this claim was checked and supports it.
In the paper
“The mitochondrial kinase PINK1 is stabilized on the OMM leading to the recruitment and activation of parkin (E3 ubiquitin ligase), which ubiquitinates several mitochondrial proteins leading to mitophagy5,8.”
§ Altered mitochondrial dynamics and function in APOE4-expressing astrocytes > Introduction
What the sources say
- Supportedcites [5] Pickles, S., Vigie, P. & Youle, R. J. Mitophagy and quality control mechanisms in mitochondrial maintenance. Curr. Biol. 28, R170–R185 (2018). source
The “Parkin and PINK1-dependent mitophagy” section says that when mitochondrial protein import is compromised, PINK1 stabilizes on the outer mitochondrial membrane. It then describes Parkin recruitment and activation, ubiquitination of multiple substrates, and PINK1/Parkin-dependent mitophagy. (LLM, conf=0.94)
- Supportedcites [8] Truban, D., Hou, X., Caulfield, T. R., Fiesel, F. C. & Springer, W. PINK1, parkin, and mitochondrial quality control: what can we learn about Parkinson’s disease pathobiology? J. Parkinson’s Dis. 7, 13–29 (2017). source
In “The Life Cycle of PINK1,” the review says full-length PINK1 accumulates and is stabilized on the outer mitochondrial membrane after damage. “PINK1-Mediated Parkin Activation” describes Parkin’s recruitment, activation, and ubiquitination of outer-membrane proteins; “PINK1/Parkin-Directed Mitochondrial Quality Control” connects the resulting ubiquitin signal to mitophagy. (LLM, conf=0.93)
plaindirect- Asserted: passes — The authors put it forward as true.
- Checkable: passes — It can be checked against evidence.
- Load-bearing: fails — The paper’s conclusions may not depend on it.
- Based: passes — The paper gives a reason why it holds.
Probably not a substantial claim. The paper’s conclusions may not depend on it. It may state two separate claims as one.
- Supported
Every source the paper cites for this claim was checked and supports it.
In the paper
“Mitochondrial fusion is enhanced under stress and high energetic demands, allowing increased bioenergetic efficiency7.”
§ Altered mitochondrial dynamics and function in APOE4-expressing astrocytes > Introduction
What the sources say
- Supportedcites [7] Westermann, B. Bioenergetic role of mitochondrial fusion and fission. Biochim. Biophys. Acta 1817, 1833–1838 (2012). source
Section 3 reports increased fusion in response to some cell stressors, accompanied by increased ATP production, and describes fusion as advantageous under high energy demand. The Conclusions say fused networks help maximize ATP synthesis and optimize mitochondrial function under certain forms of stress. (LLM, conf=0.90)
plaindirect- Asserted: passes — The authors put it forward as true.
- Checkable: passes — It can be checked against evidence.
- Load-bearing: fails — The paper’s conclusions may not depend on it.
- Based: passes — The paper gives a reason why it holds.
Probably not a substantial claim. The paper’s conclusions may not depend on it.
- Supported
The cited sources support only part of this claim — read each source’s verdict below.
In the paper
“Proteasomal degradation of parkin was demonstrated during mitophagy due to autoubiquitination, halting its activity28,29,33,34.”
§ Altered mitochondrial dynamics and function in APOE4-expressing astrocytes > Results > APOE4-expressing astrocytes exhibit altered synthesis, ubiquitination and proteasomal/lysosomal degradation of mitochondrial dynamics proteins
What the sources say
- Partly supportedcites [28] Seirafi, M., Kozlov, G. & Gehring, K. Parkin structure and function. FEBS J. 282, 2076–2088 (2015). sourceExperimental — accuracy not yet measured
The section ‘Parkin is an RBR E3 ubiquitin ligase’ (page unavailable) says parkin becomes ubiquitinated and that this may play a role in its own degradation during the mitophagy pathway. It does not establish that parkin is degraded by the proteasome, that autoubiquitination causes that degradation, or that degradation halts its activity. (LLM, conf=0.88)
- Partly supportedcites [29] Rakovic, A. et al. Phosphatase and tensin homolog (PTEN)-induced putative kinase 1 (PINK1)-dependent ubiquitination of endogenous Parkin attenuates mitophagy: study in human primary fibroblasts and induced pluripotent stem cell-derived neurons. J. Biol. Chem. 288, 2223–2237 (2013). sourceExperimental — accuracy not yet measured
The Discussion (page not provided) says endogenous Parkin becomes self-ubiquitinated during mitochondrial depolarization and is likely degraded through the ubiquitin–proteasome system. It proposes that this reduces the Parkin available to translocate to mitochondria, attenuating further mitophagy; it does not demonstrate that Parkin’s activity halts. (LLM, conf=0.87)
- Partly supportedcites [33] Chaugule, V. K. et al. Autoregulation of Parkin activity through its ubiquitin-like domain. EMBO J. 30, 2853–2867 (2011). sourceExperimental — accuracy not yet measured
The Discussion (page unavailable) describes proteasomal degradation of Parkin mutants and proposes that autoubiquitination may lead to Parkin degradation and inactivation. It does not demonstrate that this occurs during mitophagy; it instead suggests that autoubiquitination and degradation of wild-type Parkin are absent or prevented in normal cellular conditions. (LLM, conf=0.88)
- Partly supportedcites [34] Byrd, R. A. & Weissman, A. M. Compact Parkin only: insights into the structure of an autoinhibited ubiquitin ligase. EMBO J. 32, 2087–2089 (2013). sourceExperimental — accuracy not yet measured
The Abstract says activating Parkin mutations may lead to increased autoubiquitination and degradation. It separately says Parkin promotes proteasomal degradation of mitochondrial proteins and mitophagy. It does not demonstrate that Parkin itself is proteasomally degraded during mitophagy or that this halts its activity. (LLM, conf=0.86)
boosteddirect- Asserted: passes — The authors put it forward as true.
- Checkable: passes — It can be checked against evidence.
- Load-bearing: fails — The paper’s conclusions may not depend on it.
- Based: passes — The paper gives a reason why it holds.
Probably not a substantial claim. The paper’s conclusions may not depend on it.
- Partly supported
The cited sources support only part of this claim — read each source’s verdict below.
In the paper
“During mitochondrial fission, cytosolic Drp1 is recruited to mitochondrial receptors (e.g., Fis1)3,4, allowing mitochondrial partitioning, turnover and reduction of network size under low energetic demand4,7.”
§ Altered mitochondrial dynamics and function in APOE4-expressing astrocytes > Introduction
What the sources say
- Partly supportedcites [3] Eisner, V., Picard, M. & Hajnoczky, G. Mitochondrial dynamics in adaptive and maladaptive cellular stress responses. Nat. Cell Biol. 20, 755–765 (2018). sourceExperimental — accuracy not yet measured
The “Mitochondrial fusion and fission dynamics” section (page unavailable) describes cytoplasmic DRP1 recruitment for division and says fission enables segregation of damaged mitochondria for mitophagy. It names MFF and MID49/51, not Fis1, in the recruitment mechanism. It also does not establish that low energetic demand drives network reduction; its discussion of glucose starvation instead describes inhibited fission and hyperfusion. (LLM, conf=0.88)
- Partly supportedcites [4] Tilokani, L., Nagashima, S., Paupe, V. & Prudent, J. Mitochondrial dynamics: overview of molecular mechanisms. Essays Biochem. 62, 341–360 (2018). sourceExperimental — accuracy not yet measured
The “Drp1 and adaptors” section says that mainly cytosolic Drp1 is recruited to mitochondria for fission, and Figure 4 describes division into two daughter mitochondria. But it identifies MFF and MiD49/51—not Fis1—as the relevant Drp1 receptors in mammals under basal conditions. The Introduction links fragmentation to quality control, but the copy does not establish that fission reduces network size specifically under low energetic demand. (LLM, conf=0.87)
- Partly supportedcites [7] Westermann, B. Bioenergetic role of mitochondrial fusion and fission. Biochim. Biophys. Acta 1817, 1833–1838 (2012). sourceExperimental — accuracy not yet measured
The Introduction says Drp1 assembles on the mitochondrial surface to mediate fission, and section 4 describes partitioning during cell division and the removal of damaged mitochondria after fission. Sections 2 and 6 associate fragmented mitochondria with resting or respiratory-inactive cells. Our copy does not establish recruitment of cytosolic Drp1 by Fis1 or say that fission reduces network size specifically in response to low energetic demand. Page numbers are unavailable in our copy. (LLM, conf=0.87)
plaindirect- Asserted: passes — The authors put it forward as true.
- Checkable: passes — It can be checked against evidence.
- Load-bearing: fails — The paper’s conclusions may not depend on it.
- Based: passes — The paper gives a reason why it holds.
Probably not a substantial claim. The paper’s conclusions may not depend on it.
- Partly supported
Every source the paper cites for this claim was checked and supports it.
In the paper
“Mitochondrial dynamics were shown to be abnormal in AD brains6.”
§ Altered mitochondrial dynamics and function in APOE4-expressing astrocytes > Introduction
What the sources say
- Supportedcites [6] Zhu, X., Perry, G., Smith, M. A. & Wang, X. Abnormal mitochondrial dynamics in the pathogenesis of Alzheimer’s disease. J. Alzheimer’s Dis. 33, S253–262 (2013). source
The section “Abnormal mitochondrial dynamics in Alzheimer's disease” reports altered mitochondrial morphology and changes in fission- and fusion-related proteins in AD brains. The Conclusion describes a shift toward excessive mitochondrial fission in AD. No page numbers are provided in the supplied passages. (LLM, conf=0.93)
plaincorrelational- Asserted: passes — The authors put it forward as true.
- Checkable: passes — It can be checked against evidence.
- Load-bearing: passes — The paper’s conclusions depend on it.
- Based: passes — The paper gives a reason why it holds.
Probably not a substantial claim.
- Supported
The cited sources support only part of this claim — read each source’s verdict below.
In the paper
“Mitochondrial dysfunction plays a fundamental role in AD pathogenesis2 and represents an early event2.”
§ Altered mitochondrial dynamics and function in APOE4-expressing astrocytes > Introduction
What the sources say
- Partly supportedcites [2] Swerdlow, R. H. Mitochondria and mitochondrial cascades in Alzheimer’s disease. J. Alzheimer’s Dis.: JAD 62, 1403–1416 (2018). sourceExperimental — accuracy not yet measured
The Introduction says mitochondrial dysfunction may play an important, relatively upstream role in AD, and the Conclusions say mitochondrial and bioenergetic changes seem to precede detectable changes in Aβ homeostasis. The source supports a significant and potentially early role, but presents both points as possibilities rather than established facts. (LLM, conf=0.85)
plaindirect- Asserted: passes — The authors put it forward as true.
- Checkable: passes — It can be checked against evidence.
- Load-bearing: passes — The paper’s conclusions depend on it.
- Based: passes — The paper gives a reason why it holds.
Probably not a substantial claim.
- Partly supported
The sources with a verdict support this claim; the rest weren’t checked yet, have no full text we could read, or their verdicts aren’t rated yet.
In the paper
“Previously, others and we have found that APOE4 is associated with impaired autophagy in astrocytes13,14, which is linked to reduced clearance of Aβ plaques and protein aggregates13,14.”
§ Altered mitochondrial dynamics and function in APOE4-expressing astrocytes > Introduction
What the sources say
- Not checked — no full text of the sourcecites [13] Simonovitch, S. et al. Impaired autophagy in APOE4 astrocytes. J. Alzheimers Dis. 51, 915–927 (2016). source
- Supportedcites [14] Parcon, P. A., et al. Apolipoprotein E4 inhibits autophagy gene products through direct, specific binding to CLEAR motifs. Alzheimer’s Demen. https://doi.org/10.1016/j.jalz.2017.07.754 (2017). source
The Discussion reports that astrocytes from apoE4-targeted replacement mice have lower autophagy and reduced ability to clear amyloid plaques. It also reports that apoE4-expressing human astroglioma cells failed to increase aggregate clearance in response to starvation stress. These findings support the claimed link, with the aggregate-clearance result specifically observed under starvation stress. (LLM, conf=0.88)
plaincorrelational- Asserted: passes — The authors put it forward as true.
- Checkable: passes — It can be checked against evidence.
- Load-bearing: fails — The paper’s conclusions may not depend on it.
- Based: passes — The paper gives a reason why it holds.
Probably not a substantial claim. The paper’s conclusions may not depend on it.
The cited sources support only part of this claim — read each source’s verdict below.
In the paper
“PINK1, which accumulates on the OMM following MMP reduction, while it undergoes cleavage in healthy mitochondria due to proteasomal degradation5,8.”
§ Altered mitochondrial dynamics and function in APOE4-expressing astrocytes > Results > APOE4 astrocytes exhibit impaired mitochondrial function
What the sources say
- Partly supportedcites [5] Pickles, S., Vigie, P. & Youle, R. J. Mitophagy and quality control mechanisms in mitochondrial maintenance. Curr. Biol. 28, R170–R185 (2018). sourceExperimental — accuracy not yet measured
The Parkin and PINK1-dependent mitophagy section (page unavailable) says PINK1 is stabilized on the outer mitochondrial membrane when mitochondrial import is compromised, and that under basal conditions it is cleaved. It does not say proteasomal degradation causes cleavage: MPP and PARL cleave PINK1, after which the proteasome degrades the cleavage product. (LLM, conf=0.88)
- Partly supportedcites [8] Truban, D., Hou, X., Caulfield, T. R., Fiesel, F. C. & Springer, W. PINK1, parkin, and mitochondrial quality control: what can we learn about Parkinson’s disease pathobiology? J. Parkinson’s Dis. 7, 13–29 (2017). sourceExperimental — accuracy not yet measured
In “The Life Cycle of PINK1 – A Sensor for Mitochondrial Damage,” the paper says mitochondrial depolarization prevents import and full-length PINK1 accumulates on the OMM. It also says PINK1 is cleaved in healthy mitochondria, but cleavage is performed by mitochondrial proteases MPP and PARL; proteasomal degradation occurs afterward, rather than causing the cleavage. (LLM, conf=0.88)
plaindirect- Asserted: passes — The authors put it forward as true.
- Checkable: passes — It can be checked against evidence.
- Load-bearing: passes — The paper’s conclusions depend on it.
- Based: passes — The paper gives a reason why it holds.
It may state two separate claims as one.
- Partly supported
The cited sources support only part of this claim — read each source’s verdict below.
In the paper
“This process is triggered by increased mitochondrial membrane potential (MMP) and involves the oligomerization of mitofusins on the outer mitochondrial membrane (OMM)4.”
§ Altered mitochondrial dynamics and function in APOE4-expressing astrocytes > Introduction
What the sources say
- Partly supportedcites [4] Tilokani, L., Nagashima, S., Paupe, V. & Prudent, J. Mitochondrial dynamics: overview of molecular mechanisms. Essays Biochem. 62, 341–360 (2018). sourceExperimental — accuracy not yet measured
The ‘Mitofusins and outer mitochondrial membrane fusion’ section (page unavailable) describes mitofusin oligomerization as part of outer-membrane fusion. It does not say that an increase in mitochondrial membrane potential triggers fusion; the passage addressing membrane potential instead describes a drop associated with inner-membrane constriction. (LLM, conf=0.86)
plaindirect- Asserted: passes — The authors put it forward as true.
- Checkable: passes — It can be checked against evidence.
- Load-bearing: fails — The paper’s conclusions may not depend on it.
- Based: passes — The paper gives a reason why it holds.
Probably not a substantial claim. The paper’s conclusions may not depend on it. It may state two separate claims as one.
- Partly supported
Every source the paper cites for this claim was checked and supports it.
In the paper
“Also, although astrocytes play a fundamental role in AD pathology12, little is known about APOE4 effect on their mitochondria.”
§ Altered mitochondrial dynamics and function in APOE4-expressing astrocytes > Introduction
What the sources say
- Supportedcites [12] Lampinen, R., Belaya, I., Boccuni, I., Malm, T., Kanninen, K. M. in Astrocyte – Physiology and Pathology (ed. D’Amato MTGaLC), INTECH 139–162 (2018). https://doi.org/10.5772/intechopen.71825. source
Section 6 describes astrocyte dysfunction as an essential, early component of AD and says harmful astrocytes can play a crucial role in its progression. Section 7 also says altered astrocytic functions contribute to the progression of AD pathology. These passages support the cited claim; the separate statement about APOE4 is not attributed to this source. (LLM, conf=0.94)
plaincorrelational- Asserted: passes — The authors put it forward as true.
- Checkable: passes — It can be checked against evidence.
- Load-bearing: passes — The paper’s conclusions depend on it.
- Based: passes — The paper gives a reason why it holds.
Probably not a substantial claim.
- Supported
The cited sources that could be checked couldn’t confirm or dispute this claim.
In the paper
“indicating higher autophagic flux30”
§ Altered mitochondrial dynamics and function in APOE4-expressing astrocytes > Results > APOE4-expressing astrocytes exhibit impaired mitophagy
What the sources say
- Could not verifycites [30] Klionsky, D. J. et al. Guidelines for the use and interpretation of assays for monitoring autophagy (3rd edition). Autophagy 12, 1–222 (2016). sourceExperimental — accuracy not yet measured
The Introduction (p. 28) explains how autophagic flux should be measured, and the Atg8/LC3 section (p. 56) cautions that LC3 levels alone do not establish flux. Searches for APOE3, APOE4, and their comparison in astrocytes found no passage reporting higher flux in APOE3 astrocytes. Our copy is truncated, so the comparison cannot be verified from it. (LLM, conf=0.72)
hedgedcorrelational- Asserted: passes — The authors put it forward as true.
- Checkable: passes — It can be checked against evidence.
- Load-bearing: passes — The paper’s conclusions depend on it.
- Based: passes — The paper gives a reason why it holds.
The quote only partly states this claim.
- Could not verify
The cited sources support only part of this claim — read each source’s verdict below.
In the paper
“Mitochondrial dynamics include fusion, fission, and degradation events, linked to mitochondrial function3,4.”
§ Altered mitochondrial dynamics and function in APOE4-expressing astrocytes > Introduction
What the sources say
- Supportedcites [3] Eisner, V., Picard, M. & Hajnoczky, G. Mitochondrial dynamics in adaptive and maladaptive cellular stress responses. Nat. Cell Biol. 20, 755–765 (2018). source
The “Mitochondrial dynamics” section describes reshaping and recycling events as part of mitochondrial dynamics and links them to mitochondrial quality and responses to challenges. The “Mitochondrial fusion and fission dynamics” section explicitly describes fusion and fission and links fission to removal of damaged mitochondria by mitophagy. The supplied passages do not provide page numbers. (LLM, conf=0.91)
- Partly supportedcites [4] Tilokani, L., Nagashima, S., Paupe, V. & Prudent, J. Mitochondrial dynamics: overview of molecular mechanisms. Essays Biochem. 62, 341–360 (2018). sourceExperimental — accuracy not yet measured
The Abstract defines mitochondrial dynamics as coordinated cycles of fission and fusion, and the Introduction links those transitions to mitochondrial function. The section on post-translational modifications says fission can promote degradation of damaged mitochondria, but the paper does not define degradation itself as a mitochondrial dynamics event. Page numbers were not supplied in our copy. (LLM, conf=0.87)
plaincorrelational- Asserted: passes — The authors put it forward as true.
- Checkable: passes — It can be checked against evidence.
- Load-bearing: fails — The paper’s conclusions may not depend on it.
- Based: passes — The paper gives a reason why it holds.
Probably not a substantial claim. The paper’s conclusions may not depend on it. It may state two separate claims as one.
- Supported
The cited sources support only part of this claim — read each source’s verdict below.
In the paper
“Mitophagy proceeds mitochondrial fission and is triggered by decreased MMP5.”
§ Altered mitochondrial dynamics and function in APOE4-expressing astrocytes > Introduction
What the sources say
- Partly supportedcites [5] Pickles, S., Vigie, P. & Youle, R. J. Mitophagy and quality control mechanisms in mitochondrial maintenance. Curr. Biol. 28, R170–R185 (2018). sourceExperimental — accuracy not yet measured
The 'Mitophagy in Yeast' section links PINK1/Parkin-dependent mitophagy to mitochondrial transmembrane potential, but says depolarization does not appear necessary for several other mitophagy pathways. The 'Quality control at the sub-organelle level' section describes fission and autophagosome formation as coupled, and cites a yeast-specific proposal that fission acts upstream of mitophagy. It does not support an unqualified sequence between fission and mitophagy or decreased MMP as a universal trigger. Page numbers are unavailable in our copy. (LLM, conf=0.86)
plaindirect- Asserted: passes — The authors put it forward as true.
- Checkable: passes — It can be checked against evidence.
- Load-bearing: fails — The paper’s conclusions may not depend on it.
- Based: passes — The paper gives a reason why it holds.
Probably not a substantial claim. The paper’s conclusions may not depend on it. It may state two separate claims as one.
- Partly supported
The cited sources support only part of this claim — read each source’s verdict below.
In the paper
“Parkin labels mitochondria for mitophagy by ubiquitinating specific mitochondrial proteins; parkin is then degraded by the proteasome/lysosome due to autoubiquitination26–29.”
§ Altered mitochondrial dynamics and function in APOE4-expressing astrocytes > Discussion
What the sources say
- Partly supportedcites [26] Vives-Bauza, C. et al. PINK1-dependent recruitment of Parkin to mitochondria in mitophagy. Proc. Natl Acad. Sci. USA 107, 378–383 (2010). sourceExperimental — accuracy not yet measured
The Abstract reports that Parkin relocates to mitochondria and, with PINK1, helps deliver damaged mitochondria for autophagic degradation. It does not show that Parkin labels mitochondria by ubiquitinating specific mitochondrial proteins or that Parkin itself is degraded by the proteasome or lysosome following autoubiquitination; the degradation described is of mitochondria. (LLM, conf=0.88)
- Partly supportedcites [27] Narendra, D., Tanaka, A., Suen, D. F. & Youle, R. J. Parkin is recruited selectively to impaired mitochondria and promotes their autophagy. J. Cell Biol. 183, 795–803 (2008). sourceExperimental — accuracy not yet measured
The Results and discussion (page not provided) show that Parkin is recruited to impaired mitochondria and promotes their autophagic degradation; the Introduction identifies Parkin as a ubiquitin ligase. Our copy does not establish that Parkin labels mitochondria by ubiquitinating specific mitochondrial proteins, or that Parkin itself is degraded by the proteasome or lysosome because of autoubiquitination. (LLM, conf=0.88)
- Partly supportedcites [28] Seirafi, M., Kozlov, G. & Gehring, K. Parkin structure and function. FEBS J. 282, 2076–2088 (2015). sourceExperimental — accuracy not yet measured
The Introduction and “Parkin is an RBR E3 ubiquitin ligase” section say that parkin ubiquitinates outer mitochondrial membrane proteins, marking damaged mitochondria for mitophagy. The latter section says K6 ubiquitination of parkin may play a role in its own degradation; it does not establish that parkin is subsequently degraded by the proteasome or lysosome because of autoubiquitination. (LLM, conf=0.90)
- Partly supportedcites [29] Rakovic, A. et al. Phosphatase and tensin homolog (PTEN)-induced putative kinase 1 (PINK1)-dependent ubiquitination of endogenous Parkin attenuates mitophagy: study in human primary fibroblasts and induced pluripotent stem cell-derived neurons. J. Biol. Chem. 288, 2223–2237 (2013). sourceExperimental — accuracy not yet measured
The Discussion reports Parkin-mediated ubiquitination of multiple outer mitochondrial membrane proteins and says endogenous Parkin is self-ubiquitinated and likely degraded through the ubiquitin–proteasome system. It does not support lysosomal degradation of Parkin, and describes proteasomal degradation as likely rather than established. Page numbers are not available in our copy. (LLM, conf=0.88)
plaindirect- Asserted: passes — The authors put it forward as true.
- Checkable: passes — It can be checked against evidence.
- Load-bearing: passes — The paper’s conclusions depend on it.
- Based: passes — The paper gives a reason why it holds.
Probably not a substantial claim. It may state two separate claims as one.
- Partly supported
Every source the paper cites for this claim was checked and supports it.
In the paper
“the mechanism is vague12.”
§ Altered mitochondrial dynamics and function in APOE4-expressing astrocytes > Discussion
What the sources say
- Supportedcites [12] Lampinen, R., Belaya, I., Boccuni, I., Malm, T., Kanninen, K. M. in Astrocyte – Physiology and Pathology (ed. D’Amato MTGaLC), INTECH 139–162 (2018). https://doi.org/10.5772/intechopen.71825. source
Section 9, “Future aspects” (page not provided), says that questions remain about the mechanisms of mitochondrial function, transport, turnover and degradation in astrocytes. It also notes that very little literature addresses AD-associated mitochondrial dysfunction specifically in astrocytes, supporting the claim that its mechanism is not yet clear. (LLM, conf=0.92)
plain- Asserted: passes — The authors put it forward as true.
- Checkable: fails — It may be too vague to check against evidence.
- Load-bearing: passes — The paper’s conclusions depend on it.
- Based: passes — The paper gives a reason why it holds.
Probably not a substantial claim. It may be too vague to check against evidence.
- Supported
Every source the paper cites for this claim was checked and supports it.
In the paper
“Mitochondrial fusion is mediated by mitofusins, which are regulated by transcription and protein modification, including ubiquitination3.”
§ Altered mitochondrial dynamics and function in APOE4-expressing astrocytes > Discussion
What the sources say
- Supportedcites [3] Eisner, V., Picard, M. & Hajnoczky, G. Mitochondrial dynamics in adaptive and maladaptive cellular stress responses. Nat. Cell Biol. 20, 755–765 (2018). source
The “Mitochondrial fusion and fission dynamics” section says MFN1 and MFN2 mediate outer mitochondrial membrane fusion. The same section says fusion–fission balance is regulated transcriptionally and post-transcriptionally, identifies transcriptional regulation of MFN2 expression, and lists ubiquitination among modifications affecting MFN1/2 levels and activity. (LLM, conf=0.94)
plaindirect- Asserted: passes — The authors put it forward as true.
- Checkable: passes — It can be checked against evidence.
- Load-bearing: fails — The paper’s conclusions may not depend on it.
- Based: passes — The paper gives a reason why it holds.
Probably not a substantial claim. The paper’s conclusions may not depend on it. It may state two separate claims as one.
- Supported
The cited sources support only part of this claim — read each source’s verdict below.
In the paper
“Therefore, less quality control and mitochondrial turnover is possible, leading to increased population of dysfunctional mitochondria50.”
§ Altered mitochondrial dynamics and function in APOE4-expressing astrocytes > Discussion
What the sources say
- Partly supportedcites [50] Andres, A. M., Stotland, A., Queliconi, B. B. & Gottlieb, R. A. A time to reap, a time to sow: mitophagy and biogenesis in cardiac pathophysiology. J. Mol. Cell. Cardiol. 78, 62–72 (2015). sourceExperimental — accuracy not yet measured
The Introduction (page unavailable) states that mitochondrial turnover eliminates dysfunctional mitochondria and that impaired quality control leads to their accumulation. The paper does not establish that quality control or turnover is reduced in APOE4 astrocytes; it provides the general mechanism, not that cell-specific finding. (LLM, conf=0.85)
hedgedconditional- Asserted: passes — The authors put it forward as true.
- Checkable: passes — It can be checked against evidence.
- Load-bearing: passes — The paper’s conclusions depend on it.
- Based: passes — The paper gives a reason why it holds.
It may state two separate claims as one.
- Partly supported
The cited sources support only part of this claim — read each source’s verdict below.
In the paper
“the ubiquitination/proteasomal degradation of Mfn1 and Tom408,35, as well as of total mitochondrial ubiquitin, are reduced in the APOE4 astrocytes”
§ Altered mitochondrial dynamics and function in APOE4-expressing astrocytes > Discussion
What the sources say
- Partly supportedcites [8] Truban, D., Hou, X., Caulfield, T. R., Fiesel, F. C. & Springer, W. PINK1, parkin, and mitochondrial quality control: what can we learn about Parkinson’s disease pathobiology? J. Parkinson’s Dis. 7, 13–29 (2017). sourceExperimental — accuracy not yet measured
The PINK1/Parkin-Directed Mitochondrial Quality Control section says Mitofusin-1 is targeted for elimination via the 26 S proteasome. The passages found do not establish proteasomal degradation of Tom40 or reduced ubiquitination and degradation in APOE4 astrocytes. No page number was available in our copy. (LLM, conf=0.84)
- Partly supportedcites [35] Yoshii, S. R., Kishi, C., Ishihara, N. & Mizushima, N. Parkin mediates proteasome-dependent protein degradation and rupture of the outer mitochondrial membrane. J. Biol. Chem. 286, 19630–19640 (2011). sourceExperimental — accuracy not yet measured
The OMM Protein Degradation Is Inhibited by Proteasome Inhibitors section reports proteasome-dependent Tom40 degradation, and the Discussion reports proteasome-dependent mitofusin 1 degradation. But the Discussion says it is unknown whether these proteins are directly ubiquitinated by Parkin. The APOE4-astrocyte reduction is the citing authors’ own finding, not a result attributed to this source by the citation placement. (LLM, conf=0.85)
plaindirect- Asserted: passes — The authors put it forward as true.
- Checkable: passes — It can be checked against evidence.
- Load-bearing: passes — The paper’s conclusions depend on it.
- Based: passes — The paper gives a reason why it holds.
It may state two separate claims as one.
- Partly supported
The cited sources support only part of this claim — read each source’s verdict below.
In the paper
“abnormal parkin ubiquitination was shown to prevent its proteasomal degradation and impede parkin-mediated mitophagy44.”
§ Altered mitochondrial dynamics and function in APOE4-expressing astrocytes > Discussion
What the sources say
- Partly supportedcites [44] Durcan, T. M. et al. USP8 regulates mitophagy by removing K6-linked ubiquitin conjugates from parkin. EMBO J. 33, 2473–2491 (2014). sourceExperimental — accuracy not yet measured
The paper reports that increased K6-linked ubiquitin conjugates on parkin delay parkin-mediated mitophagy (figure legend, “Viral-mediated infection and lysis of cortical neurons”; page unavailable). It also reports that reduced USP8 activity appears to protect parkin from degradation, but says K6-linked ubiquitination is *likely* to protect it from degradation in the proteasome **or lysosome** (“USP8 selectively removes K6-linked ubiquitin conjugates from parkin” and discussion; pages unavailable). The claim overstates this as demonstrated prevention of proteasomal degradation specifically. (LLM, conf=0.88)
plaindirect- Asserted: passes — The authors put it forward as true.
- Checkable: passes — It can be checked against evidence.
- Load-bearing: passes — The paper’s conclusions depend on it.
- Based: passes — The paper gives a reason why it holds.
It may state two separate claims as one.
- Partly supported
The cited sources support only part of this claim — read each source’s verdict below.
In the paper
“other studies have demonstrated impaired mitophagy and parkin accumulation in AD neurons45,46.”
§ Altered mitochondrial dynamics and function in APOE4-expressing astrocytes > Discussion
What the sources say
- Not checked — no full text of the sourcecites [45] Kerr, J. S. et al. Mitophagy and Alzheimer’s disease: cellular and molecular mechanisms. Trends Neurosci. 40, 151–166 (2017). source
- Partly supportedcites [46] Ye, X., Sun, X., Starovoytov, V. & Cai, Q. Parkin-mediated mitophagy in mutant hAPP neurons and Alzheimer’s disease patient brains. Hum. Mol. Genet. 24, 2938–2951 (2015). sourceExperimental — accuracy not yet measured
The Discussion reports inadequate capacity to clear damaged mitochondria despite enhanced induction of mitophagy, so the unqualified phrase “impaired mitophagy” misses that distinction. The section on increased Parkin translocation reports greater recruitment of Parkin to depolarized mitochondria in AD neurons, not overall Parkin accumulation; the patient-brain results instead report declining Parkin levels. Page numbers are unavailable in our copy. (LLM, conf=0.87)
boostedcorrelational- Asserted: passes — The authors put it forward as true.
- Checkable: passes — It can be checked against evidence.
- Load-bearing: fails — The paper’s conclusions may not depend on it.
- Based: passes — The paper gives a reason why it holds.
Probably not a substantial claim. The paper’s conclusions may not depend on it.
The cited sources support only part of this claim — read each source’s verdict below.
In the paper
“suggesting that their mitochondrial network is in a static hyperfused state49; i.e., less fission/degradation occurs together with reduced mitochondrial biogenesis.”
§ Altered mitochondrial dynamics and function in APOE4-expressing astrocytes > Discussion
What the sources say
- Partly supportedcites [49] Hoitzing, H., Johnston, I. G. & Jones, N. S. What is the function of mitochondrial networks? A theoretical assessment of hypotheses and proposal for future research. BioEssays: N. Rev. Mol., Cell. Dev. Biol. 37, 687–700 (2015). sourceExperimental — accuracy not yet measured
In “Quantitative definitions of micro, meso- and hyperfusion” (page unavailable), the paper defines static hyperfusion as a highly fused state with rare or almost no fission events. It does not establish that APOE4 astrocytes are in that state or that they have reduced mitochondrial degradation and biogenesis. (LLM, conf=0.87)
hedgeddirect- Asserted: passes — The authors put it forward as true.
- Checkable: passes — It can be checked against evidence.
- Load-bearing: passes — The paper’s conclusions depend on it.
- Based: passes — The paper gives a reason why it holds.
It may state two separate claims as one.
- Partly supported
The sources with a verdict support this claim; the rest weren’t checked yet, have no full text we could read, or their verdicts aren’t rated yet.
In the paper
“rapamycin, which promotes autophagosome formation30, and was shown to induce mitophagy by upregulating the parkin/PINK1 pathway25,40–42.”
§ Altered mitochondrial dynamics and function in APOE4-expressing astrocytes > Results > Rapamycin induces mitophagy and restores mitochondrial function in APOE4-expressing astrocytes
What the sources say
- Supportedcites [30] Klionsky, D. J. et al. Guidelines for the use and interpretation of assays for monitoring autophagy (3rd edition). Autophagy 12, 1–222 (2016). source
The glossary entry for rapamycin (p. 473) calls it a TOR inhibitor that induces autophagy, supporting the autophagosome-formation clause to which citation 30 is attached. The separate claim about mitophagy through PINK1/Parkin is attached to other citations, not this one. (LLM, conf=0.86)
- Could not verifycites [25] Ebrahimi-Fakhari, D. et al. Impaired mitochondrial dynamics and mitophagy in neuronal models of tuberous sclerosis complex. Cell Rep. 17, 2162 (2016). sourceExperimental — accuracy not yet measured
The available indexed passages are from a correction notice (p. 2162), chiefly its Acknowledgments, rather than the study’s findings. Searches for rapamycin, mitophagy, and the Parkin/PINK1 pathway found no passage addressing whether rapamycin induces mitophagy through that pathway; the decisive study text appears to be missing from our copy. (LLM, conf=0.72)
- Not checked — no full text of the sourcecites [40] Bartolome, A. et al. MTORC1 regulates both general autophagy and mitophagy induction after oxidative phosphorylation uncoupling. Mol. Cellular Biol. 37, e00441 (2017). source
- Not checked — no full text of the sourcecites [41] Li, Q. et al. Rapamycin attenuates mitochondrial dysfunction via activation of mitophagy in experimental ischemic stroke. Biochem. Biophys. Res. Commun. 444, 182–188 (2014). source
- Not checked — no full text of the sourcecites [42] Wang, C. et al. The post-therapeutic effect of rapamycin in mild traumatic brain-injured rats ensuing in the upregulation of autophagy and mitophagy. Cell Biol. Int. 41, 1039–1047 (2017). source
plaindirect- Asserted: passes — The authors put it forward as true.
- Checkable: passes — It can be checked against evidence.
- Load-bearing: passes — The paper’s conclusions depend on it.
- Based: passes — The paper gives a reason why it holds.
It may state two separate claims as one.
- Supported
The sources with a verdict support this claim; the rest weren’t checked yet, have no full text we could read, or their verdicts aren’t rated yet.
In the paper
“During mitophagy, parkin ubiqitinates Mfn1, leading to its proteasomal degradation and fusion inhibition8,43.”
§ Altered mitochondrial dynamics and function in APOE4-expressing astrocytes > Discussion
What the sources say
- Supportedcites [8] Truban, D., Hou, X., Caulfield, T. R., Fiesel, F. C. & Springer, W. PINK1, parkin, and mitochondrial quality control: what can we learn about Parkinson’s disease pathobiology? J. Parkinson’s Dis. 7, 13–29 (2017). source
The PINK1/Parkin-directed mitochondrial quality control section identifies Mitofusin-1 as a protein targeted by the pathway to prevent damaged mitochondria from fusing with healthy ones. It states that mitofusins are eliminated via the 26S proteasome, supporting the claimed sequence of events during mitophagy. (LLM, conf=0.90)
- Not checked — no full text of the sourcecites [43] Glauser, L., Sonnay, S., Stafa, K. & Moore, D. J. Parkin promotes the ubiquitination and degradation of the mitochondrial fusion factor mitofusin 1. J. Neurochem. 118, 636–645 (2011). source
plaindirect- Asserted: passes — The authors put it forward as true.
- Checkable: passes — It can be checked against evidence.
- Load-bearing: passes — The paper’s conclusions depend on it.
- Based: passes — The paper gives a reason why it holds.
Probably not a substantial claim.
- Supported
Every source the paper cites for this claim was checked and supports it.
In the paper
“Changes in mitochondrial dynamics and mitochondrial dysfunction are recognized as hallmarks of AD”
§ Altered mitochondrial dynamics and function in APOE4-expressing astrocytes > Discussion
What the sources say
- Supportedcites [12] Lampinen, R., Belaya, I., Boccuni, I., Malm, T., Kanninen, K. M. in Astrocyte – Physiology and Pathology (ed. D’Amato MTGaLC), INTECH 139–162 (2018). https://doi.org/10.5772/intechopen.71825. source
Section 7 describes defective mitochondrial dynamics and associated structural changes in AD, including increased mitochondrial fragmentation. It also calls mitochondrial dysfunction a key pathological feature of AD. Together, these passages support the claim’s broad characterization; page numbers are not available in our copy. (LLM, conf=0.88)
boostedcorrelational- Asserted: passes — The authors put it forward as true.
- Checkable: passes — It can be checked against evidence.
- Load-bearing: passes — The paper’s conclusions depend on it.
- Based: passes — The paper gives a reason why it holds.
Probably not a substantial claim. It may state two separate claims as one.
- Supported
Every source the paper cites for this claim was checked and supports it.
In the paper
“as well as with changes in mitochondrial dynamics proteins expression in transgenic mice brains15.”
§ Altered mitochondrial dynamics and function in APOE4-expressing astrocytes > Discussion
What the sources say
- Supportedcites [15] Simonovitch, S., Schmukler, E., Masliah, E., Pinkas-Kramarski, R. & Michaelson, D. M. The effects of APOE4 on mitochondrial dynamics and proteins in vivo. J. Alzheimers Dis. 70, 861–875 (2019). source
The Discussion reports altered expression of mitochondrial dynamics proteins in ApoE4 mouse brains. The Introduction identifies the animals as targeted replacement mice expressing human APOE4 or APOE3, supporting the claim’s reference to transgenic mice. (LLM, conf=0.93)
plaincorrelational- Asserted: passes — The authors put it forward as true.
- Checkable: passes — It can be checked against evidence.
- Load-bearing: passes — The paper’s conclusions depend on it.
- Based: passes — The paper gives a reason why it holds.
Probably not a substantial claim.
- Supported
A result the paper reports from its own data — it cites no other source for it, so there is none to check. The quote shows it is in the paper.
In the paper
“Importantly, the autophagy inducer rapamycin enhanced mitophagy and improved mitochondrial functioning in APOE4 astrocytes.”
- Also stated in: § Introduction · plain
“Notably, induction of mitophagy by rapamycin restored mitochondrial function.”
§ Altered mitochondrial dynamics and function in APOE4-expressing astrocytes > Abstract
plaindirect- Asserted: passes — The authors put it forward as true.
- Checkable: passes — It can be checked against evidence.
- Load-bearing: passes — The paper’s conclusions depend on it.
- Based: passes — The paper gives a reason why it holds.
It may state two separate claims as one.
- Also stated in: § Introduction · plain
A result the paper reports from its own data — it cites no other source for it, so there is none to check. The quote shows it is in the paper.
In the paper
“elevated mitochondrial LC3-II, which was more prominent in the APOE3 astrocytes”
§ Altered mitochondrial dynamics and function in APOE4-expressing astrocytes > Results > APOE4-expressing astrocytes exhibit impaired mitophagy
plaindirect- Asserted: passes — The authors put it forward as true.
- Checkable: passes — It can be checked against evidence.
- Load-bearing: passes — The paper’s conclusions depend on it.
- Based: passes — The paper gives a reason why it holds.
It may state two separate claims as one.
- Rests on an assumption: The human APOE3 and APOE4 targeted-replacement astrocyte cell lines differ only in APOE genotype.
A result the paper reports from its own data — it cites no other source for it, so there is none to check. The quote shows it is in the paper.
In the paper
“treatment with CCCP resulted in decreased number of branches per network, which was more profound in the APOE3 astrocytes”
§ Altered mitochondrial dynamics and function in APOE4-expressing astrocytes > Results > APOE4-expressing astrocytes exhibit impaired mitophagy
plaindirect- Asserted: passes — The authors put it forward as true.
- Checkable: passes — It can be checked against evidence.
- Load-bearing: unclear — It is unclear whether the paper’s conclusions depend on it.
- Based: passes — The paper gives a reason why it holds.
It may state two separate claims as one.
- Rests on an assumption: The human APOE3 and APOE4 targeted-replacement astrocyte cell lines differ only in APOE genotype.
A result the paper reports from its own data — it cites no other source for it, so there is none to check. The quote shows it is in the paper.
In the paper
“CCCP treatment induced a dose-dependent decrease of parkin and Mfn1 levels (indicating their degradation) and increased LC3-II/LC3-I ratio (autophagosomes formation), consistent with mitophagy induction”
§ Altered mitochondrial dynamics and function in APOE4-expressing astrocytes > Results > APOE4-expressing astrocytes exhibit impaired mitophagy
plaindirect- Asserted: passes — The authors put it forward as true.
- Checkable: passes — It can be checked against evidence.
- Load-bearing: passes — The paper’s conclusions depend on it.
- Based: passes — The paper gives a reason why it holds.
It may state two separate claims as one.
A result the paper reports from its own data — it cites no other source for it, so there is none to check. The quote shows it is in the paper.
In the paper
“in the APOE3 astrocytes, CCCP increased the number of autophagosomes containing mitochondria and the formation of spheroid mitochondria”
§ Altered mitochondrial dynamics and function in APOE4-expressing astrocytes > Results > APOE4-expressing astrocytes exhibit impaired mitophagy
plaindirect- Asserted: passes — The authors put it forward as true.
- Checkable: passes — It can be checked against evidence.
- Load-bearing: passes — The paper’s conclusions depend on it.
- Based: passes — The paper gives a reason why it holds.
It may state two separate claims as one.
- Rests on an assumption: The human APOE3 and APOE4 targeted-replacement astrocyte cell lines differ only in APOE genotype.
A result the paper reports from its own data — it cites no other source for it, so there is none to check. The quote shows it is in the paper.
In the paper
“which was higher in APOE3 astrocytes”
§ Altered mitochondrial dynamics and function in APOE4-expressing astrocytes > Results > APOE4-expressing astrocytes exhibit impaired mitophagy
plaincorrelational- Asserted: passes — The authors put it forward as true.
- Checkable: passes — It can be checked against evidence.
- Load-bearing: passes — The paper’s conclusions depend on it.
- Based: passes — The paper gives a reason why it holds.
It may state two separate claims as one.
- Rests on an assumption: The human APOE3 and APOE4 targeted-replacement astrocyte cell lines differ only in APOE genotype.
A result the paper reports from its own data — it cites no other source for it, so there is none to check. The quote shows it is in the paper.
In the paper
“although the levels of LC3-II, p62 and ubiquitin in the mitochondrial fraction of CQ-treated APOE3 cells were higher compared with APOE4 cells, the levels of parkin did not differ”
§ Altered mitochondrial dynamics and function in APOE4-expressing astrocytes > Results > Altered mitochondrial dynamics proteins expression and morphology in APOE4 astrocytes
plain- Asserted: passes — The authors put it forward as true.
- Checkable: passes — It can be checked against evidence.
- Load-bearing: passes — The paper’s conclusions depend on it.
- Based: passes — The paper gives a reason why it holds.
It may state two separate claims as one.
- Rests on an assumption: The human APOE3 and APOE4 targeted-replacement astrocyte cell lines differ only in APOE genotype.
A result the paper reports from its own data — it cites no other source for it, so there is none to check. The quote shows it is in the paper.
In the paper
“Rapamycin treatment increased LC3-II/LC3-I ratio and decreased p62 levels, in both the APOE3/APOE4 astrocytes (Fig. 6a)”
§ Altered mitochondrial dynamics and function in APOE4-expressing astrocytes > Results > Rapamycin induces mitophagy and restores mitochondrial function in APOE4-expressing astrocytes
plaindirect- Asserted: passes — The authors put it forward as true.
- Checkable: passes — It can be checked against evidence.
- Load-bearing: passes — The paper’s conclusions depend on it.
- Based: passes — The paper gives a reason why it holds.
It may state two separate claims as one.
A result the paper reports from its own data — it cites no other source for it, so there is none to check. The quote shows it is in the paper.
In the paper
“in the APOE4 astrocytes, rapamycin restored mitochondrial metabolism (MTT), augmented MMP (MitoTracker Red), and corrected the altered medium pH without affecting cell number (Fig. 6c–e).”
§ Altered mitochondrial dynamics and function in APOE4-expressing astrocytes > Results > Rapamycin induces mitophagy and restores mitochondrial function in APOE4-expressing astrocytes
plaindirect- Asserted: passes — The authors put it forward as true.
- Checkable: passes — It can be checked against evidence.
- Load-bearing: passes — The paper’s conclusions depend on it.
- Based: passes — The paper gives a reason why it holds.
It may state two separate claims as one.
A result the paper reports from its own data — it cites no other source for it, so there is none to check. The quote shows it is in the paper.
In the paper
“Drp1 protein and mRNA levels and its mitochondrial recruitment, are decreased in APOE4 astrocytes”
§ Altered mitochondrial dynamics and function in APOE4-expressing astrocytes > Discussion
plaincorrelational- Asserted: passes — The authors put it forward as true.
- Checkable: passes — It can be checked against evidence.
- Load-bearing: passes — The paper’s conclusions depend on it.
- Based: passes — The paper gives a reason why it holds.
It may state two separate claims as one.
The paper states this without a source or data behind it here, so there is nothing to check it against. The quote shows it is in the paper.
In the paper
“the interaction of the autophagic proteins LC3-II and p62 with the mitochondria, and the lysosomal degradation of mitochondrial LC3-II and p62 are reduced in APOE4 astrocytes.”
§ Altered mitochondrial dynamics and function in APOE4-expressing astrocytes > Discussion
plaindirect- Asserted: passes — The authors put it forward as true.
- Checkable: passes — It can be checked against evidence.
- Load-bearing: passes — The paper’s conclusions depend on it.
- Based: passes — The paper gives a reason why it holds.
It may state two separate claims as one.
In the paper
“Nonetheless, the mechanisms mediating APOE4 pathological effects remain unknown1.”
§ Altered mitochondrial dynamics and function in APOE4-expressing astrocytes > Introduction
What the sources say
- Not checked — no full text of the sourcecites [1] Michaelson, D. M. APOE epsilon4: the most prevalent yet understudied risk factor for Alzheimer’s disease. Alzheimer’s Dement. 10, 861–868 (2014). source
plain- Asserted: passes — The authors put it forward as true.
- Checkable: passes — It can be checked against evidence.
- Load-bearing: passes — The paper’s conclusions depend on it.
- Based: passes — The paper gives a reason why it holds.
Probably not a substantial claim.
A conclusion the paper draws from its own results — it cites no other source for it, so there is none to check. The quote shows it is in the paper.
In the paper
“Therefore, the results indicate that parkin undergoes ubiquitination in APOE4 astrocytes, yet it is not degraded by the proteasome.”
§ Altered mitochondrial dynamics and function in APOE4-expressing astrocytes > Results > APOE4-expressing astrocytes exhibit altered synthesis, ubiquitination and proteasomal/lysosomal degradation of mitochondrial dynamics proteins
hedged- Asserted: passes — The authors put it forward as true.
- Checkable: passes — It can be checked against evidence.
- Load-bearing: passes — The paper’s conclusions depend on it.
- Based: passes — The paper gives a reason why it holds.
It may state two separate claims as one.
What the paper did — it cites no source for this, so there is none to check. The quote shows it is in the paper.
In the paper
“Bands were visualized by Amersham Imager 600 within the linear range, employing the Automatic/Semi-autmatic exposure options, which allows optimal exposure times below saturation to enable accurate quantification (according to manufacturer instructions).”
§ Altered mitochondrial dynamics and function in APOE4-expressing astrocytes > Materials and methods > Lysate preparation, immunoblot and immunoprecipitation
plain- Asserted: passes — The authors put it forward as true.
- Checkable: passes — It can be checked against evidence.
- Load-bearing: fails — The paper’s conclusions may not depend on it.
- Based: passes — The paper gives a reason why it holds.
Probably not a substantial claim. The paper’s conclusions may not depend on it.
A conclusion the paper draws from its own results — it cites no other source for it, so there is none to check. The quote shows it is in the paper.
In the paper
“indicating either increased recruitment of parkin and ubiquitination of mitochondria, or accumulation due to reduced mitochondrial degradation”
§ Altered mitochondrial dynamics and function in APOE4-expressing astrocytes > Results > Altered mitochondrial dynamics proteins expression and morphology in APOE4 astrocytes
hedgedconditional- Asserted: passes — The authors put it forward as true.
- Checkable: passes — It can be checked against evidence.
- Load-bearing: passes — The paper’s conclusions depend on it.
- Based: passes — The paper gives a reason why it holds.
It may state two separate claims as one.
A conclusion the paper draws from its own results — it cites no other source for it, so there is none to check. The quote shows it is in the paper.
In the paper
“Collectively, the results demonstrate that APOE4 expression is associated with altered mitochondrial dynamics, which might lead to impaired mitochondrial function in astrocytes.”
- Also stated in: § Introduction · hedged
“Taken together, the results suggest that impaired mitochondrial dynamics in APOE4 astrocytes is involved in mitochondrial dysfunction”
§ Altered mitochondrial dynamics and function in APOE4-expressing astrocytes > Abstract
hedgedconditional- Asserted: passes — The authors put it forward as true.
- Checkable: passes — It can be checked against evidence.
- Load-bearing: passes — The paper’s conclusions depend on it.
- Based: passes — The paper gives a reason why it holds.
It may state two separate claims as one.
- Also stated in: § Introduction · hedged
A conclusion the paper draws from its own results — it cites no other source for it, so there is none to check. The quote shows it is in the paper.
In the paper
“Taken together, the results further demonstrate dysfunctional fission and mitophagy in the APOE4 astrocytes following mitochondrial damage.”
§ Altered mitochondrial dynamics and function in APOE4-expressing astrocytes > Results > APOE4-expressing astrocytes exhibit impaired mitophagy
boosteddirect- Asserted: passes — The authors put it forward as true.
- Checkable: passes — It can be checked against evidence.
- Load-bearing: passes — The paper’s conclusions depend on it.
- Based: passes — The paper gives a reason why it holds.
It may state two separate claims as one.
A conclusion the paper draws from its own results — it cites no other source for it, so there is none to check. The quote shows it is in the paper.
In the paper
“indicating less mitochondrial fission and association of LC3 with mitochondria in APOE4 astrocytes”
§ Altered mitochondrial dynamics and function in APOE4-expressing astrocytes > Results > Altered mitochondrial dynamics proteins expression and morphology in APOE4 astrocytes
hedged- Asserted: passes — The authors put it forward as true.
- Checkable: passes — It can be checked against evidence.
- Load-bearing: passes — The paper’s conclusions depend on it.
- Based: passes — The paper gives a reason why it holds.
It may state two separate claims as one.
A conclusion the paper draws from its own results — it cites no other source for it, so there is none to check. The quote shows it is in the paper.
In the paper
“indicating its reduced mitophagic and proteasomal degradation, respectively, in the APOE4 astrocytes.”
§ Altered mitochondrial dynamics and function in APOE4-expressing astrocytes > Results > APOE4-expressing astrocytes exhibit altered synthesis, ubiquitination and proteasomal/lysosomal degradation of mitochondrial dynamics proteins
hedgeddirect- Asserted: passes — The authors put it forward as true.
- Checkable: passes — It can be checked against evidence.
- Load-bearing: passes — The paper’s conclusions depend on it.
- Based: passes — The paper gives a reason why it holds.
It may state two separate claims as one.
What the paper did — it cites no source for this, so there is none to check. The quote shows it is in the paper.
In the paper
“The study was conducted according to the NIH Guidelines for Use and Care of Laboratory Animals, following the approval by Animal Care Committee of TAU (#L-04-16-002).”
§ Altered mitochondrial dynamics and function in APOE4-expressing astrocytes > Materials and methods > Cell lines and primary astrocytes
plain- Asserted: passes — The authors put it forward as true.
- Checkable: passes — It can be checked against evidence.
- Load-bearing: fails — The paper’s conclusions may not depend on it.
- Based: passes — The paper gives a reason why it holds.
Probably not a substantial claim. The paper’s conclusions may not depend on it. It may state two separate claims as one.
A conclusion the paper draws from its own results — it cites no other source for it, so there is none to check. The quote shows it is in the paper.
In the paper
“We found that APOE3 and APOE4 astrocytes differ in their mitochondrial dynamics, suggesting that the mitochondria of APOE4 astrocytes exhibit reduced fission and mitophagy.”
§ Altered mitochondrial dynamics and function in APOE4-expressing astrocytes > Abstract
hedgeddirect- Asserted: passes — The authors put it forward as true.
- Checkable: passes — It can be checked against evidence.
- Load-bearing: passes — The paper’s conclusions depend on it.
- Based: passes — The paper gives a reason why it holds.
It may state two separate claims as one.
- Rests on an assumption: The human APOE3 and APOE4 targeted-replacement astrocyte cell lines differ only in APOE genotype.
What the paper did — it cites no source for this, so there is none to check. The quote shows it is in the paper.
In the paper
“All experiments were performed at least 3 times.”
§ Altered mitochondrial dynamics and function in APOE4-expressing astrocytes > Materials and methods > Statistical analysis
plain- Asserted: passes — The authors put it forward as true.
- Checkable: passes — It can be checked against evidence.
- Load-bearing: fails — The paper’s conclusions may not depend on it.
- Based: passes — The paper gives a reason why it holds.
Probably not a substantial claim. The paper’s conclusions may not depend on it.
A conclusion the paper draws from its own results — it cites no other source for it, so there is none to check. The quote shows it is in the paper.
In the paper
“This suggests that following treatment, less fission and association of LC3-II with damaged mitochondria occurs in APOE4 astrocytes.”
§ Altered mitochondrial dynamics and function in APOE4-expressing astrocytes > Results > APOE4-expressing astrocytes exhibit impaired mitophagy
hedgeddirect- Asserted: passes — The authors put it forward as true.
- Checkable: passes — It can be checked against evidence.
- Load-bearing: passes — The paper’s conclusions depend on it.
- Based: passes — The paper gives a reason why it holds.
It may state two separate claims as one.
A conclusion the paper draws from its own results — it cites no other source for it, so there is none to check. The quote shows it is in the paper.
In the paper
“indicating enhanced autophagosome formation and cargo degradation.”
§ Altered mitochondrial dynamics and function in APOE4-expressing astrocytes > Results > Rapamycin induces mitophagy and restores mitochondrial function in APOE4-expressing astrocytes
hedgeddirect- Asserted: passes — The authors put it forward as true.
- Checkable: passes — It can be checked against evidence.
- Load-bearing: passes — The paper’s conclusions depend on it.
- Based: passes — The paper gives a reason why it holds.
It may state two separate claims as one.
In the paper
“which is consistent with other lysosomal dysfunctions associated with APOE447.”
§ Altered mitochondrial dynamics and function in APOE4-expressing astrocytes > Discussion
What the sources say
- Not checked — no full text of the sourcecites [47] Schmukler, E., Michaelson, D. M. & Pinkas-Kramarski, R. The interplay between apolipoprotein E4 and the autophagic-endocytic-lysosomal axis. Mol. Neurobiol. 55, 6863–6880 (2018). source
plaincorrelational- Asserted: passes — The authors put it forward as true.
- Checkable: passes — It can be checked against evidence.
- Load-bearing: unclear — It is unclear whether the paper’s conclusions depend on it.
- Based: passes — The paper gives a reason why it holds.
It may state two separate claims as one.
In the paper
“Among the risk factors for AD is the APOE4 allele1”
§ Altered mitochondrial dynamics and function in APOE4-expressing astrocytes > Discussion
What the sources say
- Not checked — no full text of the sourcecites [1] Michaelson, D. M. APOE epsilon4: the most prevalent yet understudied risk factor for Alzheimer’s disease. Alzheimer’s Dement. 10, 861–868 (2014). source
plaincorrelational- Asserted: passes — The authors put it forward as true.
- Checkable: passes — It can be checked against evidence.
- Load-bearing: passes — The paper’s conclusions depend on it.
- Based: passes — The paper gives a reason why it holds.
Probably not a substantial claim.
A conclusion the paper draws from its own results — it cites no other source for it, so there is none to check. The quote shows it is in the paper.
In the paper
“which probably results from enhanced PINK1 mRNA synthesis (Fig. 6b).”
§ Altered mitochondrial dynamics and function in APOE4-expressing astrocytes > Results > Rapamycin induces mitophagy and restores mitochondrial function in APOE4-expressing astrocytes
hedgedconditional- Asserted: passes — The authors put it forward as true.
- Checkable: passes — It can be checked against evidence.
- Load-bearing: fails — The paper’s conclusions may not depend on it.
- Based: passes — The paper gives a reason why it holds.
Probably not a substantial claim. The paper’s conclusions may not depend on it.
A conclusion the paper draws from its own results — it cites no other source for it, so there is none to check. The quote shows it is in the paper.
In the paper
“indicating reduced mitochondrial fission.”
§ Altered mitochondrial dynamics and function in APOE4-expressing astrocytes > Discussion
hedgeddirect- Asserted: passes — The authors put it forward as true.
- Checkable: passes — It can be checked against evidence.
- Load-bearing: passes — The paper’s conclusions depend on it.
- Based: passes — The paper gives a reason why it holds.
It may state two separate claims as one.
A conclusion the paper draws from its own results — it cites no other source for it, so there is none to check. The quote shows it is in the paper.
In the paper
“leading to increased Mfn1 levels and fusion, possibly interfering with mitophagy.”
§ Altered mitochondrial dynamics and function in APOE4-expressing astrocytes > Discussion
hedgeddirect- Asserted: passes — The authors put it forward as true.
- Checkable: passes — It can be checked against evidence.
- Load-bearing: passes — The paper’s conclusions depend on it.
- Based: passes — The paper gives a reason why it holds.
It may state two separate claims as one.
The paper relies on this without support.
The effect of APOE4 on mitochondrial dynamics was less studied.
“yet the effect of APOE4 on mitochondrial dynamics was less studied”
The paper relies on this without support.
Little is known about the effect of APOE4 on astrocyte mitochondria.
“little is known about APOE4 effect on their mitochondria”
The paper relies on this without support.
The human APOE3 and APOE4 targeted-replacement astrocyte cell lines differ only in APOE genotype.
“The human APOE3 and APOE4 targeted-replacement astrocyte cell lines were previously described16.”
The authors state this as an assumption.
Impaired removal of damaged mitochondria underlies APOE4 astrocytes mitochondrial dysfunction.
“Assuming that impaired removal of damaged mitochondria underlies APOE4 astrocytes mitochondrial dysfunction”
The paper relies on this without support.
The effects of APOE4 on mitochondrial dynamics and dysfunction are unclear.
“however, its effects on mitochondrial dynamics and dysfunction are unclear.”
Claims other papers make about this one
Each is checked against this paper’s own text: does it say what the citing paper says it does?
The source backs part of the claim, not all of it — or backs it for a different population, condition or comparison.
In the citing paper
“APOE4 astrocytes have an increased number of lipid droplets and impaired glucose utilization and mitochondrial function, lending further support to this hypothesis143,146,147 (Fig. 2b).”
From Multifaceted roles of APOE in Alzheimer disease (2024) · cites this paper as [147]
Experimental — accuracy not yet measuredThe source backs part of the claim, not all of it — or backs it for a different population, condition or comparison.
In the citing paper
“in both a mouse model and human postmortem brains, APOEε4 is linked to altered expression of proteins involved in mitochondrial fission and fusion, suggesting that an alteration in mitochondrial dynamics might lead to or arise from impaired mitochondrial function147,170.”
From Multifaceted roles of APOE in Alzheimer disease (2024) · cites this paper as [147]
Experimental — accuracy not yet measuredThe source backs part of the claim, not all of it — or backs it for a different population, condition or comparison.
In the citing paper
“Several models of AD have demonstrated altered mitochondrial dynamics, not only in neurons, but also in astrocytes [71].”
From Apoe4 and Alzheimer’s Disease Pathogenesis—Mitochondrial Deregulation and Targeted Therapeutic Strategies (2023) · cites this paper as [71]
Experimental — accuracy not yet measuredThe source backs part of the claim, not all of it — or backs it for a different population, condition or comparison.
In the citing paper
“It has been also suggested that ApoE4 inhibits Drp1 transcription and expression, which may be linked to the disruption of mitochondrial fission [71].”
From Apoe4 and Alzheimer’s Disease Pathogenesis—Mitochondrial Deregulation and Targeted Therapeutic Strategies (2023) · cites this paper as [71]
Experimental — accuracy not yet measuredThe cited source says what the claim attributes to it.
In the citing paper
“ApoE4-expressing astrocytes alter mitochondrial dynamics and function [53]”
From APOE4 genotype exacerbates the depression-like behavior of mice during aging through ATP decline (2021) · cites this paper as [53]
The cited source says what the claim attributes to it.
In the citing paper
“decreased fission and parkin-mediated mitophagy in APOE4 astrocytes [71].”
From Apoe4 and Alzheimer’s Disease Pathogenesis—Mitochondrial Deregulation and Targeted Therapeutic Strategies (2023) · cites this paper as [71]
Self-check
Percentages, sums and reported differences re-computed from the paper’s own numbers.
Each contradiction between two passages listed here was confirmed by an independent check.
Rated minor: it would not touch a result — a value no result rests on, a p-value that stays on the same side of the significance level, or a conflict that is clerical, resolved elsewhere in the paper, or outside its own findings.
In the paper
§ Altered mitochondrial dynamics and function in APOE4-expressing astrocytes > Results > Altered mitochondrial dynamics proteins expression and morphology in APOE4 astrocytes
“AIF and GAPDH were used as markers for cytosol and mitochondria, respectively.”
§ Altered mitochondrial dynamics and function in APOE4-expressing astrocytes > Results > Altered mitochondrial dynamics proteins expression and morphology in APOE4 astrocytes
“densitometric analysis of proteins in the mitochondrial fraction (normalized to AIF; fold of APOE3; n ≥ 3).”
Citations
Cites
Guidelines for the use and interpretation of assays for monitoring autophagy (3rd edition).
Klionsky, D. J., Abdelmohsen, K., Abe, A., Abedin, M. J., Abeliovich, H., Acevedo Arozena, A., Adachi, H., Adams, C. M., Adams, P. D., Adeli, K., et al. (2016) · Autophagy · doi:10.1080/15548627.2015.1100356 · Cited by 5,894 · cited 6×
“Accordingly, APOE3 astrocytes treated with CCCP combined with chloroquine showed increased accumulation of LC3-II compared to APOE4 astrocytes, indicating higher autophagic fl ux 30 (Fig.”
InfluentialParkin is recruited selectively to impaired mitochondria and promotes their autophagy
Narendra, D., Tanaka, A., Suen, D.-F., & Youle, R. J. (2008) · The Journal of Cell Biology · doi:10.1083/jcb.200809125 · Cited by 4,026
Mitophagy and Quality Control Mechanisms in Mitochondrial Maintenance
Pickles, S., Vigié, P., & Youle, R. J. (2018) · Current Biology · doi:10.1016/j.cub.2018.01.004 · Cited by 2,081
During autophagy mitochondria elongate, are spared from degradation and sustain cell viability
Gomes, L. C., Benedetto, G. D., & Scorrano, L. (2011) · Nature Cell Biology · doi:10.1038/ncb2220 · Cited by 1,735
PINK1-dependent recruitment of Parkin to mitochondria in mitophagy
Vives-Bauza, C., Zhou, C., Huang, Y., Cui, M., de Vries, R. L. A., Kim, J., May, J., Tocilescu, M. A., Liu, W., Ko, H. S., et al. (2010) · Proceedings of the National Academy of Sciences · doi:10.1073/pnas.0911187107 · Cited by 1,616
Mitochondrial dynamics: overview of molecular mechanisms
Tilokani, L., Nagashima, S., Paupe, V., & Prudent, J. (2018) · Essays in Biochemistry · doi:10.1042/ebc20170104 · Cited by 1,397
Rambold, A. S., Kostelecky, B., Elia, N., & Lippincott‐Schwartz, J. (2011) · Proceedings of the National Academy of Sciences · doi:10.1073/pnas.1107402108 · Cited by 1,188
Mitophagy and Alzheimer’s Disease: Cellular and Molecular Mechanisms
Kerr, J. S., Adriaanse, B. A., Greig, N. H., Mattson, M. P., Cader, M. Z., Bohr, V. A., & Fang, E. F. (2017) · Trends in Neurosciences · doi:10.1016/j.tins.2017.01.002 · Cited by 870
A simple ImageJ macro tool for analyzing mitochondrial network morphology in mammalian cell culture
Valente, A. J. F., Maddalena, L. A., Robb, E. L., Moradi, F., & Stuart, J. A. (2017) · Acta Histochemica · doi:10.1016/j.acthis.2017.03.001 · Cited by 870
Mitochondria and Mitochondrial Cascades in Alzheimer’s disease
Swerdlow, R. H. (2018) · Journal of Alzheimer’s Disease · doi:10.3233/jad-170585 · Cited by 850
Cited by
Sorted by citations
Items 101–125 of 125
Strattan, L. E. (2021) · UKnowledge (University of Kentucky) · doi:10.13023/etd.2021.097
Serrano, E., Barrantes, F. J., & Valdivieso, Á. G. (2023) · Protein Expression and Purification · doi:10.1016/j.pep.2023.106312
Kehmeier, M. N., Famiano, A., Cullen, A. E., Leonhardt, T., Ferguson, S., Snyder, M., McCurdy, C. E., Tyrrell, D. J., Alkayed, N. J., & Walker, A. E. (2025) · bioRxiv (Cold Spring Harbor Laboratory) · doi:10.1101/2025.07.23.666474
ApoE4 accelerates the condensate to amyloid transition of tauPreprint
Kumar, V. S. N. R., & Garai, K. (2025) · bioRxiv (Cold Spring Harbor Laboratory) · doi:10.1101/2025.11.22.689889
Resende, R. R., & Pereira, C. F. (2025) · Springer eBooks · doi:10.1007/978-3-031-52641-1_14-1
Recognizing Alzheimer’s disease and Parkinson’s disease as astrogliopathies
Kim, W. S., Tanglay, O., & Fu, Y. (2026) · Neural Regeneration Research · doi:10.4103/nrr.nrr-d-25-01452
Roland, N. J., Zigmond, J. W., Manganaro, J. E., Estrella, L. D., & Stauch, K. L. (2026) · Neurochemistry International · doi:10.1016/j.neuint.2026.106125 · Cited by 1
Kriwokon, S. L., Flores-Alonso, S. I., Kent, B. A., Wilson, T. W., Spooner, R. K., & Wiesman, A. I. (2026) · medRxiv · doi:10.64898/2026.03.25.26349329
Resende, R. R., & Pereira, C. F. (2026) · Springer eBooks · doi:10.1007/978-3-031-96089-5_14
Astrocyte subtype dynamics in mood disorders: Current insights and future directions
Chen, D., Wang, J., Zhu, G., & Yang, S. (2026) · Brain Network Disorders · doi:10.1016/j.bnd.2026.04.003
Frosina, M., Maurotti, S., Castagna, A., Montalcini, T., Pujia, A., & Tirinato, L. (2026) · MedComm · doi:10.1002/mco2.70789
Kehmeier, M. N., Famiano, A., Cullen, A. E., Leonhardt, T., Ferguson, S. J., Snyder, M., McCurdy, C. E., Tyrrell, D. J., Alkayed, N. J., & Walker, A. E. (2026) · The Journal of Physiology · doi:10.1113/jp290852 · Cited by 2
Apolipoprotein E in Alzheimer’s disease: Genetic predisposition and mechanistic implications
Koley, A., Aziz, N., Dash, B., Prakash, K. P., Firdaus, J. U., Atneriya, U. K., Wal, P., Kumar, A., & Ganeshpurkar, A. (2026) · Elsevier eBooks · doi:10.1016/b978-0-443-40563-1.00004-1
Nurbaev, S. D. (2026) · Кубанский научный медицинский вестник · doi:10.25207/1608-6228-2026-33-3-62-70
Singh, S. K., Dinodiya, H., Parihar, S., Korupalli, C., & Vankayala, R. (2026) · ACS Chemical Neuroscience · doi:10.1021/acschemneuro.6c00315
Chen, H., Cui, X.-N., & Deng, M. (2026) · Neurochemistry International · doi:10.1016/j.neuint.2026.106255
Vecino, R., Díaz‐Guerra, E., Arribas-González, E., Gil, D. S., Acosta, F. J. F., Serra, I., Moreno‐Jiménez, E. P., Moratalla, R., Navarrete, M., & Vicario‐Abejón, C. (2026) · Research Square · doi:10.21203/rs.3.rs-10968101/v1
Mitophagy strengthens metabolic and inflammatory resilience in the Alzheimer’s brain
Liao, S., Mayer, J., Naia, L., Veverová, K., Vyhnálek, M., Per, N., & Fang, E. F. (2026) · Cell Press Blue · doi:10.1016/j.cpblue.2026.100124
Šimončičová, E., Verkerke, M., Ibáñez, F. G., Bourgeois, R., Picard, K., Khakpour, M., Julia, T. C. W., Hol, E. M., & Tremblay, M. (2026) · Neuromethods · doi:10.1007/978-1-0716-5456-9_6
Membrane-Coated DNA Nanoflowers Attenuate Cognitive Decline in Apolipoprotein E4 Mice
Hang, Z., Sun, C., Cai, S., Bian, X., Zhou, L., Wen, Y., & Xing, C. (2026) · ACS Applied Materials & Interfaces · doi:10.1021/acsami.6c10103
Moreno, M. D. M. M., Celis, K., Rajabli, F., Whitehead, P. L., Hamilton‐Nelson, K. L., Dykxhoorn, D. M., Nuytemans, K., Mesulam, M. M., Bennett, D. A., Schuck, T., et al. (2026) · Frontiers in Aging Neuroscience · doi:10.3389/fnagi.2026.1888862
Lin, D., Luo, Y., Qiu, X., Ye, P., Chen, R., Xu, W., Zheng, R., Fu, X., Fan, K., Chen, D., et al. (2026) · Frontiers in Aging Neuroscience · doi:10.3389/fnagi.2026.1924123
Glial lipid reprogramming in brain aging: Lipid identity, organelle stress, and redox vulnerability
Rana, M., Ko, W., Nepali, K., Ko, C.-Y., Yen, T., Jan, J., Taliyan, R., Li, C.-H., & Yang, C. (2026) · Redox Biology · doi:10.1016/j.redox.2026.104453
A Review of ApoE4 Interference Targeting Mitophagy Molecular Pathways for Alzheimer's Disease
Chen, H., Chen, F., Jiang, Y., Zhang, L., Hu, G., Sun, F., Zhang, M., Ji, Y., Chen, Y., Che, G., et al. (2022) · Frontiers in Aging Neuroscience · doi:10.3389/fnagi.2022.881239 · Cited by 19
Metadata
- Authors
- Schmukler, E., Solomon, S., Simonovitch, S., Goldshmit, Y., Wolfson, E., Michaelson, D. M., & Pinkas-Kramarski, R.
- Affiliations
- Tel Aviv University (IL)
- Venue
- Cell Death & Disease
- Published
- 2020-07-24
- Volume
- 11
- Issue
- 7
- Pages
- 578-578
- ISSN
- 2041-4889 (ISSN-L)
- PMC
- PMC7382473
- OpenAlex
- W3044056525
- Semantic Scholar
- 9fa0c1c67d4017c08f026212ddf2c98325f1f7dd
- Cited by
- 125
- References
- 55
- Citations by year
- 2026: 27 · 2025: 21 · 2024: 19 · 2023: 18 · 2022: 14 · 2021: 23 · 2020: 3
- FWCI
- 4.70
- Type
- journal article
- Language
- en
- Open access
- gold
- doi.org
- Locations
- Cell Death and Disease (publishedVersion, cc-by)
- PubMed Central (publishedVersion, cc-by)
- PubMed (publishedVersion)
- Funders
- The Prajs-Drimmer Institute for the Development of Anti-Degenerative Drugs and SAIA Fund for HIV and Parkinson’s Diseases Research, Tel Aviv University.
- Topics
- Life Sciences › Biochemistry, Genetics and Molecular Biology › Molecular Biology › Mitochondrial Function and Pathology
- Life Sciences › Neuroscience › Cellular and Molecular Neuroscience › Alzheimer's disease research and treatments
- Life Sciences › Biochemistry, Genetics and Molecular Biology › Cell Biology › Autophagy in Disease and Therapy
- Keywords
- APOE ε4, astrocytes, mitochondrial dynamics, mitochondrial fission, mitochondrial fusion, mitophagy, autophagy, mitochondrial function, rapamycin, Alzheimer's disease, APOE3
- MeSH terms
- Astrocytes, Carbonyl Cyanide m-Chlorophenyl Hydrazone, Cell Line, Humans, Lysosomes, Mitochondria, Sirolimus, Mitochondrial Proteins, Proteasome Endopeptidase Complex, Apolipoprotein E3, Apolipoprotein E4, Ubiquitination, Proteolysis, Mitochondrial Dynamics
About these checks
Registry, retraction, Cites and statistics results are computed, not judged, with one exception: a printed reference that no index lists is read once by a model before it counts as a citation error. Claims are extracted by a model and kept only when their quote appears verbatim in the text; each cited source is then checked, with a model’s help, for whether it says what the claim relies on. Those verdicts can be wrong — read the claim’s quote and the cited source before relying on one.
A language model drew the claims from the paper on 2026-11-02, under version 3 of the claim definition (model deepseek-v4.1-flash, prompt extract-v3).
A second model labelled each claim on 2026-11-02 (model jev-1.13-20260917, definition revision gold-guideline-v0.2).
Cited sources are checked with a language model’s help (gpt-6-sol).
Statistics and arithmetic are recomputed, not judged.
Confidence bands are shown only for fields calibrated on our annotated test set. None is calibrated yet, so no band is shown.
What counts as a claim ›How we measure confidence ›How we check this ›
Are you an author, or do you see a problem with this page? Request a review
