

The DOI matches its Crossref record; 55 of the 56 references it cites were found in a registry or an index.
Light-driven transformable optical agent with adaptive functions for boosting cancer surgery outcomes
Open accessAbstract
Fluorescence and photoacoustic imaging have different advantages in cancer diagnosis; however, combining effects in one agent normally requires a trade-off as the mechanisms interfere. Here, based on rational molecular design, we introduce a smart organic nanoparticle whose absorbed excitation energy can be photo-switched to the pathway of thermal deactivation for photoacoustic imaging, or to allow opposed routes for fluorescence imaging and photodynamic therapy. The molecule is made of a dithienylethene (DTE) core with two surrounding 2-(1-(4-(1,2,2-triphenylvinyl)phenyl)ethylidene)malononitrile (TPECM) units (DTE-TPECM). The photosensitive molecule changes from a ring-closed, for photoacoustic imaging, to a ring-opened state for fluorescence and photodynamic effects upon an external light trigger. The nanoparticles’ photoacoustic and fluorescence imaging properties demonstrate the advantage of the switch. The use of the nanoparticles improves the outcomes of in vivo cancer surgery using preoperative photoacoustic imaging and intraoperative fluorescent visualization/photodynamic therapy of residual tumours to ensure total tumour removal.
Overview
The claims and statistics of this paper haven’t been checked yet.
Run the check — free, no account needed. It reads the open-access text and checks the sources it cites.
Integrity signals
Registry
Cites
Statistics
Figures
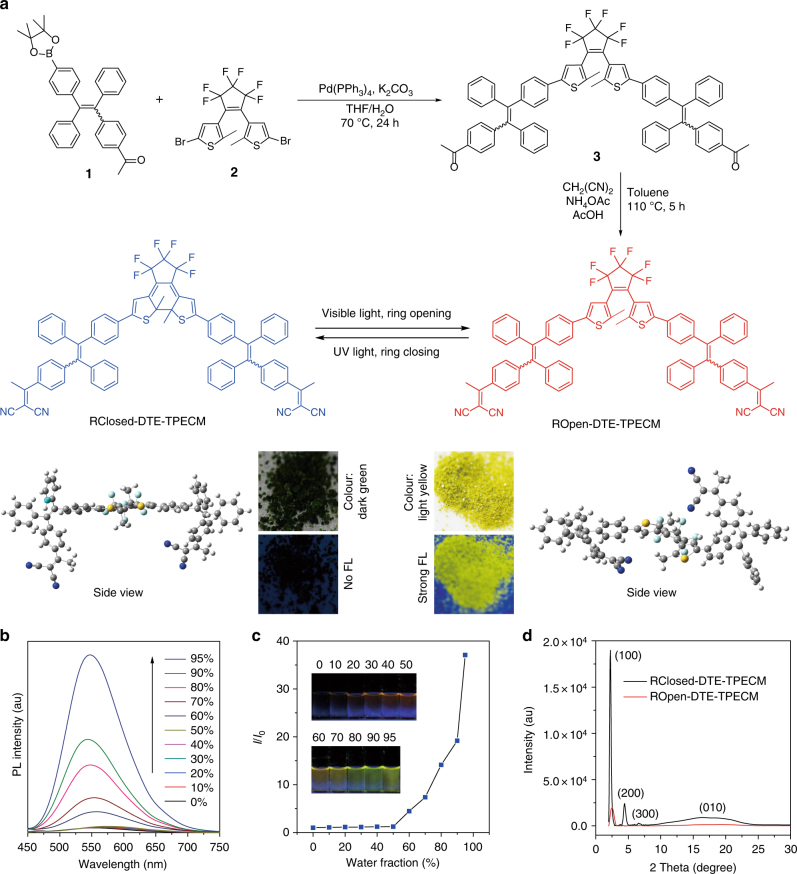
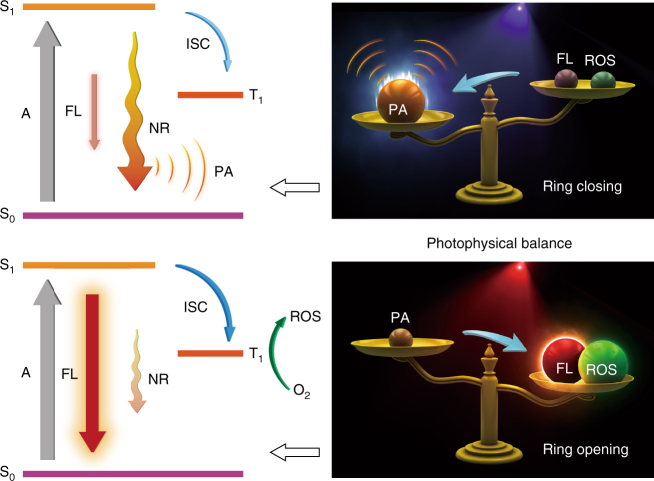
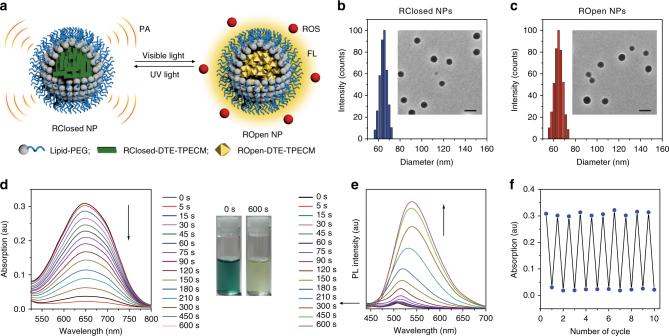
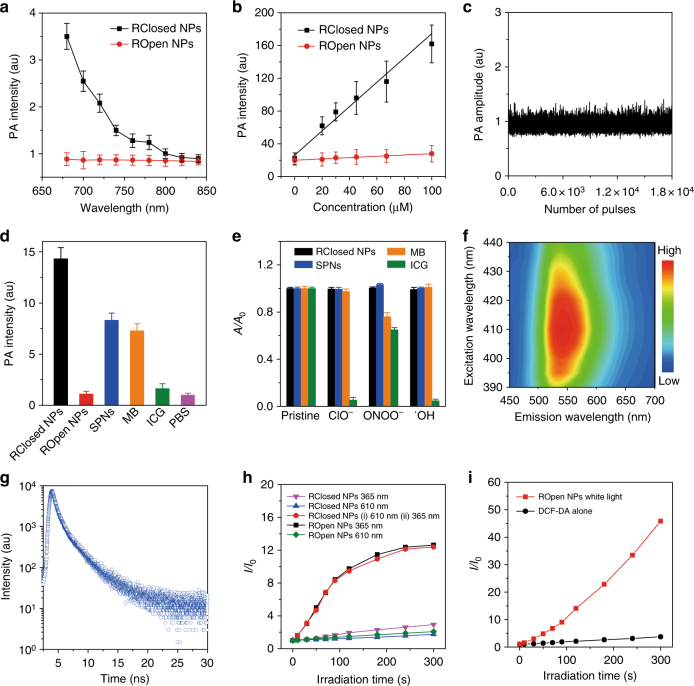
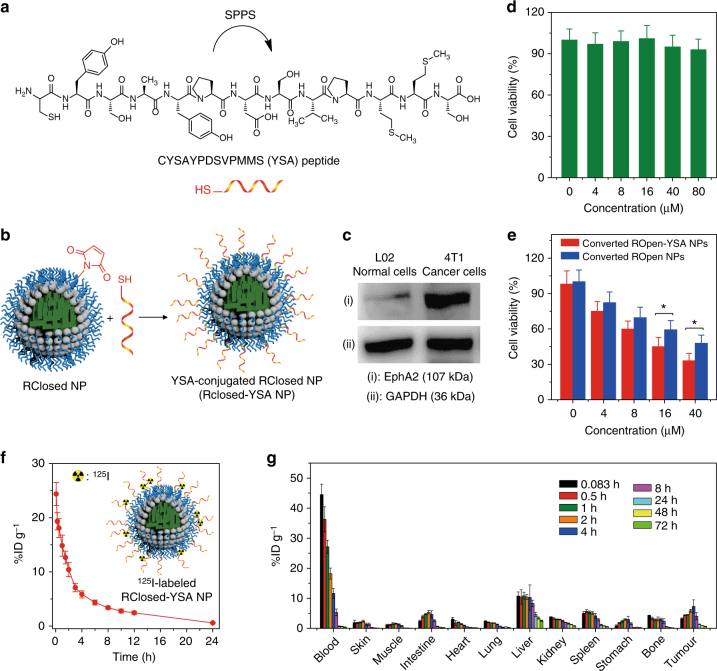
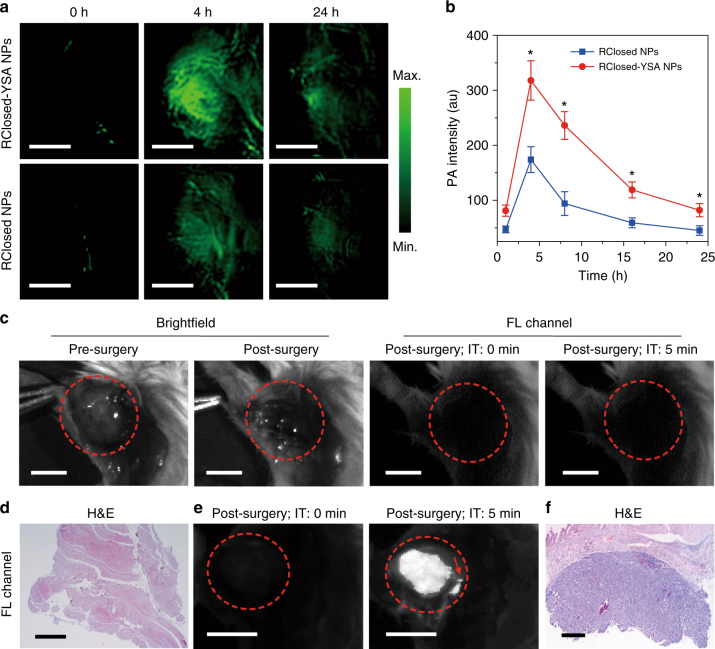
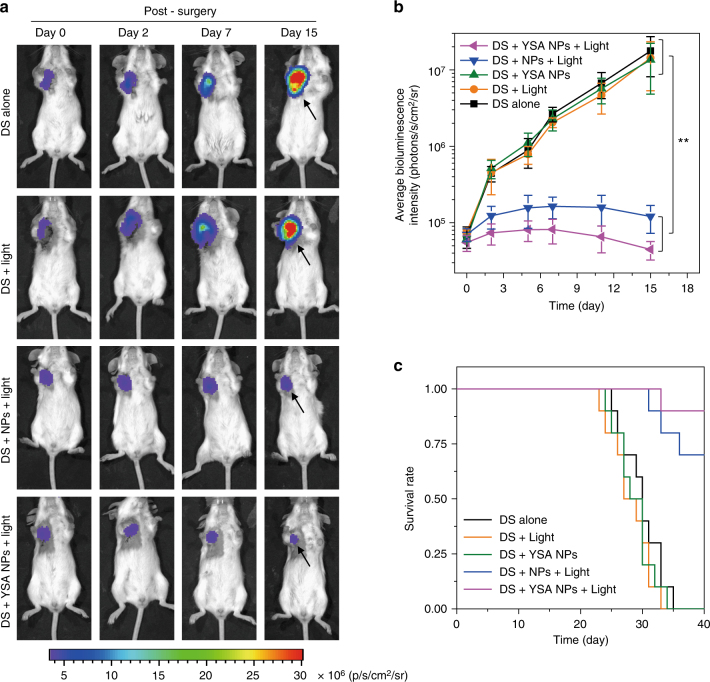
Verification
Claims the paper makes
The claims and statistics of this paper haven’t been checked yet.
Run the check — free, no account needed. It reads the open-access text and checks the sources it cites.
Self-check
Percentages, sums and reported differences re-computed from the paper’s own numbers.
The self-check needs the paper’s full text.
Citations
Cites
Photoacoustic tomography: In vivo imaging from organelles to organs
Wang, L. V., & Hu, S. (2012) · Science · doi:10.1126/science.1216210 · Cited by 4,331
Photochromism of Diarylethene Molecules and Crystals: Memories, Switches, and Actuators
Irie, M., Fukaminato, T., Matsuda, K., & Kobatake, S. (2014) · Chemical Reviews · doi:10.1021/cr500249p · Cited by 2,739
Peroxynitrite: biochemistry, pathophysiology and development of therapeutics
Szabó, C., Ischiropoulos, H., & Radi, R. (2007) · Nature Reviews Drug Discovery · doi:10.1038/nrd2222 · Cited by 2,134
Functional photoacoustic microscopy for high-resolution and noninvasive in vivo imaging
Zhang, H. F., Maslov, K., Stoica, G., & Wang, L. V. (2006) · Nature Biotechnology · doi:10.1038/nbt1220 · Cited by 1,855
Bioprobes Based on AIE Fluorogens
Ding, D., Li, K., Liu, B., & Tang, B. Z. (2013) · Accounts of Chemical Research · doi:10.1021/ar3003464 · Cited by 1,835
Self-citationA small-molecule dye for NIR-II imaging
Antaris, A. L., Chen, H., Cheng, K., Sun, Y., Hong, G., Qu, C., Diao, S., Deng, Z., Hu, X., Zhang, B., et al. (2016) · Nature Materials · doi:10.1038/nmat4476 · Cited by 1,778
Self-citationOvercoming the Achilles' heel of photodynamic therapy
Fan, W., Huang, P., & Chen, X. S. (2016) · Chemical Society Reviews · doi:10.1039/c6cs00616g · Cited by 1,693
Pharmacokinetics and Biodistribution of Nanoparticles
Li, S., & Huang, L. (2008) · Molecular Pharmaceutics · doi:10.1021/mp800049w · Cited by 1,603
Image-guided cancer surgery using near-infrared fluorescence
Vahrmeijer, A. L., Hutteman, M., van der Vorst, J. R., van de Velde, C. J. �., & Frangioni, J. V. (2013) · Nature Reviews Clinical Oncology · doi:10.1038/nrclinonc.2013.123 · Cited by 1,507
Lü, Y., Aimetti, A. A., Langer, R., & Gu, Z. (2016) · Nature Reviews Materials · doi:10.1038/natrevmats.2016.75 · Cited by 1,448
Cited by
Sorted by citations
Photothermal therapy and photoacoustic imaging via nanotheranostics in fighting cancer
Liu, Y., Bhattarai, P., Dai, Z., & Chen, X. S. (2018) · Chemical Society Reviews · doi:10.1039/c8cs00618k · Cited by 2,936
Recent Strategies to Develop Innovative Photosensitizers for Enhanced Photodynamic Therapy
Pham, T. C., Nguyen, V.-N., Choi, Y., Lee, S., & Yoon, J. (2021) · Chemical Reviews · doi:10.1021/acs.chemrev.1c00381 · Cited by 1,813
Polymeric Nanoparticles for Drug Delivery
Beach, M. A., Nayanathara, U., Gao, Y., Zhang, C., Xiong, Y., Wang, Y., & Such, G. K. (2024) · Chemical Reviews · doi:10.1021/acs.chemrev.3c00705 · Cited by 1,279
Design of superior phototheranostic agents guided by Jablonski diagrams
Feng, G., Zhang, G., & Ding, D. (2020) · Chemical Society Reviews · doi:10.1039/d0cs00671h · Cited by 809
Self-citationPhotoacoustic Imaging: Contrast Agents and Their Biomedical Applications
Fu, Q., Zhu, R., Song, J., Yang, H., & Chen, X. S. (2018) · Advanced Materials · doi:10.1002/adma.201805875 · Cited by 685
Aggregation-Induced Emission Luminogens for Activity-Based Sensing
Wang, D., & Tang, B. Z. (2019) · Accounts of Chemical Research · doi:10.1021/acs.accounts.9b00305 · Cited by 510
Self-citationChen, C., Ni, X., Jia, S., Liang, Y., Wu, X., Kong, D., & Ding, D. (2019) · Advanced Materials · doi:10.1002/adma.201904914 · Cited by 505
Self-citationZhao, Z., Chen, C., Wu, W., Wang, F., Du, L., Zhang, X., Xiong, Y., He, X., Cai, Y., Kwok, R. T. K., et al. (2019) · Nature Communications · doi:10.1038/s41467-019-08722-z · Cited by 479
Self-citationZhang, Z., Xu, W., Kang, M., Wen, H., Guo, H., Zhang, P., Xi, L., Li, K., Wang, L., Wang, D., et al. (2020) · Advanced Materials · doi:10.1002/adma.202003210 · Cited by 436
Self-citationKang, M., Zhou, C., Wu, S., Yu, B., Zhang, Z., Song, N., Lee, M. M. S., Xu, W., Xu, F., Wang, D., et al. (2019) · Journal of the American Chemical Society · doi:10.1021/jacs.9b07162 · Cited by 416
Self-citationRecent advances of AIE light-up probes for photodynamic therapy
Liu, S., Feng, G., Tang, B. Z., & Liu, B. (2021) · Chemical Science · doi:10.1039/d1sc00045d · Cited by 376
Self-citationWan, Q., Zhang, R., Zhuang, Z., Li, Y., Huang, Y., Wang, Z., Zhang, W., Hou, J., & Tang, B. Z. (2020) · Advanced Functional Materials · doi:10.1002/adfm.202002057 · Cited by 369
Self-citationAggregation-Induced Emission: A Trailblazing Journey to the Field of Biomedicine
Zhu, C., Kwok, R. T. K., Lam, J. W. Y., & Tang, B. Z. (2018) · ACS Applied Bio Materials · doi:10.1021/acsabm.8b00600 · Cited by 348
Self-citationChen, C., Ou, H., Liu, R., & Ding, D. (2019) · Advanced Materials · doi:10.1002/adma.201806331 · Cited by 344
Self-citationYang, Y., Fan, X., Li, L., Yang, Y., Alifu, N., Xue, D., He, C., Qian, J., Hu, Q., Chen, H., et al. (2020) · ACS Nano · doi:10.1021/acsnano.0c00043 · Cited by 308
Gathering brings strength: How organic aggregates boost disease phototheranostics
Qi, J., Ou, H., Liu, Q., & Ding, D. (2021) · Aggregate · doi:10.1002/agt2.25 · Cited by 284
Self-citationChen, C., Ni, X., Tian, H., Liu, Q., Guo, D., & Ding, D. (2020) · Angewandte Chemie International Edition · doi:10.1002/anie.201916430 · Cited by 281
Self-citationFeng, L., Li, C., Liu, L., Wang, Z., Chen, Z., Yu, J., Ji, W., Jiang, G., Zhang, P., Wang, J., et al. (2022) · ACS Nano · doi:10.1021/acsnano.1c10019 · Cited by 268
Self-citationTuning Organelle Specificity and Photodynamic Therapy Efficiency by Molecular Function Design
Liu, Z., Zou, H., Zhao, Z., Zhang, P., Shan, G.-G., Kwok, R. T. K., Lam, J. W. Y., Zheng, L., & Tang, B. Z. (2019) · ACS Nano · doi:10.1021/acsnano.9b04430 · Cited by 260
Self-citationWang, X., Li, P., Ding, Q., Wu, C., Zhang, W., & Tang, B. (2019) · Journal of the American Chemical Society · doi:10.1021/jacs.8b11414 · Cited by 254
Self-citationHe, J., Li, C., Ding, L., Huang, Y., Yin, X., Zhang, J., Zhang, J., Yao, C., Liang, M., Pirraco, R. P., et al. (2019) · Advanced Materials · doi:10.1002/adma.201902409 · Cited by 248
Qi, J., Sun, C., Li, D., Zhang, H., Yu, W., Zebibula, A., Lam, J. W. Y., Xi, W., Zhu, L., Cai, F., et al. (2018) · ACS Nano · doi:10.1021/acsnano.8b02452 · Cited by 226
Self-citationZhang, Q., Yu, P., Fan, Y., Sun, C., He, H., Liu, X., Lu, L., Zhao, M., Zhang, H., & Zhang, F. (2021) · Angewandte Chemie International Edition · doi:10.1002/anie.202012427 · Cited by 216
Advanced Nanotechnology Leading the Way to Multimodal Imaging‐Guided Precision Surgical Therapy
Wang, C., Fan, W., Zhang, Z., Wen, Y., Xiong, L., & Chen, X. S. (2019) · Advanced Materials · doi:10.1002/adma.201904329 · Cited by 216
Cheng, H., Zhang, S., Bai, E.-Y., Cao, X., Wang, J., Qi, J., Liu, J., Zhao, J., Zhang, L., & Yoon, J. (2021) · Advanced Materials · doi:10.1002/adma.202108289 · Cited by 203
Self-citationDai, Y., Su, J., Wu, K., Ma, W., Wang, B., Li, M., Sun, P., Shen, Q., Wang, Q., & Fan, Q. (2019) · ACS Applied Materials & Interfaces · doi:10.1021/acsami.8b22748 · Cited by 195
Kang, X., Zhang, Y., Song, J., Wang, L., Li, W., Qi, J., & Tang, B. Z. (2023) · Nature Communications · doi:10.1038/s41467-023-40996-2 · Cited by 201
Self-citationGao, M., & Tang, B. Z. (2019) · Coordination Chemistry Reviews · doi:10.1016/j.ccr.2019.213076 · Cited by 187
Self-citationWang, Z., Wang, N., Cheng, S., Xu, K., Deng, Z., Chen, S., Xu, Z., Xie, K., Tse, M., Shi, P., et al. (2019) · Chem · doi:10.1016/j.chempr.2019.08.021 · Cited by 186
Wang, D., Lee, M. M. S., Xu, W., Kwok, R. T. K., Lam, J. W. Y., & Tang, B. Z. (2018) · Theranostics · doi:10.7150/thno.27787 · Cited by 182
Self-citationHu, J., Jiang, W., Yuan, L., Duan, C., Yuan, Q., Long, Z., Lou, X., & Xia, F. (2021) · Aggregate · doi:10.1002/agt2.10 · Cited by 172
Chen, H., Qin, Z., Zhao, J., He, Y., Ren, E., Zhu, Y., Liu, G., Mao, C., & Zheng, L. X. (2019) · Biomaterials · doi:10.1016/j.biomaterials.2019.119520 · Cited by 165
Photoswitchable diarylethenes: From molecular structures to biological applications
Li, Z., Zeng, X., Gao, C., Song, J., He, F., Tian, H., Guo, H., & Yin, J. (2023) · Coordination Chemistry Reviews · doi:10.1016/j.ccr.2023.215451 · Cited by 155
Stimulus‐responsive room temperature phosphorescence in purely organic luminogens
Yang, J., Fang, M., & Li, Z. (2020) · InfoMat · doi:10.1002/inf2.12107 · Cited by 156
Modular Design of Peptide- or DNA-Modified AIEgen Probes for Biosensing Applications
Xia, F., Wu, J., Wu, X., Hu, Q., Dai, J., & Lou, X. (2019) · Accounts of Chemical Research · doi:10.1021/acs.accounts.9b00348 · Cited by 157
Yang, H., Li, M., Li, C., Luo, Q., Zhu, M., Tian, H., & Zhu, W. (2019) · Angewandte Chemie International Edition · doi:10.1002/anie.201909830 · Cited by 154
Activatable molecular agents for cancer theranostics
Zhang, J., Ning, L., Huang, J., Zhang, C., & Pu, K. (2019) · Chemical Science · doi:10.1039/c9sc05460j · Cited by 154
AIEgen-coupled upconversion nanoparticles eradicate solid tumors through dual-mode ROS activation
Mao, D., Hu, F., Yi, Z., Kenry, K., Xu, S., Yan, S., Luo, Z., Wu, W., Wang, Z., Kong, D., et al. (2020) · Science Advances · doi:10.1126/sciadv.abb2712 · Cited by 153
Manipulating cell fate: dynamic control of cell behaviors on functional platforms
Li, W., Yan, Z., Ren, J., & Qu, X. (2018) · Chemical Society Reviews · doi:10.1039/c8cs00053k · Cited by 152
AIE-based theranostic systems for detection and killing of pathogens
He, X., Xiong, L., Zhao, Z., Wang, Z., Luo, L., Lam, J. W. Y., Kwok, R. T. K., & Tang, B. Z. (2019) · Theranostics · doi:10.7150/thno.31844 · Cited by 149
Self-citationAggregation‐Induced Emission Luminogens: Union Is Strength, Gathering Illuminates Healthcare
Qi, J., Chen, C., Ding, D., & Tang, B. Z. (2018) · Advanced Healthcare Materials · doi:10.1002/adhm.201800477 · Cited by 143
Self-citationChen, X., Gao, H., Deng, Y., Jin, Q., Ji, J., & Ding, D. (2020) · ACS Nano · doi:10.1021/acsnano.0c02197 · Cited by 142
Self-citationEndoplasmic reticulum targeted AIE bioprobe as a highly efficient inducer of immunogenic cell death
Li, J., Gao, H., Liu, R., Chen, C., Zeng, S., Liu, Q., & Ding, D. (2020) · Science China Chemistry · doi:10.1007/s11426-020-9846-4 · Cited by 142
Self-citationSong, J., Wang, H., Meng, X., Li, W., & Qi, J. (2024) · Nature Communications · doi:10.1038/s41467-024-53906-x · Cited by 150
Self-citationAn AIE‐Based Probe for Rapid and Ultrasensitive Imaging of Plasma Membranes in Biosystems
Shi, L., Liu, Y., Li, K., Sharma, A. K., Yu, K., Ji, M. S., Li, L., Zhou, Q., Zhang, H., Kim, J. S., et al. (2019) · Angewandte Chemie International Edition · doi:10.1002/anie.201909498 · Cited by 137
Boosting Fluorescence-Photoacoustic-Raman Properties in One Fluorophore for Precise Cancer Surgery
Qi, J., Li, J., Liu, R., Li, Q., Zhang, H., Lam, J. W. Y., Kwok, R. T. K., Liu, D., Ding, D., & Tang, B. Z. (2019) · Chem · doi:10.1016/j.chempr.2019.07.015 · Cited by 133
Self-citationPan, C., Ou, M., Cheng, Q., Zhou, Y., Yu, Y., Li, Z., Zhang, F., Xia, D., Mei, L., & Ji, X. (2019) · Advanced Functional Materials · doi:10.1002/adfm.201906466 · Cited by 134
Hu, L., Cao, Z., Ma, L., Liu, Z., Liao, G., Wang, J., Shen, S., Li, D., & Yang, X. (2019) · Biomaterials · doi:10.1016/j.biomaterials.2019.119469 · Cited by 132
An Easily Available Ratiometric Reaction-Based AIE Probe for Carbon Monoxide Light-up Imaging
Wang, J., Li, C., Chen, Q., Li, H., Zhou, L., Jiang, X. Y., Shi, M., Zhang, P., Jiang, G., & Tang, B. Z. (2019) · Analytical Chemistry · doi:10.1021/acs.analchem.9b02691 · Cited by 131
Self-citationCui, J., Zhang, F., Yan, D., Han, T., Wang, L., Wang, D., & Tang, B. Z. (2023) · Advanced Materials · doi:10.1002/adma.202302639 · Cited by 131
Self-citationMousazadeh, H., Pilehvar‐Soltanahmadi, Y., Dadashpour, M., & Zarghami, N. (2020) · Journal of Controlled Release · doi:10.1016/j.jconrel.2020.11.011 · Cited by 133
Wang, Q., Xia, B., Xu, J., Niu, X., Cai, J., Shen, Q., Wang, W., Huang, W., & Fan, Q. (2019) · Materials Chemistry Frontiers · doi:10.1039/c9qm00036d · Cited by 127
Nano-Assemblies from J-Aggregated Dyes: A Stimuli-Responsive Tool Applicable To Living Systems
Su, M., Li, S., Zhang, H., Zhang, J., Chen, H., & Li, C. (2018) · Journal of the American Chemical Society · doi:10.1021/jacs.8b10396 · Cited by 123
2-Pyridone-functionalized Aza-BODIPY photosensitizer for imaging-guided sustainable phototherapy
Xiao, W., Wang, P., Ou, C., Huang, X., Tang, Y., Wu, M., Si, W., Shao, J., Huang, W., & Dong, X. (2018) · Biomaterials · doi:10.1016/j.biomaterials.2018.08.034 · Cited by 119
Song, J., Kang, X., Wang, L., Ding, D., Kong, D., Li, W., & Qi, J. (2023) · Nature Communications · doi:10.1038/s41467-023-42691-8 · Cited by 128
Self-citationUnity Makes Strength: How Aggregation‐Induced Emission Luminogens Advance the Biomedical Field
Gao, H., Zhang, X., Chen, C., Li, K., & Ding, D. (2018) · Advanced Biosystems · doi:10.1002/adbi.201800074 · Cited by 118
Self-citationCheng, H.-B., Qiao, B., Li, H., Cao, J., Luo, Y., Swamy, K. M. K., Zhao, J., Wang, Z., Lee, J. Y., Liang, X., et al. (2021) · Journal of the American Chemical Society · doi:10.1021/jacs.0c12851 · Cited by 115
Different Strategies for Organic Nanoparticle Preparation in Biomedicine
Fang, F., Li, M., Zhang, J., & Lee, C. (2020) · ACS Materials Letters · doi:10.1021/acsmaterialslett.0c00078 · Cited by 116
Shi, L., Yan, C., Guo, Z., Chi, W., Wei, J., Liu, W., Liu, X., Tian, H., & Zhu, W. (2020) · Nature Communications · doi:10.1038/s41467-020-14615-3 · Cited by 113
Nanoparticles-based phototherapy systems for cancer treatment: Current status and clinical potential
Li, J., Wang, S., Fontana, F., Tapeinos, C., Shahbazi, M., Han, H., & Santos, H. A. (2022) · Bioactive Materials · doi:10.1016/j.bioactmat.2022.11.013 · Cited by 112
Duan, X., Zhang, G., Ji, S., Zhang, Y., Li, J., Ou, H., Gao, Z., Feng, G., & Ding, D. (2022) · Angewandte Chemie International Edition · doi:10.1002/anie.202116174 · Cited by 110
Self-citationBarman, D., Narang, K., Parui, R., Zehra, N., Khatun, M. N., Adil, L. R., & Iyer, P. K. (2022) · Aggregate · doi:10.1002/agt2.172 · Cited by 113
Li, J., Fang, Y., Zhang, Y., Wang, H., Yang, Z., & Ding, D. (2021) · Advanced Materials · doi:10.1002/adma.202008518 · Cited by 108
Self-citationHuang, D., Lin, S., Wang, Q., Zhang, Y., Li, C., Ji, R., Wang, M., Chen, G., & Wang, Q. (2018) · Advanced Functional Materials · doi:10.1002/adfm.201806546 · Cited by 105
Niu, G., Zhang, R., Gu, Y., Wang, J., Ma, C., Kwok, R. T. K., Lam, J. W. Y., Sung, H. H. Y., Williams, I. D., Wong, K. S., et al. (2019) · Biomaterials · doi:10.1016/j.biomaterials.2019.04.002 · Cited by 101
Self-citationQi, J., Feng, L., Zhang, X., Zhang, H., Huang, L., Zhou, Y., Zhao, Z., zhao, Z., Duan, X., Xu, F., et al. (2021) · Nature Communications · doi:10.1038/s41467-021-21208-1 · Cited by 102
Self-citationYan, Q., & Wang, S. (2020) · Materials Chemistry Frontiers · doi:10.1039/d0qm00522c · Cited by 98
Bai, L., Yan, H., Bai, T., Feng, Y., Zhao, Y., Ji, Y., Feng, W., Lu, T., & Nie, Y. (2019) · Biomacromolecules · doi:10.1021/acs.biomac.9b01217 · Cited by 95
Gao, Y., Zheng, Q., Xu, S., Yuan, Y., Cheng, X. C., Jiang, S., Kenry, K., Yu, Q., Song, Z., Liu, B., et al. (2019) · Theranostics · doi:10.7150/thno.29101 · Cited by 91
Qi, J., Duan, X., Liu, W., Li, Y., Cai, Y., Lam, J. W. Y., Kwok, R. T. K., Ding, D., & Tang, B. Z. (2020) · Biomaterials · doi:10.1016/j.biomaterials.2020.120036 · Cited by 88
Self-citationJeon, S., Choi, W., Park, B., & Kim, C. (2021) · IEEE Transactions on Image Processing · doi:10.1109/tip.2021.3120053 · Cited by 87
Evoking Photothermy by Capturing Intramolecular Bond Stretching Vibration-Induced Dark-State Energy
Chen, M., Zhang, X., Liu, J., Liu, F., Zhang, R., Wei, P., Feng, H., Tu, M., Qin, A., Lam, J. W. Y., et al. (2020) · ACS Nano · doi:10.1021/acsnano.9b09625 · Cited by 87
Self-citationGao, H., Duan, X., Jiao, D., Zeng, Y., Zheng, X., Zhang, J., Ou, H., Qi, J., & Ding, D. (2021) · Angewandte Chemie International Edition · doi:10.1002/anie.202109048 · Cited by 88
Self-citationUltrasensitive detection of aqueous Cu 2+ ions by a coumarin-salicylidene based AIEgen
Padhan, S. K., Murmu, N., Mahapatra, S., Dalai, M. K., & Sahu, S. N. (2019) · Materials Chemistry Frontiers · doi:10.1039/c9qm00394k · Cited by 85
Xiao, Y.-F., Chen, J.-X., Li, S., Tao, W.-W., Tian, S., Wang, K., Cui, X., Huang, Z., Zhang, X.-H., & Lee, C.-S. (2020) · Chemical Science · doi:10.1039/c9sc05817f · Cited by 84
Self-citationA one-two punch targeting reactive oxygen species and fibril for rescuing Alzheimer’s disease
Wang, J., Shangguan, P., Chen, X., Zhong, Y., Lin, M., He, M., Liu, Y., Zhou, Y. L., Pang, X., Han, L., et al. (2024) · Nature Communications · doi:10.1038/s41467-024-44737-x · Cited by 84
Self-citationPathak, S., Ibele, L. M., Boll, R., Callegari, C., Demidovich, A. A., Erk, B., Feifel, R., Forbes, R., Fraia, M. D., Giannessi, L., et al. (2020) · Nature Chemistry · doi:10.1038/s41557-020-0507-3 · Cited by 84
Supramolecular Hydrogel Based on Chlorambucil and Peptide Drug for Cancer Combination Therapy
Yang, L., Zhang, C., Ren, C., Liu, J., Zhang, Y., Wang, J., Huang, F., Zhang, L., & Liu, J. (2018) · ACS Applied Materials & Interfaces · doi:10.1021/acsami.8b18425 · Cited by 79
Self-Adaptive Photodynamic-to-Photothermal Switch for Smart Antitumor Photoimmunotherapy
Yu, Y., Wang, H., Zhuang, Z., Ji, C., Zhang, L., Li, Y., Zhao, Z., Ding, D., Feng, G., & Tang, B. Z. (2024) · ACS Nano · doi:10.1021/acsnano.4c01600 · Cited by 78
Self-citationBai, C., Zhang, J., Qin, Y., Huang, H., Xia, Z., Zheng, Q., Dai, H., Lu, P., Miao, H., Qu, C., et al. (2022) · Chemical Engineering Journal · doi:10.1016/j.cej.2022.136445 · Cited by 77
Cheng, Z., Zhang, T., Wang, W., Shen, Q., Hong, Y., Shao, J., Xie, X., Fei, Z., & Dong, X. (2021) · Chinese Chemical Letters · doi:10.1016/j.cclet.2021.02.017 · Cited by 76
Li, Z., Chen, S., Huang, Y., Zhou, H., Yang, S., Zhang, H.-N., Wang, M., Guo, H., & Yin, J. (2022) · Chemical Engineering Journal · doi:10.1016/j.cej.2022.138087 · Cited by 74
Light‐Activated Nanoprobes for Biosensing and Imaging
Li, M., Zhao, J., Chu, H., Mi, Y., Zhou, Z., Di, Z., Zhao, M., & Li, L. (2018) · Advanced Materials · doi:10.1002/adma.201804745 · Cited by 74
Che, W., Zhang, L., Li, Y., Zhu, D., Xie, Z., Li, G., Zhang, P., Su, Z., Dou, C., & Tang, B. Z. (2019) · Analytical Chemistry · doi:10.1021/acs.analchem.8b05024 · Cited by 73
Self-citationGe, Y., Mu, X., Pan, X., Tang, Y., Yao, Q., Wang, Y., Jiang, F., Du, F., Xie, J., Zhou, X., et al. (2023) · Chemical Science · doi:10.1039/d2sc05729h · Cited by 74
Molecularly near-infrared fluorescent theranostics for in vivo tracking tumor-specific chemotherapy
Yan, C., Shi, L., Guo, Z., & Zhu, W. (2019) · Chinese Chemical Letters · doi:10.1016/j.cclet.2019.08.038 · Cited by 71
Highly stable and bright AIE dots for NIR-II deciphering of living rats
Qi, J., Alifu, N., Zebibula, A., Wei, P., Lam, J. W. Y., Peng, H., Kwok, R. T. K., Qian, J., & Tang, B. Z. (2020) · Nano Today · doi:10.1016/j.nantod.2020.100893 · Cited by 74
Self-citationPEG‐Polymer Encapsulated Aggregation‐Induced Emission Nanoparticles for Tumor Theranostics
Dai, J., Dong, X., Wang, Q., Lou, X., Xia, F., & Wang, S. (2021) · Advanced Healthcare Materials · doi:10.1002/adhm.202101036 · Cited by 73
Image‐guided tumor surgery: The emerging role of nanotechnology
Wojtynek, N. E., & Mohs, A. M. (2020) · Wiley Interdisciplinary Reviews Nanomedicine and Nanobiotechnology · doi:10.1002/wnan.1624 · Cited by 76
Nanoprobes with aggregation-induced emission for theranostics
Wu, W., & Li, Z. (2020) · Materials Chemistry Frontiers · doi:10.1039/d0qm00617c · Cited by 71
Highly Stable and Bright NIR-II AIE Dots for Intraoperative Identification of Ureter
Du, J., Liu, S., Zhang, P., Liu, H., Li, Y., He, W., Li, C., Chau, J. H. C., Kwok, R. T. K., Lam, J. W. Y., et al. (2020) · ACS Applied Materials & Interfaces · doi:10.1021/acsami.9b22957 · Cited by 70
Self-citationSequential Protein-Responsive Nanophotosensitizer Complex for Enhancing Tumor-Specific Therapy
Li, X., Fan, H., Guo, T., Bai, H., Kwon, N., Kim, K. H., Yu, S., Cho, Y., Kim, H., Nam, K. T., et al. (2019) · ACS Nano · doi:10.1021/acsnano.9b01100 · Cited by 70
Self-citationAcid-Triggered Nanoexpansion Polymeric Micelles for Enhanced Photodynamic Therapy
Zhong, S., Chen, C., Yang, G., Zhu, Y., Cao, H., Xu, B., Luo, Y., Gao, Y., & Zhang, W. (2019) · ACS Applied Materials & Interfaces · doi:10.1021/acsami.9b12620 · Cited by 70
Self-citationJiang, G., Li, C., Liu, X., Chen, Q., Li, X., Gu, X., Zhang, P., Lai, Q., & Wang, J. (2020) · Advanced Optical Materials · doi:10.1002/adom.202001119 · Cited by 70
Recent Progress in Type I Aggregation-Induced Emission Photosensitizers for Photodynamic Therapy
Yu, Y., Jia, H., Liu, Y., Zhang, L., Feng, G., & Tang, B. Z. (2022) · Molecules · doi:10.3390/molecules28010332 · Cited by 71
Self-citationHe, X., Peng, C., Qiang, S., Xiong, L., Zhao, Z., Wang, Z., Kwok, R. T. K., Lam, J. W. Y., Ma, N., & Tang, B. Z. (2020) · Biomaterials · doi:10.1016/j.biomaterials.2020.119834 · Cited by 68
Self-citationWang, B., Leng, J., Wang, X., & Zhao, W. (2022) · Food Chemistry · doi:10.1016/j.foodchem.2022.132768 · Cited by 68
Awasthi, P., An, X., Xiang, J., Kalva, N., Shen, Y., & Li, C. (2020) · Nanoscale · doi:10.1039/c9nr10918h · Cited by 67
Nanoparticles as contrast agents for photoacoustic brain imaging
Liu, X., Duan, Y., & Liu, B. (2021) · Aggregate · doi:10.1002/agt2.26 · Cited by 68
Yang, R., Ren, X., Mei, L., Pan, G., Li, X., Wu, Z., Zhang, S., Ma, W., Yu, W., Fang, H., et al. (2022) · Angewandte Chemie International Edition · doi:10.1002/anie.202117158 · Cited by 66
Metadata
- Authors
- Qi, J., Chen, C., Zhang, X., Hu, X., Ji, S., Kwok, R. T. K., Lam, J. W. Y., Ding, D., & Tang, B. Z.
- Affiliations
- Hong Kong University of Science and Technology (HK)
- Nankai University (CN)
- Corresponding author
- Ding, Dan
- Tang, Ben Zhong
- ORCID
- Venue
- Nature Communications
- Published
- 2018-05-10
- Volume
- 9
- Issue
- 1
- Pages
- 1848-1848
- ISSN
- 2041-1723 (ISSN-L)
- PMC
- PMC5945617
- OpenAlex
- W2802852094
- Cited by
- 350
- References
- 56
- Citations by year
- 2026: 10 · 2025: 19 · 2024: 38 · 2023: 29 · 2022: 58 · 2021: 41 · 2020: 58 · 2019: 75 · 2018: 22
- FWCI
- 19.59
- Type
- journal article
- Language
- en
- Open access
- gold
- doi.org
- Locations
- Nature Communications (publishedVersion, cc-by)
- Europe PMC (PubMed Central) (publishedVersion, other-oa)
- PubMed Central (publishedVersion, cc-by)
- PubMed (publishedVersion)
- RePEc: Research Papers in Economics (submittedVersion)
- DOAJ (DOAJ: Directory of Open Access Journals) (submittedVersion)
- DOAJ (DOAJ: Directory of Open Access Journals) (submittedVersion, cc-by-sa)
- Rare & Special e-Zone (The Hong Kong University of Science and Technology) (submittedVersion)
- Funders
- National Natural Science Foundation of China (ITCPD/17-9, N_HKUST604/14, AoE/P-03/08, 16301614, ITC-CNERC14SC01, IRT13023, 21 788 102, 16305015, 51622305)
- Innovation and Technology Commission (ITC PD/17-9, RE:ITCPD/17‐9, CNERC14SC01, ITC- CNERC-14SC01)
- Guangdong Province Introduction of Innovative R&D Team (201101C0105067115)
- National Key Research and Development Program of China (2015CB856503, IRT13023, 21788102)
- Topics
- Physical Sciences › Engineering › Biomedical Engineering › Nanoplatforms for cancer theranostics
- Physical Sciences › Materials Science › Materials Chemistry › Luminescence and Fluorescent Materials
- Physical Sciences › Engineering › Biomedical Engineering › Photoacoustic and Ultrasonic Imaging
- Keywords
- dithienylethene, photoacoustic imaging, fluorescence imaging, photodynamic therapy, organic nanoparticles, photoisomerization, cancer surgery
- MeSH terms
- Animals, Antineoplastic Agents, Female, Humans, Intraoperative Period, Male, Mice, Inbred BALB C, Neoplasms, Photochemotherapy, Temperature, Survival Rate, Treatment Outcome, Chemotherapy, Adjuvant, Rats, Sprague-Dawley, Photosensitizing Agents, Xenograft Model Antitumor Assays, Cell Line, Tumor, Mice, Rats, Nanoparticles, Preoperative Period, Photoacoustic Techniques, Optical Imaging
About these checks
Registry, retraction, Cites and statistics results are computed, not judged, with one exception: a printed reference that no index lists is read once by a model before it counts as a citation error. Claims are extracted by a model and kept only when their quote appears verbatim in the text; each cited source is then checked, with a model’s help, for whether it says what the claim relies on. Those verdicts can be wrong — read the claim’s quote and the cited source before relying on one.
Statistics and arithmetic are recomputed, not judged.
Confidence bands are shown only for fields calibrated on our annotated test set. None is calibrated yet, so no band is shown.
What counts as a claim ›How we measure confidence ›How we check this ›
Are you an author, or do you see a problem with this page? Request a review
