

The DOI matches its Crossref record; 79 of the 79 references it cites were found in a registry or an index; 2 of the 72 sources its claims cite were checked for support.
Cell type-specific transcriptional programs in mouse prefrontal cortex during adolescence and addiction
Open accessAbstract
Coordinated activity-induced transcriptional changes across multiple neuron subtypes of the prefrontal cortex (PFC) play a pivotal role in encoding and regulating major cognitive behaviors. Yet, the specific transcriptional programs in each neuron subtype remain unknown. Using single-cell RNA sequencing (scRNA-seq), here we comprehensively classify all unique cell subtypes in the PFC. We analyze transcriptional dynamics of each cell subtype under a naturally adaptive and an induced condition. Adaptive changes during adolescence (between P21 and P60), a highly dynamic phase of postnatal neuroplasticity, profoundly impacted transcription in each neuron subtype, including cell type-specific regulation of genes implicated in major neuropsychiatric disorders. On the other hand, an induced plasticity evoked by chronic cocaine addiction resulted in progressive transcriptional changes in multiple neuron subtypes and became most pronounced upon prolonged drug withdrawal. Our findings lay a foundation for understanding cell type-specific postnatal transcriptional dynamics under normal PFC function and in neuropsychiatric disease states.
Overview
AI snapshot
Written from the paper’s full text.
TL;DR
Using single-cell RNA sequencing, this study classifies cell types and subtypes in mouse prefrontal cortex and maps their transcriptional dynamics during adolescence (P21–P60) and chronic cocaine self-administration/withdrawal. It reports cell-type-specific changes, including regulation of neuropsychiatric disease-relevant GWAS genes and distinct pathways for adaptive versus cocaine-induced plasticity.
Key findings
- The PFC contained 8 major cell clusters; excitatory neurons made up 52.3% and inhibitory neurons 4.3% of total cells. Excitatory neurons resolved into 13 broad subtypes (26 at higher resolution) and inhibitory neurons into 12 subtypes; PFC excitatory subtypes were transcriptionally distinct from VISp and ALM, with unique subtypes and 273–555 differentially expressed genes even in similar clusters (FC > 2, q < 0.05).
- During adolescence (P21→P60), expression of at least 338 genes (Exc-1) to 1080 genes (Exc-8) changed across excitatory clusters; inhibitory changes ranged from 6 genes (Inhib-3) to 117 genes (Inhib-7), and non-neuronal endothelial cells had 879 genes affected.
- Chronic cocaine IVSA produced little transcriptional change during maintenance (≤10 genes per excitatory subtype, except Exc-6 with >40), but effects increased after withdrawal; at 15-day withdrawal all excitatory subtypes were impacted, with Exc-2, 6, 7, and 8 showing the greatest effects. Oxidative phosphorylation, mitochondrial function, and sirtuin signaling were the most significantly affected pathways.
- GWAS candidate genes for 12 PFC-related disorders showed cell type/subtype-enriched expression; 26–36% of GWAS candidates were dynamically regulated during adolescence for each disorder. For schizophrenia, Exc-13 had the most altered neuronal GWAS candidates; for bipolar disorder, Exc-8 had the most, followed by Exc-13; endothelial cells were the most affected non-neuronal type.
Methods
- Single-cell RNA-seq (10X Chromium) of mouse PFC: P60 for cell-type classification, P21 vs P60 for adolescence, and cocaine IVSA (saline vs cocaine) with PFC collected at maintenance, 48 h withdrawal, and 15-day withdrawal. All mice were male; 12 independent biological replicates were used, each pooling PFC from two mice; P21 data used 4 mice, and cocaine IVSA used 12 mice per group.
- Analyses included Seurat clustering, CCA/t-SNE alignment, differential expression (negative binomial GLM, likelihood ratio test, SC2P), MetaNeighbor for cross-region comparison, IPA pathway enrichment, and GWAS catalog enrichment; findings were validated with RNA in situ hybridization and smFISH.
Limitations
- Stated: low inhibitory neuron abundance limits statistical power and makes cocaine effects in inhibitory subtypes difficult to interpret; the age difference between adolescence (P21) and cocaine starting at P60 may contribute to differences; many factors modulate drug self-administration, and further studies are needed.
- Stated: although 26 high-resolution excitatory clusters were generated, differential expression used the 13 lower-resolution clusters for better power and accuracy; a marginal role of DNA methylation in early P21→P60 changes cannot be fully ruled out.
- Evident from the text: all mice were male, so sex differences are not addressed; the study is transcriptomic and correlational in mouse and does not report causal manipulations of candidate genes or subtypes.
Model-written summary. Check it against the paper before relying on it.
Integrity signals
Registry
Cites
Statistics
Figures
Verification
Claims the paper makes
136 Own result · 54 Not checked yet · 43 Own interpretation · 17 Own method · 7 No basis given · 1 Supported · 1 Partly supported · accuracy not yet measured
A result the paper reports from its own data — it cites no other source for it, so there is none to check. The quote shows it is in the paper.
In the paper
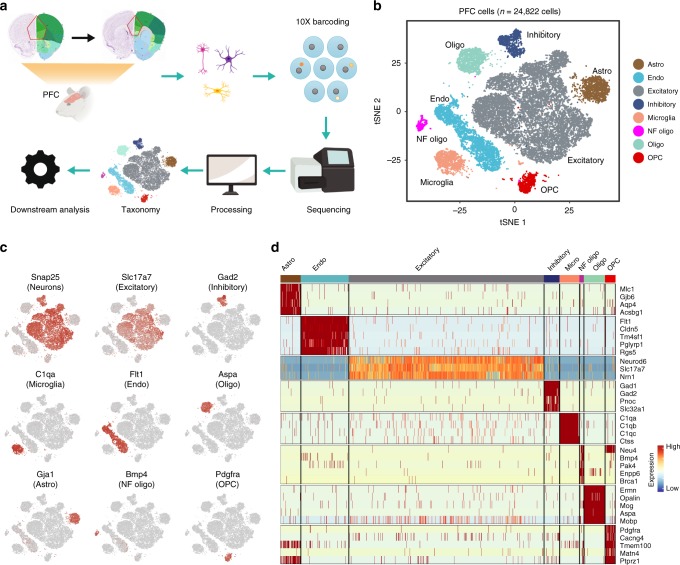
“Based on the expression of cell type-specific markers, the non-neuronal cells were clustered as: astrocytes (Gja1+), oligodendrocyte (Aspa+), newly formed oligodendrocytes (Bmp4+), oligodendrocyte precursors (Pdgfra+), microglia (C1qa+) and endothelial cells (Flt1+) (Fig. 1c, d).”
§ Cell type-specific transcriptional programs in mouse prefrontal cortex during adolescence and addiction > Results > Cellular composition of PFC
plainn = 12- Asserted: passes — The authors put it forward as true.
- Checkable: passes — It can be checked against evidence.
- Load-bearing: passes — The paper’s conclusions depend on it.
- Based: passes — The paper gives a reason why it holds.
A result the paper reports from its own data — it cites no other source for it, so there is none to check. The quote shows it is in the paper.
In the paper
“Using single-cell RNA sequencing (scRNA-seq), here we comprehensively classify all unique cell subtypes in the PFC.”
§ Cell type-specific transcriptional programs in mouse prefrontal cortex during adolescence and addiction > Abstract
plain- Asserted: passes — The authors put it forward as true.
- Checkable: passes — It can be checked against evidence.
- Load-bearing: passes — The paper’s conclusions depend on it.
- Based: passes — The paper gives a reason why it holds.
A result the paper reports from its own data — it cites no other source for it, so there is none to check. The quote shows it is in the paper.
In the paper
“including cell type-specific regulation of genes implicated in major neuropsychiatric disorders.”
§ Cell type-specific transcriptional programs in mouse prefrontal cortex during adolescence and addiction > Abstract
plaindirect- Asserted: passes — The authors put it forward as true.
- Checkable: passes — It can be checked against evidence.
- Load-bearing: passes — The paper’s conclusions depend on it.
- Based: passes — The paper gives a reason why it holds.
A result the paper reports from its own data — it cites no other source for it, so there is none to check. The quote shows it is in the paper.
In the paper
“On the other hand, an induced plasticity evoked by chronic cocaine addiction resulted in progressive transcriptional changes in multiple neuron subtypes and became most pronounced upon prolonged drug withdrawal.”
§ Cell type-specific transcriptional programs in mouse prefrontal cortex during adolescence and addiction > Abstract
plaindirect- Asserted: passes — The authors put it forward as true.
- Checkable: passes — It can be checked against evidence.
- Load-bearing: passes — The paper’s conclusions depend on it.
- Based: passes — The paper gives a reason why it holds.
A result the paper reports from its own data — it cites no other source for it, so there is none to check. The quote shows it is in the paper.
In the paper
“In the end, we obtained 9195 high quality non-neuronal (median UMI: 3764; median 1658 genes/cell) and 15,627 neuronal (median UMI: 13,194; median 3914 genes/cell) cells (Supplementary Fig. 1c), which can be separated into 8 major cell clusters (Fig. 1b).”
§ Cell type-specific transcriptional programs in mouse prefrontal cortex during adolescence and addiction > Results > Cellular composition of PFC
plainn = 12- Asserted: passes — The authors put it forward as true.
- Checkable: passes — It can be checked against evidence.
- Load-bearing: passes — The paper’s conclusions depend on it.
- Based: passes — The paper gives a reason why it holds.
A result the paper reports from its own data — it cites no other source for it, so there is none to check. The quote shows it is in the paper.
In the paper
“Importantly, each of the 8 major cell clusters can be detected in each of the 12 samples (Supplementary Fig. 1d).”
§ Cell type-specific transcriptional programs in mouse prefrontal cortex during adolescence and addiction > Results > Cellular composition of PFC
plainn = 12- Asserted: passes — The authors put it forward as true.
- Checkable: passes — It can be checked against evidence.
- Load-bearing: passes — The paper’s conclusions depend on it.
- Based: passes — The paper gives a reason why it holds.
A result the paper reports from its own data — it cites no other source for it, so there is none to check. The quote shows it is in the paper.
In the paper
“and became most pronounced upon prolonged drug withdrawal.”
§ Cell type-specific transcriptional programs in mouse prefrontal cortex during adolescence and addiction > Abstract
plaincorrelational- Asserted: passes — The authors put it forward as true.
- Checkable: passes — It can be checked against evidence.
- Load-bearing: passes — The paper’s conclusions depend on it.
- Based: passes — The paper gives a reason why it holds.
A result the paper reports from its own data — it cites no other source for it, so there is none to check. The quote shows it is in the paper.
In the paper
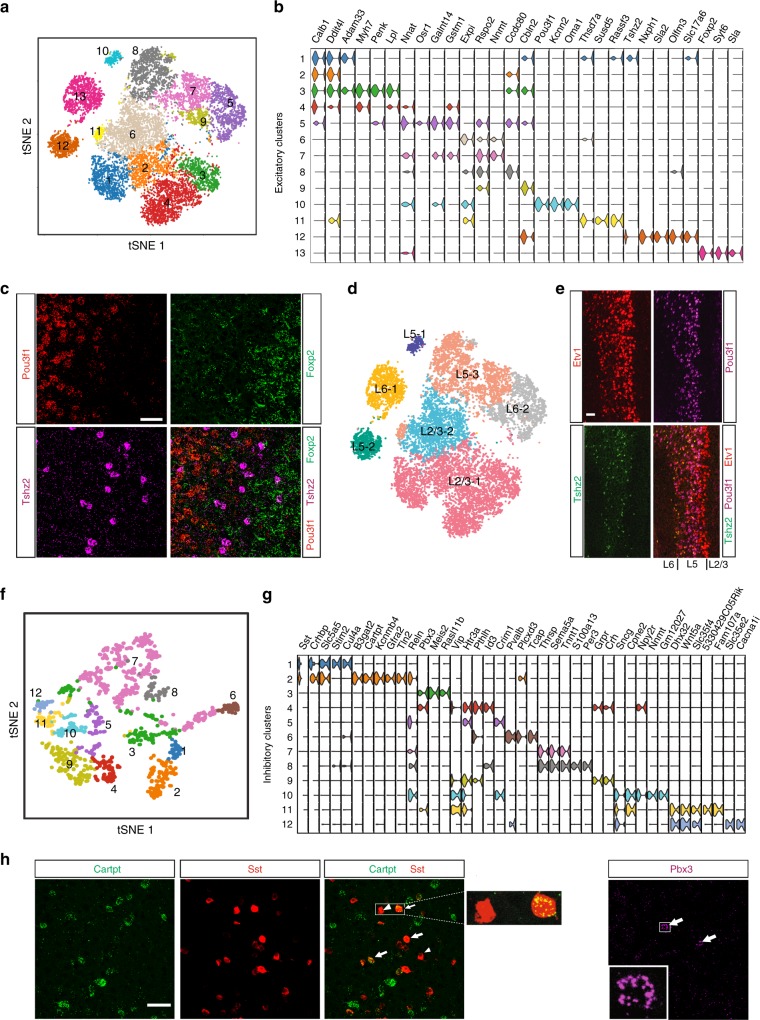
“Each subtype can be identified by unique expression of one or combination of 3–4 markers (Fig. 2b).”
§ Cell type-specific transcriptional programs in mouse prefrontal cortex during adolescence and addiction > Results > Molecularly distinct neuronal subtypes in the PFC
plaincorrelational- Asserted: passes — The authors put it forward as true.
- Checkable: passes — It can be checked against evidence.
- Load-bearing: passes — The paper’s conclusions depend on it.
- Based: passes — The paper gives a reason why it holds.
A result the paper reports from its own data — it cites no other source for it, so there is none to check. The quote shows it is in the paper.
In the paper
“A broad “low resolution” classification of excitatory neurons revealed 13 transcriptionally distinct clusters or subtypes (hereon referred as Exc-1, 2,..13) (Fig. 2a, Supplementary Fig. 2a).”
§ Cell type-specific transcriptional programs in mouse prefrontal cortex during adolescence and addiction > Results > Molecularly distinct neuronal subtypes in the PFC
plain- Asserted: passes — The authors put it forward as true.
- Checkable: passes — It can be checked against evidence.
- Load-bearing: passes — The paper’s conclusions depend on it.
- Based: passes — The paper gives a reason why it holds.
A result the paper reports from its own data — it cites no other source for it, so there is none to check. The quote shows it is in the paper.
In the paper
“Adaptive changes during adolescence (between P21 and P60), a highly dynamic phase of postnatal neuroplasticity, profoundly impacted transcription in each neuron subtype, including cell type-specific regulation of genes implicated in major neuropsychiatric disorders.”
§ Cell type-specific transcriptional programs in mouse prefrontal cortex during adolescence and addiction > Abstract
plaindirect- Asserted: passes — The authors put it forward as true.
- Checkable: passes — It can be checked against evidence.
- Load-bearing: passes — The paper’s conclusions depend on it.
- Based: passes — The paper gives a reason why it holds.
- Rests on an assumption: Mice are weaned from maternal care at P21 and begin exploring the environment on their own, and are considered as adult at P60.
- Probably not a substantial claim. 56
- It may state two separate claims as one. 92
Every source the paper cites for this claim was checked and supports it.
In the paper
“prior reports that DNA methylation events in cortex occur earlier in development40”
§ Cell type-specific transcriptional programs in mouse prefrontal cortex during adolescence and addiction > Results > Changes in epigenetic factors during adolescence
What the sources say
- Supportedcites [40] Lister, R. et al. Global epigenomic reconfiguration during mammalian brain development. Science 341, 1237905 (2013). source
The Accumulation of Non-CG DNA Methylation During Brain Development section (page unavailable) reports that methylation in frontal cortex increases most rapidly during early postnatal development, with slower accumulation through adolescence. This supports the broad claim about earlier developmental timing, though methylation does not stop after that early period. (LLM, conf=0.88)
plain- Asserted: passes — The authors put it forward as true.
- Checkable: passes — It can be checked against evidence.
- Load-bearing: passes — The paper’s conclusions depend on it.
- Based: passes — The paper gives a reason why it holds.
Probably not a substantial claim.
- Supported
The cited sources support only part of this claim — read each source’s verdict below.
In the paper
“Many psychiatric disorders associated with genetic defects surface during adolescence10.”
§ Cell type-specific transcriptional programs in mouse prefrontal cortex during adolescence and addiction > Discussion
What the sources say
- Partly supportedcites [10] Paus, T., Keshavan, M. & Giedd, J. N. Why do many psychiatric disorders emerge during adolescence? Nat. Rev. Neurosci. 9, 947–957 (2008). sourceExperimental — accuracy not yet measured
The “Relationship to psychopathology in adolescence” section says that many psychiatric disorders most commonly emerge during adolescence. The “Conclusions and future directions” section discusses possible genetic influences on brain maturation and illness onset, but does not establish that the many disorders listed are associated with genetic defects. Page numbers are unavailable in our copy. (LLM, conf=0.86)
plaincorrelational- Asserted: passes — The authors put it forward as true.
- Checkable: passes — It can be checked against evidence.
- Load-bearing: fails — The paper’s conclusions may not depend on it.
- Based: passes — The paper gives a reason why it holds.
Probably not a substantial claim. The paper’s conclusions may not depend on it.
- Partly supported
A result the paper reports from its own data — it cites no other source for it, so there is none to check. The quote shows it is in the paper.
In the paper
“The neurons express Snap25 and can be divided into excitatory (Slc17a7+) and inhibitory (Gad2+) neurons (Fig. 1c, d).”
§ Cell type-specific transcriptional programs in mouse prefrontal cortex during adolescence and addiction > Results > Cellular composition of PFC
plain- Asserted: passes — The authors put it forward as true.
- Checkable: passes — It can be checked against evidence.
- Load-bearing: passes — The paper’s conclusions depend on it.
- Based: passes — The paper gives a reason why it holds.
It may state two separate claims as one.
A result the paper reports from its own data — it cites no other source for it, so there is none to check. The quote shows it is in the paper.
In the paper
“Indeed, we found that excitatory and inhibitory neurons of the PFC exhibit great transcriptional differences, forming distinct cell subtypes.”
§ Cell type-specific transcriptional programs in mouse prefrontal cortex during adolescence and addiction > Results > Molecularly distinct neuronal subtypes in the PFC
plaincorrelational- Asserted: passes — The authors put it forward as true.
- Checkable: passes — It can be checked against evidence.
- Load-bearing: passes — The paper’s conclusions depend on it.
- Based: passes — The paper gives a reason why it holds.
It may state two separate claims as one.
A result the paper reports from its own data — it cites no other source for it, so there is none to check. The quote shows it is in the paper.
In the paper
“Using the two models (adolescence and drug addiction), we uncovered transcriptional dynamics in each neuron subtype associated with adaptive and challenge-induced neuroplasticity, highlighting distinct and conserved mechanisms.”
§ Cell type-specific transcriptional programs in mouse prefrontal cortex during adolescence and addiction > Introduction
plaincorrelational- Asserted: passes — The authors put it forward as true.
- Checkable: passes — It can be checked against evidence.
- Load-bearing: passes — The paper’s conclusions depend on it.
- Based: passes — The paper gives a reason why it holds.
It may state two separate claims as one.
A result the paper reports from its own data — it cites no other source for it, so there is none to check. The quote shows it is in the paper.
In the paper
“The excitatory neurons form the largest (52.3%) cell class in the PFC, while the inhibitory neurons comprise a smaller portion (4.3%) of the total populations, consistent with the general excitatory/inhibitory ratio reported in most cortical areas (Supplementary Data 2).”
§ Cell type-specific transcriptional programs in mouse prefrontal cortex during adolescence and addiction > Results > Cellular composition of PFC
plain- Asserted: passes — The authors put it forward as true.
- Checkable: passes — It can be checked against evidence.
- Load-bearing: unclear — It is unclear whether the paper’s conclusions depend on it.
- Based: passes — The paper gives a reason why it holds.
It may state two separate claims as one.
A result the paper reports from its own data — it cites no other source for it, so there is none to check. The quote shows it is in the paper.
In the paper
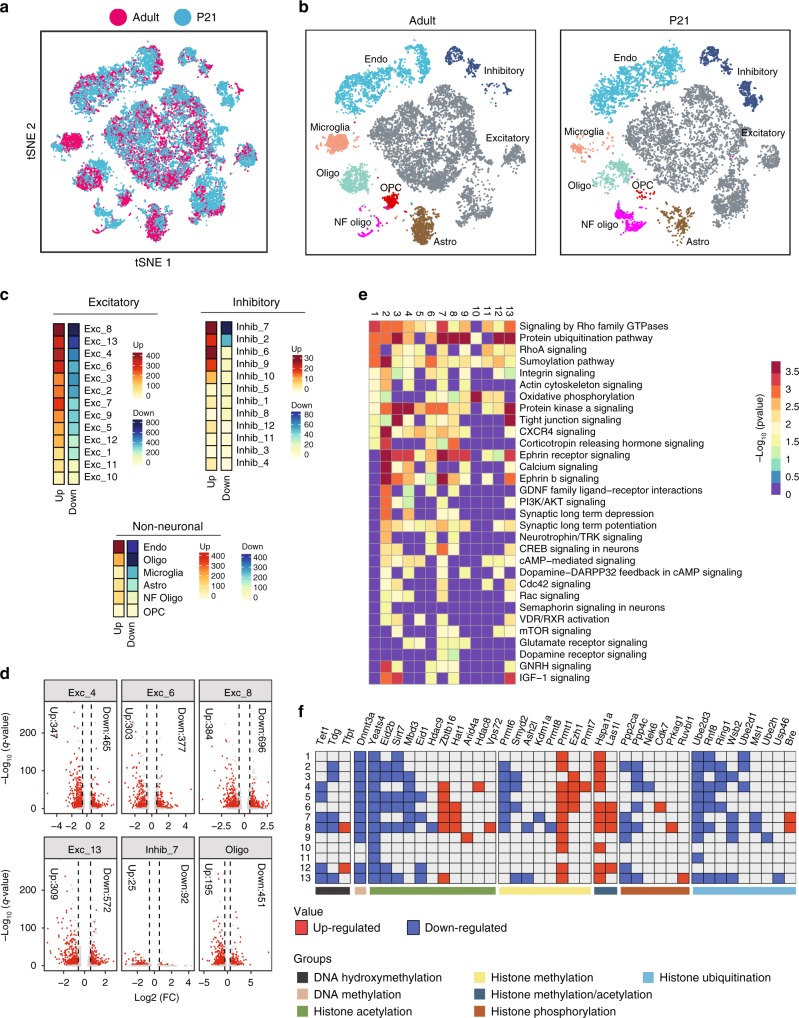
“For example, corticotrophin releasing hormone signaling (known to alter pyramidal neuron excitability29, Exc-1,2,6,7,8) dopamine receptor signaling (Exc-7,8), glutamate receptor signaling (Exc-4,5,7,8,9), CXCR4 signaling (Exc-1 to 9, 13) or IGF-1 signaling (Exc-2,3,6,8,13) selectively impacted only the relevant clusters (Fig. 4e).”
§ Cell type-specific transcriptional programs in mouse prefrontal cortex during adolescence and addiction > Results > Cell type-specific transcriptional changes during adolescence
plaindirect- Asserted: passes — The authors put it forward as true.
- Checkable: passes — It can be checked against evidence.
- Load-bearing: passes — The paper’s conclusions depend on it.
- Based: passes — The paper gives a reason why it holds.
It may state two separate claims as one.
A result the paper reports from its own data — it cites no other source for it, so there is none to check. The quote shows it is in the paper.
In the paper
“Interestingly, even the non-neuronal cells undergo robust changes in transcription, with the highest impact on endothelial cells with 879 genes affected (Fig. 4c).”
§ Cell type-specific transcriptional programs in mouse prefrontal cortex during adolescence and addiction > Results > Cell type-specific transcriptional changes during adolescence
plaincorrelational- Asserted: passes — The authors put it forward as true.
- Checkable: passes — It can be checked against evidence.
- Load-bearing: unclear — It is unclear whether the paper’s conclusions depend on it.
- Based: passes — The paper gives a reason why it holds.
It may state two separate claims as one.
A result the paper reports from its own data — it cites no other source for it, so there is none to check. The quote shows it is in the paper.
In the paper
“Following the same filtering criteria of P60 PFC, we obtained 10,646 high quality (median of 2808 genes and 7384 UMI per-cell) mouse P21 PFC cells.”
§ Cell type-specific transcriptional programs in mouse prefrontal cortex during adolescence and addiction > Results > Cell type-specific transcriptional changes during adolescence
plain- Asserted: passes — The authors put it forward as true.
- Checkable: passes — It can be checked against evidence.
- Load-bearing: fails — The paper’s conclusions may not depend on it.
- Based: passes — The paper gives a reason why it holds.
Probably not a substantial claim. The paper’s conclusions may not depend on it.
The paper states this without a source or data behind it here, so there is nothing to check it against. The quote shows it is in the paper.
In the paper
“Unlike excitatory neurons, inhibitory neurons do not show distinct laminar organization, although some types may be differentially enriched within particular cortical layers.”
§ Cell type-specific transcriptional programs in mouse prefrontal cortex during adolescence and addiction > Results > Molecularly distinct neuronal subtypes in the PFC
hedged- Asserted: passes — The authors put it forward as true.
- Checkable: passes — It can be checked against evidence.
- Load-bearing: unclear — It is unclear whether the paper’s conclusions depend on it.
- Based: passes — The paper gives a reason why it holds.
It may state two separate claims as one.
A result the paper reports from its own data — it cites no other source for it, so there is none to check. The quote shows it is in the paper.
In the paper
“Multi-channel RNA-smFISH revealed that the distinct non-overlapping Pou3f1+ (Exc-10) and Tshz2+ (Exc-12) neurons both express Etv-1, revealing their L5 identity (Fig. 2e).”
§ Cell type-specific transcriptional programs in mouse prefrontal cortex during adolescence and addiction > Results > Molecularly distinct neuronal subtypes in the PFC
plaincorrelational- Asserted: passes — The authors put it forward as true.
- Checkable: passes — It can be checked against evidence.
- Load-bearing: passes — The paper’s conclusions depend on it.
- Based: passes — The paper gives a reason why it holds.
It may state two separate claims as one.
A result the paper reports from its own data — it cites no other source for it, so there is none to check. The quote shows it is in the paper.
In the paper
“Interestingly, across cell types, the highest percentage of affected genes comprised enzymes (~50%), followed by transcription factors (~12–13%) and transporters (Supplementary Fig. 6b).”
§ Cell type-specific transcriptional programs in mouse prefrontal cortex during adolescence and addiction > Results > Cell type-specific transcriptional changes during adolescence
plain- Asserted: passes — The authors put it forward as true.
- Checkable: passes — It can be checked against evidence.
- Load-bearing: unclear — It is unclear whether the paper’s conclusions depend on it.
- Based: passes — The paper gives a reason why it holds.
It may state two separate claims as one.
A result the paper reports from its own data — it cites no other source for it, so there is none to check. The quote shows it is in the paper.
In the paper
“For example, within the excitatory neurons, between 4 (in Exc-10) to 50 (in Exc-8) epigenetic regulators were significantly altered in the various subtypes, with most subtypes having 20–30 epigenetic regulators changed (Supplementary Data 5).”
§ Cell type-specific transcriptional programs in mouse prefrontal cortex during adolescence and addiction > Results > Changes in epigenetic factors during adolescence
plain- Asserted: passes — The authors put it forward as true.
- Checkable: passes — It can be checked against evidence.
- Load-bearing: unclear — It is unclear whether the paper’s conclusions depend on it.
- Based: passes — The paper gives a reason why it holds.
It may state two separate claims as one.
In the paper
“For example, Prmt1, a histone arginine methylase associated with gene activation31, is upregulated in most excitatory neuron subtypes; while Yeats4 and Ube2d3 involved in histone acetylation and ubiquitylation, respectively, are downregulated across most excitatory neuron subtypes (Fig. 4f).”
§ Cell type-specific transcriptional programs in mouse prefrontal cortex during adolescence and addiction > Results > Changes in epigenetic factors during adolescence
What the sources say
- Not checked yetcites [31] Wang, H. et al. Methylation of histone H4 at arginine 3 facilitating transcriptional activation by nuclear hormone receptor. Science 293, 853–857 (2001). source
plaincorrelational- Asserted: passes — The authors put it forward as true.
- Checkable: passes — It can be checked against evidence.
- Load-bearing: unclear — It is unclear whether the paper’s conclusions depend on it.
- Based: passes — The paper gives a reason why it holds.
It may state two separate claims as one.
- Rests on an assumption: Altered histone modifiers can regulate gene expression either positively or negatively.
A result the paper reports from its own data — it cites no other source for it, so there is none to check. The quote shows it is in the paper.
In the paper
“In addition, as many as 646 genes in mature oligodendrocytes, 288 genes in microglia, 268 genes in astrocytes, 209 genes in newly formed oligodendrocytes, and 53 genes in oligodendrocyte precursor were affected (Fig. 4c).”
§ Cell type-specific transcriptional programs in mouse prefrontal cortex during adolescence and addiction > Results > Cell type-specific transcriptional changes during adolescence
plain- Asserted: passes — The authors put it forward as true.
- Checkable: passes — It can be checked against evidence.
- Load-bearing: passes — The paper’s conclusions depend on it.
- Based: passes — The paper gives a reason why it holds.
It may state two separate claims as one.
In the paper
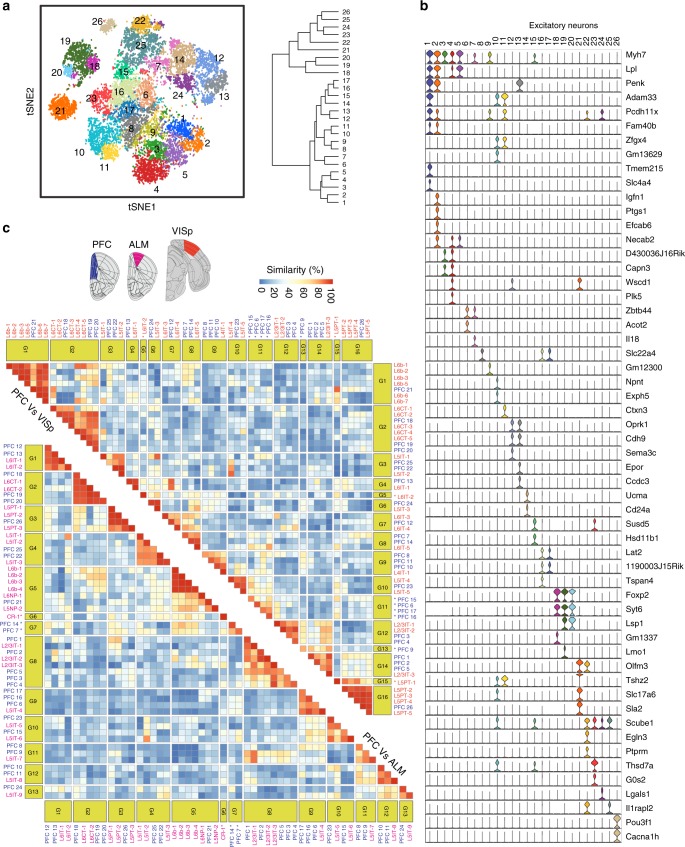
“To enable a better comparison, we first performed a “higher resolution” clustering of the PFC excitatory neurons, which identified 26 distinct subtypes (Fig. 3a), a number comparable to the excitatory neuron subtypes of VISp and ALM reported by Tasic et al.14.”
§ Cell type-specific transcriptional programs in mouse prefrontal cortex during adolescence and addiction > Results > PFC transcriptional features are different from VISp or ALM
What the sources say
- Not checked yetcites Tasic et al.14 Tasic, B. et al. Shared and distinct transcriptomic cell types across neocortical areas. Nature 563, 72–78 (2018). source
plaincorrelational- Asserted: passes — The authors put it forward as true.
- Checkable: passes — It can be checked against evidence.
- Load-bearing: passes — The paper’s conclusions depend on it.
- Based: passes — The paper gives a reason why it holds.
It may state two separate claims as one.
A result the paper reports from its own data — it cites no other source for it, so there is none to check. The quote shows it is in the paper.
In the paper
“While divergent inhibitory neuron populations have been reported in other cortical regions based on different marker combinations14, we detect the distinct populations in PFC and define characteristic regional markers for their identification.”
§ Cell type-specific transcriptional programs in mouse prefrontal cortex during adolescence and addiction > Results > Molecularly distinct neuronal subtypes in the PFC
plain- Asserted: passes — The authors put it forward as true.
- Checkable: passes — It can be checked against evidence.
- Load-bearing: passes — The paper’s conclusions depend on it.
- Based: passes — The paper gives a reason why it holds.
It may state two separate claims as one.
The paper states this without a source or data behind it here, so there is nothing to check it against. The quote shows it is in the paper.
In the paper
“Like most other cortical areas, the inhibitory neurons are present in much lower numbers in the PFC, only accounting for 4.3% of the total PFC cells (at a ratio of 1:12 with excitatory neurons).”
§ Cell type-specific transcriptional programs in mouse prefrontal cortex during adolescence and addiction > Results > Molecularly distinct neuronal subtypes in the PFC
plain- Asserted: passes — The authors put it forward as true.
- Checkable: passes — It can be checked against evidence.
- Load-bearing: fails — The paper’s conclusions may not depend on it.
- Based: passes — The paper gives a reason why it holds.
Probably not a substantial claim. The paper’s conclusions may not depend on it.
A result the paper reports from its own data — it cites no other source for it, so there is none to check. The quote shows it is in the paper.
In the paper
“For example, PFC-9 (G13) or PFC6,15,16,17 (G11) showed no similarity to any VISp subpopulations, although they grouped with L5-IT projection cells in the ALM (Fig. 3c: PFC labeled in blue, VISp red and ALM purple).”
§ Cell type-specific transcriptional programs in mouse prefrontal cortex during adolescence and addiction > Results > PFC transcriptional features are different from VISp or ALM
plain- Asserted: passes — The authors put it forward as true.
- Checkable: passes — It can be checked against evidence.
- Load-bearing: passes — The paper’s conclusions depend on it.
- Based: passes — The paper gives a reason why it holds.
It may state two separate claims as one.
A result the paper reports from its own data — it cites no other source for it, so there is none to check. The quote shows it is in the paper.
In the paper
“Unique markers could be detected for each of the 26 subtypes (Fig. 3b) that showed specific enrichment on the t-SNE plots (Supplementary Fig. 4a) and could be validated histologically from RNA-FISH (Supplementary Fig. 4b).”
§ Cell type-specific transcriptional programs in mouse prefrontal cortex during adolescence and addiction > Results > PFC transcriptional features are different from VISp or ALM
hedgedcorrelational- Asserted: passes — The authors put it forward as true.
- Checkable: passes — It can be checked against evidence.
- Load-bearing: passes — The paper’s conclusions depend on it.
- Based: passes — The paper gives a reason why it holds.
It may state two separate claims as one.
A result the paper reports from its own data — it cites no other source for it, so there is none to check. The quote shows it is in the paper.
In the paper
“Rspo2, a common marker for the G11 members, showed distinctly enriched expression in PFC, but no appreciable signal in VISp (Fig S4c).”
§ Cell type-specific transcriptional programs in mouse prefrontal cortex during adolescence and addiction > Results > PFC transcriptional features are different from VISp or ALM
plain- Asserted: passes — The authors put it forward as true.
- Checkable: passes — It can be checked against evidence.
- Load-bearing: passes — The paper’s conclusions depend on it.
- Based: passes — The paper gives a reason why it holds.
It may state two separate claims as one.
A result the paper reports from its own data — it cites no other source for it, so there is none to check. The quote shows it is in the paper.
In the paper
“Some non-inhibitory neuron populations also appear to express Meis2 (Supplementary Fig. 3c), making Pbx3 a more selective marker.”
§ Cell type-specific transcriptional programs in mouse prefrontal cortex during adolescence and addiction > Results > Molecularly distinct neuronal subtypes in the PFC
hedgedcorrelational- Asserted: passes — The authors put it forward as true.
- Checkable: passes — It can be checked against evidence.
- Load-bearing: unclear — It is unclear whether the paper’s conclusions depend on it.
- Based: passes — The paper gives a reason why it holds.
It may state two separate claims as one.
A result the paper reports from its own data — it cites no other source for it, so there is none to check. The quote shows it is in the paper.
In the paper
“Similarly, PFC clusters 7 and 14 (G7) showed no similarity to the ALM subpopulations but resembled the L6IT-5 (Fig. 3c, Supplementary Data 3).”
§ Cell type-specific transcriptional programs in mouse prefrontal cortex during adolescence and addiction > Results > PFC transcriptional features are different from VISp or ALM
plain- Asserted: passes — The authors put it forward as true.
- Checkable: passes — It can be checked against evidence.
- Load-bearing: passes — The paper’s conclusions depend on it.
- Based: passes — The paper gives a reason why it holds.
It may state two separate claims as one.
A result the paper reports from its own data — it cites no other source for it, so there is none to check. The quote shows it is in the paper.
In the paper
“As expected, the major known inhibitory neuron populations like Sst+, Pavlb+ and Vip+ were detected (Fig. 2g, Supplementary Fig. 3b) and could also be confirmed from RNA-FISH (Supplementary Fig. 3c).”
§ Cell type-specific transcriptional programs in mouse prefrontal cortex during adolescence and addiction > Results > Molecularly distinct neuronal subtypes in the PFC
plain- Asserted: passes — The authors put it forward as true.
- Checkable: passes — It can be checked against evidence.
- Load-bearing: unclear — It is unclear whether the paper’s conclusions depend on it.
- Based: passes — The paper gives a reason why it holds.
It may state two separate claims as one.
A result the paper reports from its own data — it cites no other source for it, so there is none to check. The quote shows it is in the paper.
In the paper
“While most excitatory neuron subtypes of PFC have corresponding cell clusters in VISp or ALM group together, clusters that are unique to PFC do exist.”
§ Cell type-specific transcriptional programs in mouse prefrontal cortex during adolescence and addiction > Results > PFC transcriptional features are different from VISp or ALM
plain- Asserted: passes — The authors put it forward as true.
- Checkable: passes — It can be checked against evidence.
- Load-bearing: passes — The paper’s conclusions depend on it.
- Based: passes — The paper gives a reason why it holds.
It may state two separate claims as one.
A result the paper reports from its own data — it cites no other source for it, so there is none to check. The quote shows it is in the paper.
In the paper
“In summary, using scRNA-seq, we revealed the comprehensive neuronal subtypes comprising the anatomically defined PFC region and their corresponding cortical layer identity.”
§ Cell type-specific transcriptional programs in mouse prefrontal cortex during adolescence and addiction > Results > Molecularly distinct neuronal subtypes in the PFC
plain- Asserted: passes — The authors put it forward as true.
- Checkable: passes — It can be checked against evidence.
- Load-bearing: passes — The paper’s conclusions depend on it.
- Based: passes — The paper gives a reason why it holds.
It may state two separate claims as one.
A result the paper reports from its own data — it cites no other source for it, so there is none to check. The quote shows it is in the paper.
In the paper
“Co-staining for unique markers detected the Exc-10 (Pou3f1+) and Exc-12 (Tshz2+) neurons adjacently within the same layer, while Exc-13 (Foxp2+) neuron cluster was detected mainly in a deeper layer (Fig. 2c).”
§ Cell type-specific transcriptional programs in mouse prefrontal cortex during adolescence and addiction > Results > Molecularly distinct neuronal subtypes in the PFC
plain- Asserted: passes — The authors put it forward as true.
- Checkable: passes — It can be checked against evidence.
- Load-bearing: unclear — It is unclear whether the paper’s conclusions depend on it.
- Based: passes — The paper gives a reason why it holds.
It may state two separate claims as one.
A result the paper reports from its own data — it cites no other source for it, so there is none to check. The quote shows it is in the paper.
In the paper
“Classification revealed 12 clusters (referred as Inhib-1, 2,..12), highlighting functional diversity and specialization (Fig. 2f, Supplementary Fig. 3a).”
§ Cell type-specific transcriptional programs in mouse prefrontal cortex during adolescence and addiction > Results > Molecularly distinct neuronal subtypes in the PFC
plain- Asserted: passes — The authors put it forward as true.
- Checkable: passes — It can be checked against evidence.
- Load-bearing: passes — The paper’s conclusions depend on it.
- Based: passes — The paper gives a reason why it holds.
It may state two separate claims as one.
A result the paper reports from its own data — it cites no other source for it, so there is none to check. The quote shows it is in the paper.
In the paper
“Accordingly, Nnat, a selective marker for G7 is seen enriched in PFC but depleted in ALM (Supplementary Fig. 4d).”
§ Cell type-specific transcriptional programs in mouse prefrontal cortex during adolescence and addiction > Results > PFC transcriptional features are different from VISp or ALM
plaincorrelational- Asserted: passes — The authors put it forward as true.
- Checkable: passes — It can be checked against evidence.
- Load-bearing: unclear — It is unclear whether the paper’s conclusions depend on it.
- Based: passes — The paper gives a reason why it holds.
It may state two separate claims as one.
A result the paper reports from its own data — it cites no other source for it, so there is none to check. The quote shows it is in the paper.
In the paper
“Notably, Exc-4 (Calb1+/Cux2+) and Exc-6 (Calb1−/Cux2+) belong to the superficial layer L2/3. On the other hand, cluster Exc-8 and Exc-13 belong to L5 and L6, respectively (Supplementary Fig. 2d-table).”
§ Cell type-specific transcriptional programs in mouse prefrontal cortex during adolescence and addiction > Results > Cell type-specific transcriptional changes during adolescence
plain- Asserted: passes — The authors put it forward as true.
- Checkable: passes — It can be checked against evidence.
- Load-bearing: unclear — It is unclear whether the paper’s conclusions depend on it.
- Based: passes — The paper gives a reason why it holds.
It may state two separate claims as one.
A result the paper reports from its own data — it cites no other source for it, so there is none to check. The quote shows it is in the paper.
In the paper
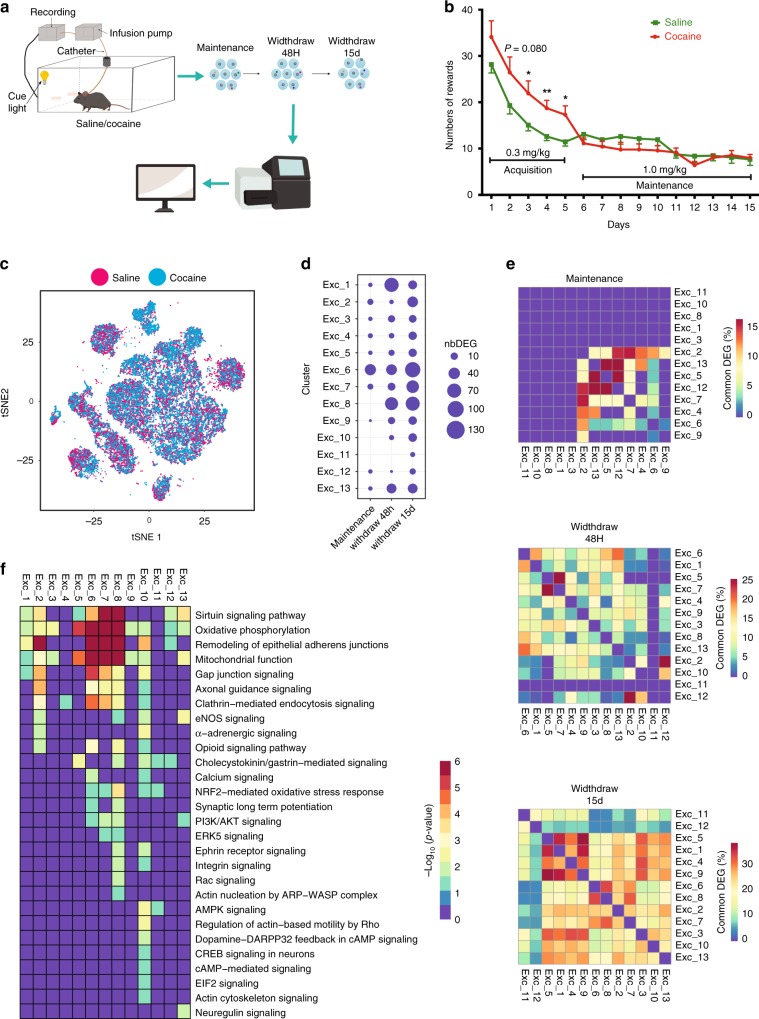
“Effect was smaller at 48 h, but became more pronounced at 15 day with all excitatory subtypes impacted to some degrees.”
§ Cell type-specific transcriptional programs in mouse prefrontal cortex during adolescence and addiction > Results > Cocaine induced cell-type specific transcriptional changes
plaindirect- Asserted: passes — The authors put it forward as true.
- Checkable: passes — It can be checked against evidence.
- Load-bearing: passes — The paper’s conclusions depend on it.
- Based: passes — The paper gives a reason why it holds.
It may state two separate claims as one.
A result the paper reports from its own data — it cites no other source for it, so there is none to check. The quote shows it is in the paper.
In the paper
“Additional pathways that can support plasticity are also affected in subtypes Exc-7 and 8 (example: ephrin, integrin, Rac, Gastrin/Cck and ultimately, even synaptic LTP), suggesting their greater involvement”
§ Cell type-specific transcriptional programs in mouse prefrontal cortex during adolescence and addiction > Results > Cocaine induced cell-type specific transcriptional changes
hedgedcorrelational- Asserted: passes — The authors put it forward as true.
- Checkable: passes — It can be checked against evidence.
- Load-bearing: unclear — It is unclear whether the paper’s conclusions depend on it.
- Based: passes — The paper gives a reason why it holds.
It may state two separate claims as one.
A result the paper reports from its own data — it cites no other source for it, so there is none to check. The quote shows it is in the paper.
In the paper
“Key neuronal functions like axon guidance, gap junction signaling and vesicular trafficking (clathrin mediated endocytosis) are all affected in these five excitatory neuron clusters that can impact structural as well as electrical properties (through gap junction) of synapses.”
§ Cell type-specific transcriptional programs in mouse prefrontal cortex during adolescence and addiction > Results > Cocaine induced cell-type specific transcriptional changes
plaindirect- Asserted: passes — The authors put it forward as true.
- Checkable: passes — It can be checked against evidence.
- Load-bearing: passes — The paper’s conclusions depend on it.
- Based: passes — The paper gives a reason why it holds.
It may state two separate claims as one.
A result the paper reports from its own data — it cites no other source for it, so there is none to check. The quote shows it is in the paper.
In the paper
“At 15 day drug withdrawal, the number of genes affected increased in every single subtype with Exc-2, 6, 7, and 8 showing the greatest effects.”
§ Cell type-specific transcriptional programs in mouse prefrontal cortex during adolescence and addiction > Results > Cocaine induced cell-type specific transcriptional changes
plaindirect- Asserted: passes — The authors put it forward as true.
- Checkable: passes — It can be checked against evidence.
- Load-bearing: passes — The paper’s conclusions depend on it.
- Based: passes — The paper gives a reason why it holds.
It may state two separate claims as one.
A result the paper reports from its own data — it cites no other source for it, so there is none to check. The quote shows it is in the paper.
In the paper
“contrary to neurons, non-neurons were impacted most strongly at 48 h time point and subdued at 15-day in general”
§ Cell type-specific transcriptional programs in mouse prefrontal cortex during adolescence and addiction > Results > Cocaine induced cell-type specific transcriptional changes
plaincorrelational- Asserted: passes — The authors put it forward as true.
- Checkable: passes — It can be checked against evidence.
- Load-bearing: unclear — It is unclear whether the paper’s conclusions depend on it.
- Based: passes — The paper gives a reason why it holds.
It may state two separate claims as one.
A result the paper reports from its own data — it cites no other source for it, so there is none to check. The quote shows it is in the paper.
In the paper
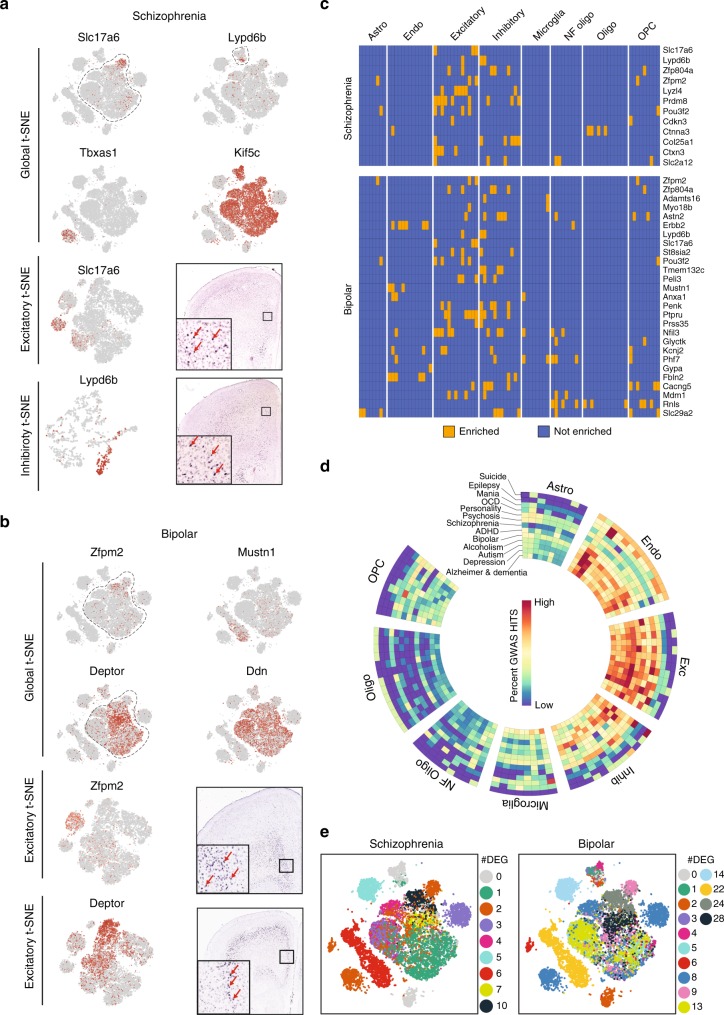
“genes like Adamts16, Myo18b, Astn2, and Erbb2 exhibit cell cluster-specific or enriched expression (Fig. 5c) and are only associated with bipolar, while some other genes, like Zfp804a and Zfpm2, are associated with both.”
§ Cell type-specific transcriptional programs in mouse prefrontal cortex during adolescence and addiction > Results > Selective expression of neuropsychiatric disease genes
plaincorrelational- Asserted: passes — The authors put it forward as true.
- Checkable: passes — It can be checked against evidence.
- Load-bearing: passes — The paper’s conclusions depend on it.
- Based: passes — The paper gives a reason why it holds.
It may state two separate claims as one.
A result the paper reports from its own data — it cites no other source for it, so there is none to check. The quote shows it is in the paper.
In the paper
“in schizophrenia, we found that excitatory neurons are highly affected, with Exc-9 and 11 as the most relevant cells as these cell clusters express the highest number of schizophrenia relevant genes”
§ Cell type-specific transcriptional programs in mouse prefrontal cortex during adolescence and addiction > Results > Selective expression of neuropsychiatric disease genes
plaincorrelational- Asserted: passes — The authors put it forward as true.
- Checkable: passes — It can be checked against evidence.
- Load-bearing: passes — The paper’s conclusions depend on it.
- Based: passes — The paper gives a reason why it holds.
It may state two separate claims as one.
A result the paper reports from its own data — it cites no other source for it, so there is none to check. The quote shows it is in the paper.
In the paper
“A limited impact on non-neuronal populations was also observed, with the endothelial cells most affected, followed by oligodendrocytes.”
§ Cell type-specific transcriptional programs in mouse prefrontal cortex during adolescence and addiction > Results > Cocaine induced cell-type specific transcriptional changes
plain- Asserted: passes — The authors put it forward as true.
- Checkable: passes — It can be checked against evidence.
- Load-bearing: unclear — It is unclear whether the paper’s conclusions depend on it.
- Based: passes — The paper gives a reason why it holds.
It may state two separate claims as one.
A result the paper reports from its own data — it cites no other source for it, so there is none to check. The quote shows it is in the paper.
In the paper
“Exc-6 and Exc-2 are of L2/3 while Exc-8, 7, and 10 are L5”
§ Cell type-specific transcriptional programs in mouse prefrontal cortex during adolescence and addiction > Results > Cocaine induced cell-type specific transcriptional changes
plain- Asserted: passes — The authors put it forward as true.
- Checkable: passes — It can be checked against evidence.
- Load-bearing: passes — The paper’s conclusions depend on it.
- Based: passes — The paper gives a reason why it holds.
It may state two separate claims as one.
A result the paper reports from its own data — it cites no other source for it, so there is none to check. The quote shows it is in the paper.
In the paper
“Exc-1, 8 and 13 were the most strongly induced, while Exc-6 maintained induction”
§ Cell type-specific transcriptional programs in mouse prefrontal cortex during adolescence and addiction > Results > Cocaine induced cell-type specific transcriptional changes
plaindirect- Asserted: passes — The authors put it forward as true.
- Checkable: passes — It can be checked against evidence.
- Load-bearing: passes — The paper’s conclusions depend on it.
- Based: passes — The paper gives a reason why it holds.
It may state two separate claims as one.
A result the paper reports from its own data — it cites no other source for it, so there is none to check. The quote shows it is in the paper.
In the paper
“About 10 or less genes were altered per excitatory neuron subtype (with no change in Exc-8, 10, 11) except Exc-6 where more than 40 genes changed”
§ Cell type-specific transcriptional programs in mouse prefrontal cortex during adolescence and addiction > Results > Cocaine induced cell-type specific transcriptional changes
plaindirect- Asserted: passes — The authors put it forward as true.
- Checkable: passes — It can be checked against evidence.
- Load-bearing: passes — The paper’s conclusions depend on it.
- Based: passes — The paper gives a reason why it holds.
It may state two separate claims as one.
A result the paper reports from its own data — it cites no other source for it, so there is none to check. The quote shows it is in the paper.
In the paper
“for schizophrenia, Exc-13 accounts for the maximum number of differential GWAS candidate genes among the neurons, and the endothelial cells account for the maximum of the non-neuronal cells”
§ Cell type-specific transcriptional programs in mouse prefrontal cortex during adolescence and addiction > Results > Selective expression of neuropsychiatric disease genes
plaincorrelational- Asserted: passes — The authors put it forward as true.
- Checkable: passes — It can be checked against evidence.
- Load-bearing: unclear — It is unclear whether the paper’s conclusions depend on it.
- Based: passes — The paper gives a reason why it holds.
It may state two separate claims as one.
A result the paper reports from its own data — it cites no other source for it, so there is none to check. The quote shows it is in the paper.
In the paper
“A broad impact of cocaine on transcription was observed across PFC, but with selective impacts on different cell populations at different stages”
§ Cell type-specific transcriptional programs in mouse prefrontal cortex during adolescence and addiction > Results > Cocaine induced cell-type specific transcriptional changes
plaindirect- Asserted: passes — The authors put it forward as true.
- Checkable: passes — It can be checked against evidence.
- Load-bearing: passes — The paper’s conclusions depend on it.
- Based: passes — The paper gives a reason why it holds.
It may state two separate claims as one.
A result the paper reports from its own data — it cites no other source for it, so there is none to check. The quote shows it is in the paper.
In the paper
“for bipolar disorder Exc-8 accounts for the most candidates (followed by Exc-13), while endothelial cells for the non-neuronal cells”
§ Cell type-specific transcriptional programs in mouse prefrontal cortex during adolescence and addiction > Results > Selective expression of neuropsychiatric disease genes
plaincorrelational- Asserted: passes — The authors put it forward as true.
- Checkable: passes — It can be checked against evidence.
- Load-bearing: unclear — It is unclear whether the paper’s conclusions depend on it.
- Based: passes — The paper gives a reason why it holds.
It may state two separate claims as one.
A result the paper reports from its own data — it cites no other source for it, so there is none to check. The quote shows it is in the paper.
In the paper
“Compared to the excitatory neurons of VISp and ALM, the PFC has 5 (PFC9, 15, 16, 17) and 2 (PFC7 and 14) unique neuron subtypes respectively (Fig. 3c), which can be identified using distinctive markers (like Nnat or Rspo2)”
§ Cell type-specific transcriptional programs in mouse prefrontal cortex during adolescence and addiction > Discussion
plain- Asserted: passes — The authors put it forward as true.
- Checkable: passes — It can be checked against evidence.
- Load-bearing: passes — The paper’s conclusions depend on it.
- Based: passes — The paper gives a reason why it holds.
It may state two separate claims as one.
The paper states this without a source or data behind it here, so there is nothing to check it against. The quote shows it is in the paper.
In the paper
“the impact is negligible during maintenance and dramatically increases during prolonged drug withdrawal.”
§ Cell type-specific transcriptional programs in mouse prefrontal cortex during adolescence and addiction > Discussion
plaindirect- Asserted: passes — The authors put it forward as true.
- Checkable: passes — It can be checked against evidence.
- Load-bearing: passes — The paper’s conclusions depend on it.
- Based: passes — The paper gives a reason why it holds.
It may state two separate claims as one.
A result the paper reports from its own data — it cites no other source for it, so there is none to check. The quote shows it is in the paper.
In the paper
“The excitatory neurons could be broadly classified into 13 clusters, which could be further separated into 26 clusters with higher resolution.”
§ Cell type-specific transcriptional programs in mouse prefrontal cortex during adolescence and addiction > Discussion
hedged- Asserted: passes — The authors put it forward as true.
- Checkable: passes — It can be checked against evidence.
- Load-bearing: unclear — It is unclear whether the paper’s conclusions depend on it.
- Based: passes — The paper gives a reason why it holds.
It may state two separate claims as one.
The paper states this without a source or data behind it here, so there is nothing to check it against. The quote shows it is in the paper.
In the paper
“transcriptional changes from cocaine-induced plasticity is still significant and impacts multiple neuron subtypes.”
§ Cell type-specific transcriptional programs in mouse prefrontal cortex during adolescence and addiction > Discussion
plaindirect- Asserted: passes — The authors put it forward as true.
- Checkable: passes — It can be checked against evidence.
- Load-bearing: passes — The paper’s conclusions depend on it.
- Based: passes — The paper gives a reason why it holds.
It may state two separate claims as one.
A result the paper reports from its own data — it cites no other source for it, so there is none to check. The quote shows it is in the paper.
In the paper
“using scRNA-seq, we revealed the identity of the many discrete cell types in mouse PFC and defined their unique transcriptional features.”
§ Cell type-specific transcriptional programs in mouse prefrontal cortex during adolescence and addiction > Discussion
plaindirect- Asserted: passes — The authors put it forward as true.
- Checkable: passes — It can be checked against evidence.
- Load-bearing: passes — The paper’s conclusions depend on it.
- Based: passes — The paper gives a reason why it holds.
It may state two separate claims as one.
A result the paper reports from its own data — it cites no other source for it, so there is none to check. The quote shows it is in the paper.
In the paper
“Each subtype regulates a combination of these (few common and many unique), with both activators and repressors.”
§ Cell type-specific transcriptional programs in mouse prefrontal cortex during adolescence and addiction > Discussion
plaindirect- Asserted: passes — The authors put it forward as true.
- Checkable: passes — It can be checked against evidence.
- Load-bearing: passes — The paper’s conclusions depend on it.
- Based: passes — The paper gives a reason why it holds.
It may state two separate claims as one.
A result the paper reports from its own data — it cites no other source for it, so there is none to check. The quote shows it is in the paper.
In the paper
“We demonstrated how widespread transcriptional adaptations occur in each cell type in early postnatal life during spontaneous experience-dependent plasticity, as well as in later life under a compulsive cocaine addiction conditions.”
§ Cell type-specific transcriptional programs in mouse prefrontal cortex during adolescence and addiction > Discussion
boosteddirect- Asserted: passes — The authors put it forward as true.
- Checkable: passes — It can be checked against evidence.
- Load-bearing: passes — The paper’s conclusions depend on it.
- Based: passes — The paper gives a reason why it holds.
It may state two separate claims as one.
A result the paper reports from its own data — it cites no other source for it, so there is none to check. The quote shows it is in the paper.
In the paper
“both subtypes show Drd1 expression and undergo strong transcriptional modulation in subsequent cocaine IVSA experiment”
§ Cell type-specific transcriptional programs in mouse prefrontal cortex during adolescence and addiction > Discussion
boostedcorrelational- Asserted: passes — The authors put it forward as true.
- Checkable: passes — It can be checked against evidence.
- Load-bearing: passes — The paper’s conclusions depend on it.
- Based: passes — The paper gives a reason why it holds.
It may state two separate claims as one.
A result the paper reports from its own data — it cites no other source for it, so there is none to check. The quote shows it is in the paper.
In the paper
“Drd1is also expressed by Exc-12 and 13 (Supplementary Fig. 9e) which are moderately impacted (enrich oxidative phosphorylation or mitochondrial function pathways).”
§ Cell type-specific transcriptional programs in mouse prefrontal cortex during adolescence and addiction > Results > Cocaine induced cell-type specific transcriptional changes
plaincorrelational- Asserted: passes — The authors put it forward as true.
- Checkable: passes — It can be checked against evidence.
- Load-bearing: unclear — It is unclear whether the paper’s conclusions depend on it.
- Based: passes — The paper gives a reason why it holds.
It may state two separate claims as one.
A result the paper reports from its own data — it cites no other source for it, so there is none to check. The quote shows it is in the paper.
In the paper
“some of them (Exc-7, 8, and 13) express dopamine receptor Drd1 (Supplementary Fig. 9e) and may be directly responsive to dopamine released by VTA neurons projecting to PFC.”
§ Cell type-specific transcriptional programs in mouse prefrontal cortex during adolescence and addiction > Discussion
hedgedconditional- Asserted: passes — The authors put it forward as true.
- Checkable: passes — It can be checked against evidence.
- Load-bearing: passes — The paper’s conclusions depend on it.
- Based: passes — The paper gives a reason why it holds.
It may state two separate claims as one.
A result the paper reports from its own data — it cites no other source for it, so there is none to check. The quote shows it is in the paper.
In the paper
“Exc-13 records highest number of altered GWAS candidate genes in schizophrenia (Fig. 5e), and many genes like Hs3tst5 (<−4 fold), Kif5c (<−2 fold) or Wwox (>1.5 fold) are regulated in this subtype during adolescence, suggesting a vulnerable neuron subtype in schizophrenia pathogenesis.”
§ Cell type-specific transcriptional programs in mouse prefrontal cortex during adolescence and addiction > Discussion
hedgedcorrelational- Asserted: passes — The authors put it forward as true.
- Checkable: passes — It can be checked against evidence.
- Load-bearing: passes — The paper’s conclusions depend on it.
- Based: passes — The paper gives a reason why it holds.
It may state two separate claims as one.
A result the paper reports from its own data — it cites no other source for it, so there is none to check. The quote shows it is in the paper.
In the paper
“For some conditions, such as schizophrenia, bipolar disorder or autism, strong influence on excitatory or inhibitory neurons were observed; while for some other disorders (eg. bipolar or Alzheimer’s), non-neuronal cells have equal or even greater contribution”
§ Cell type-specific transcriptional programs in mouse prefrontal cortex during adolescence and addiction > Discussion
plaincorrelational- Asserted: passes — The authors put it forward as true.
- Checkable: passes — It can be checked against evidence.
- Load-bearing: fails — The paper’s conclusions may not depend on it.
- Based: passes — The paper gives a reason why it holds.
Probably not a substantial claim. The paper’s conclusions may not depend on it. It may state two separate claims as one.
In the paper
“Marcksl1, whose expression is dynamically regulated during adolescence (Supplementary Fig. 5a–c), is highly expressed in P21 when key functions involving this gene, such as cytoskeletal regulation, protein kinase C signaling or calmodulin signaling55, are on the rise.”
§ Cell type-specific transcriptional programs in mouse prefrontal cortex during adolescence and addiction > Discussion
What the sources say
- Not checked yetcites [55] El Amri, M., Fitzgerald, U. & Schlosser, G. MARCKS and MARCKS-like proteins in development and regeneration. J. Biomed. Sci. 25, 43 (2018). source
plaincorrelational- Asserted: passes — The authors put it forward as true.
- Checkable: passes — It can be checked against evidence.
- Load-bearing: unclear — It is unclear whether the paper’s conclusions depend on it.
- Based: passes — The paper gives a reason why it holds.
It may state two separate claims as one.
A result the paper reports from its own data — it cites no other source for it, so there is none to check. The quote shows it is in the paper.
In the paper
“our study presents a comprehensive account of the widespread transcriptional dynamics in the postnatal PFC.”
§ Cell type-specific transcriptional programs in mouse prefrontal cortex during adolescence and addiction > Discussion
plain- Asserted: passes — The authors put it forward as true.
- Checkable: fails — It may be too vague to check against evidence.
- Load-bearing: passes — The paper’s conclusions depend on it.
- Based: passes — The paper gives a reason why it holds.
Probably not a substantial claim. It may be too vague to check against evidence.
A result the paper reports from its own data — it cites no other source for it, so there is none to check. The quote shows it is in the paper.
In the paper
“In total, an expression matrix including 20,718 genes and 27,702 cells was used.”
§ Cell type-specific transcriptional programs in mouse prefrontal cortex during adolescence and addiction > Methods > Preprocessing of single-cell gene expression data
plainn = 12- Asserted: passes — The authors put it forward as true.
- Checkable: passes — It can be checked against evidence.
- Load-bearing: fails — The paper’s conclusions may not depend on it.
- Based: passes — The paper gives a reason why it holds.
Probably not a substantial claim. The paper’s conclusions may not depend on it.
A result the paper reports from its own data — it cites no other source for it, so there is none to check. The quote shows it is in the paper.
In the paper
“After clustering and manual assessment of double droplets a total of 24,822 cells were retained (11,886 saline and 12,936 cocaine).”
§ Cell type-specific transcriptional programs in mouse prefrontal cortex during adolescence and addiction > Methods > Preprocessing of single-cell gene expression data
plain- Asserted: passes — The authors put it forward as true.
- Checkable: passes — It can be checked against evidence.
- Load-bearing: fails — The paper’s conclusions may not depend on it.
- Based: passes — The paper gives a reason why it holds.
Probably not a substantial claim. The paper’s conclusions may not depend on it.
None of the sources cited for this claim have been checked yet.
In the paper
“Ptgds upregulated at P60 (Supplementary Fig. 5d), is believed to have neurotrophic function56 and high frontal lobe expression57”
§ Cell type-specific transcriptional programs in mouse prefrontal cortex during adolescence and addiction > Discussion
What the sources say
- Not checked yetcites [56] Tada, K., Murakami, M., Kambe, T. & Kudo, I. Induction of cyclooxygenase-2 by secretory phospholipases A2 in nerve growth factor-stimulated rat serosal mast cells is facilitated by interaction with fibroblasts and mediated by a mechanism independent of their enzymatic functions. J. Immunol. 161, 5008–5015 (1998). source
- Not checked yetcites [57] Unger, T. et al. Transcriptome differences between the frontal cortex and hippocampus of wild-type and humanized presenilin-1 transgenic mice. Am. J. Geriatr. Psychiatry 13, 1041–1051 (2005). source
hedgedcorrelational- Asserted: passes — The authors put it forward as true.
- Checkable: passes — It can be checked against evidence.
- Load-bearing: fails — The paper’s conclusions may not depend on it.
- Based: passes — The paper gives a reason why it holds.
Probably not a substantial claim. The paper’s conclusions may not depend on it. It may state two separate claims as one.
A result the paper reports from its own data — it cites no other source for it, so there is none to check. The quote shows it is in the paper.
In the paper
“After removing low quality cells (<800 detected genes and cells having >10% mitochondria transcriptome) and double-droplet cells, a total of 10,646 high quality cells were obtained from P21 PFC.”
§ Cell type-specific transcriptional programs in mouse prefrontal cortex during adolescence and addiction > Methods > Comparison between PFC cells of P21 and P60 mice
plain- Asserted: passes — The authors put it forward as true.
- Checkable: passes — It can be checked against evidence.
- Load-bearing: passes — The paper’s conclusions depend on it.
- Based: passes — The paper gives a reason why it holds.
Probably not a substantial claim.
None of the sources cited for this claim have been checked yet.
In the paper
“We then analyzed transcriptional dynamics in each of the neuron subtypes between adolescence8,9 (P21) and adulthood (P60) in mouse, a critical postnatal period believed to be associated with greatly increased neuroplasticity, and manifestation of most neuropsychiatric disorders7,10.”
§ Cell type-specific transcriptional programs in mouse prefrontal cortex during adolescence and addiction > Introduction
What the sources say
- Not checked yetcites [7] Nurnberger, J. I., Berrettini, W. & Niculescu, A. B. in The Medical Basis of Psychiatry (eds S. Hossein Fatemi & Paula J. Clayton) 553–600 (Springer New York, 2016). source
- Not checked yetcites [10] Paus, T., Keshavan, M. & Giedd, J. N. Why do many psychiatric disorders emerge during adolescence? Nat. Rev. Neurosci. 9, 947–957 (2008). source
hedgedcorrelational- Asserted: passes — The authors put it forward as true.
- Checkable: passes — It can be checked against evidence.
- Load-bearing: passes — The paper’s conclusions depend on it.
- Based: passes — The paper gives a reason why it holds.
Probably not a substantial claim. It may state two separate claims as one.
In the paper
“The PFC encodes and regulates the highest cognitive functions (such as learning, memory, judgment, decision-making, emotion, risk assessment or social behavior) through dynamic integration of sensory-stimulus-driven inputs from multiple brain regions2.”
§ Cell type-specific transcriptional programs in mouse prefrontal cortex during adolescence and addiction > Introduction
What the sources say
- Not checked yetcites [2] Funahashi, S. & Andreau, J. M. Prefrontal cortex and neural mechanisms of executive function. J. Physiol. Paris 107, 471–482 (2013). source
plaindirect- Asserted: passes — The authors put it forward as true.
- Checkable: passes — It can be checked against evidence.
- Load-bearing: fails — The paper’s conclusions may not depend on it.
- Based: passes — The paper gives a reason why it holds.
Probably not a substantial claim. The paper’s conclusions may not depend on it.
None of the sources cited for this claim have been checked yet.
In the paper
“On the other hand, major emotional or psychological episodes like chronic stress, trauma, drug addiction can alter brain function and behavior even much later in life5,6.”
§ Cell type-specific transcriptional programs in mouse prefrontal cortex during adolescence and addiction > Introduction
What the sources say
- Not checked yetcites [5] McEwen, B. S. & Morrison, J. H. The brain on stress: vulnerability and plasticity of the prefrontal cortex over the life course. Neuron 79, 16–29 (2013). source
- Not checked yetcites [6] Luscher, C. & Malenka, R. C. Drug-evoked synaptic plasticity in addiction: from molecular changes to circuit remodeling. Neuron 69, 650–663 (2011). source
plaindirect- Asserted: passes — The authors put it forward as true.
- Checkable: passes — It can be checked against evidence.
- Load-bearing: passes — The paper’s conclusions depend on it.
- Based: passes — The paper gives a reason why it holds.
Probably not a substantial claim.
In the paper
“Neural activity can induce widespread transcriptional changes in neurons4, which in turn can encrypt structural and/or functional changes in them4.”
§ Cell type-specific transcriptional programs in mouse prefrontal cortex during adolescence and addiction > Introduction
What the sources say
- Not checked yetcites [4] West, A. E. & Greenberg, M. E. Neuronal activity-regulated gene transcription in synapse development and cognitive function. Cold Spring Harb Perspect Biol 3, https://doi.org/10.1101/cshperspect.a005744 (2011). source
plaindirect- Asserted: passes — The authors put it forward as true.
- Checkable: passes — It can be checked against evidence.
- Load-bearing: passes — The paper’s conclusions depend on it.
- Based: passes — The paper gives a reason why it holds.
Probably not a substantial claim. It may state two separate claims as one.
In the paper
“As the site of origin of executive function, the prefrontal cortex (PFC) is a major brain region regulating behavior1.”
§ Cell type-specific transcriptional programs in mouse prefrontal cortex during adolescence and addiction > Introduction
What the sources say
- Not checked yetcites [1] Miller, E. K., Freedman, D. J. & Wallis, J. D. The prefrontal cortex: categories, concepts and cognition. Philos Trans. R. Soc. Lond. B Biol. Sci. 357, 1123–1136 (2002). source
plaindirect- Asserted: passes — The authors put it forward as true.
- Checkable: passes — It can be checked against evidence.
- Load-bearing: fails — The paper’s conclusions may not depend on it.
- Based: passes — The paper gives a reason why it holds.
Probably not a substantial claim. The paper’s conclusions may not depend on it.
None of the sources cited for this claim have been checked yet.
In the paper
“However, profound sensory experiences even in later life can significantly impact circuits, which in turn can recondition behavior5,6.”
§ Cell type-specific transcriptional programs in mouse prefrontal cortex during adolescence and addiction > Introduction
What the sources say
- Not checked yetcites [5] McEwen, B. S. & Morrison, J. H. The brain on stress: vulnerability and plasticity of the prefrontal cortex over the life course. Neuron 79, 16–29 (2013). source
- Not checked yetcites [6] Luscher, C. & Malenka, R. C. Drug-evoked synaptic plasticity in addiction: from molecular changes to circuit remodeling. Neuron 69, 650–663 (2011). source
plaindirect- Asserted: passes — The authors put it forward as true.
- Checkable: passes — It can be checked against evidence.
- Load-bearing: fails — The paper’s conclusions may not depend on it.
- Based: passes — The paper gives a reason why it holds.
Probably not a substantial claim. The paper’s conclusions may not depend on it. It may state two separate claims as one.
In the paper
“In parallel, to understand transcriptional changes during induced plasticity in the mature brain, we analyzed volitional drug-intake using the cocaine intra-venous self-administration (IVSA) model11, a gold standard in addiction studies.”
§ Cell type-specific transcriptional programs in mouse prefrontal cortex during adolescence and addiction > Introduction
What the sources say
- Not checked yetcites [11] Kmiotek, E. K., Baimel, C. & Gill, K. J. Methods for intravenous self administration in a mouse model. J. Vis. Exp., e3739, https://doi.org/10.3791/3739 (2012). source
boosted- Asserted: passes — The authors put it forward as true.
- Checkable: passes — It can be checked against evidence.
- Load-bearing: fails — The paper’s conclusions may not depend on it.
- Based: passes — The paper gives a reason why it holds.
Probably not a substantial claim. The paper’s conclusions may not depend on it.
In the paper
“For example, several genetic aberrations can affect early life PFC development leading to psychiatric disorders such as schizophrenia, bipolar disorder, chronic depression, mania, or personality disorders7.”
§ Cell type-specific transcriptional programs in mouse prefrontal cortex during adolescence and addiction > Introduction
What the sources say
- Not checked yetcites [7] Nurnberger, J. I., Berrettini, W. & Niculescu, A. B. in The Medical Basis of Psychiatry (eds S. Hossein Fatemi & Paula J. Clayton) 553–600 (Springer New York, 2016). source
plaindirect- Asserted: passes — The authors put it forward as true.
- Checkable: passes — It can be checked against evidence.
- Load-bearing: fails — The paper’s conclusions may not depend on it.
- Based: passes — The paper gives a reason why it holds.
Probably not a substantial claim. The paper’s conclusions may not depend on it.
In the paper
“To sustain this dynamic experience-dependent neuroplasticity, the PFC, unlike any other brain region, continues to develop significantly during postnatal life, and retains a certain degree of plasticity lifelong3.”
§ Cell type-specific transcriptional programs in mouse prefrontal cortex during adolescence and addiction > Introduction
What the sources say
- Not checked yetcites [3] Kolb, B. et al. Experience and the developing prefrontal cortex. Proc. Natl Acad. Sci. USA 109(Suppl 2), 17186–17193 (2012). source
plain- Asserted: passes — The authors put it forward as true.
- Checkable: passes — It can be checked against evidence.
- Load-bearing: passes — The paper’s conclusions depend on it.
- Based: passes — The paper gives a reason why it holds.
Probably not a substantial claim. It may state two separate claims as one.
In the paper
“Developmentally, Sst+and Pavlb+ originate from the medial ganglionic eminence (MGE), while the Vip+ originate from the caudal ganglionic eminence (CGE)15.”
§ Cell type-specific transcriptional programs in mouse prefrontal cortex during adolescence and addiction > Results > Molecularly distinct neuronal subtypes in the PFC
What the sources say
- Not checked yetcites [15] Mayer, C. et al. Developmental diversification of cortical inhibitory interneurons. Nature 555, 457–462 (2018). source
plaindirect- Asserted: passes — The authors put it forward as true.
- Checkable: passes — It can be checked against evidence.
- Load-bearing: fails — The paper’s conclusions may not depend on it.
- Based: passes — The paper gives a reason why it holds.
Probably not a substantial claim. The paper’s conclusions may not depend on it. It may state two separate claims as one.
In the paper
“We realized that many of these altered genes are members of the 68 known epigenetic regulatory complexes30, which have well-defined roles in transcription activation or repression.”
§ Cell type-specific transcriptional programs in mouse prefrontal cortex during adolescence and addiction > Results > Changes in epigenetic factors during adolescence
What the sources say
- Not checked yetcites [30] Medvedeva, Y. A. et al. EpiFactors: a comprehensive database of human epigenetic factors and complexes. Database 2015, bav067–bav067 (2015). source
plaincorrelational- Asserted: passes — The authors put it forward as true.
- Checkable: passes — It can be checked against evidence.
- Load-bearing: unclear — It is unclear whether the paper’s conclusions depend on it.
- Based: passes — The paper gives a reason why it holds.
It may state two separate claims as one.
A conclusion the paper draws from its own results — it cites no other source for it, so there is none to check. The quote shows it is in the paper.
In the paper
“Not surprisingly, all these functions together contribute to long term potentiation or synaptic plasticity in many neuron subtypes (Fig. 4e), consistent with the hypothesis of increased neuroplasticity during adolescence.”
§ Cell type-specific transcriptional programs in mouse prefrontal cortex during adolescence and addiction > Results > Cell type-specific transcriptional changes during adolescence
plaindirect- Asserted: passes — The authors put it forward as true.
- Checkable: passes — It can be checked against evidence.
- Load-bearing: passes — The paper’s conclusions depend on it.
- Based: passes — The paper gives a reason why it holds.
It may state two separate claims as one.
A conclusion the paper draws from its own results — it cites no other source for it, so there is none to check. The quote shows it is in the paper.
In the paper
“Collectively, our comparative transcriptome analysis suggests that selective transcriptional programs operate in each PFC cell subtype during adolescence, driving some broad and some highly specific pathways that facilitate the adaptive transition of the PFC, which likely contribute to proper behavioral programing.”
§ Cell type-specific transcriptional programs in mouse prefrontal cortex during adolescence and addiction > Results > Cell type-specific transcriptional changes during adolescence
hedgedconditional- Asserted: passes — The authors put it forward as true.
- Checkable: passes — It can be checked against evidence.
- Load-bearing: passes — The paper’s conclusions depend on it.
- Based: passes — The paper gives a reason why it holds.
It may state two separate claims as one.
In the paper
“Previous studies have demonstrated that different PFC layers are involved in different neuronal functions13.”
§ Cell type-specific transcriptional programs in mouse prefrontal cortex during adolescence and addiction > Results > Molecularly distinct neuronal subtypes in the PFC
What the sources say
- Not checked yetcites [13] Shipp, S. Structure and function of the cerebral cortex. Curr. Biol.: CB 17, R443–R449 (2007). source
boostedcorrelational- Asserted: passes — The authors put it forward as true.
- Checkable: passes — It can be checked against evidence.
- Load-bearing: fails — The paper’s conclusions may not depend on it.
- Based: passes — The paper gives a reason why it holds.
Probably not a substantial claim. The paper’s conclusions may not depend on it.
A conclusion the paper draws from its own results — it cites no other source for it, so there is none to check. The quote shows it is in the paper.
In the paper
“Therefore, while transcription is significantly altered in all excitatory neurons, different subtypes in each layer are impacted to a different degree (Fig. 4c, d, Supplementary Fig. 6a).”
§ Cell type-specific transcriptional programs in mouse prefrontal cortex during adolescence and addiction > Results > Cell type-specific transcriptional changes during adolescence
plaincorrelational- Asserted: passes — The authors put it forward as true.
- Checkable: passes — It can be checked against evidence.
- Load-bearing: passes — The paper’s conclusions depend on it.
- Based: passes — The paper gives a reason why it holds.
It may state two separate claims as one.
In the paper
“Adolescence marks one of the most dynamic phases of experience-dependent plasticity in the PFC8.”
§ Cell type-specific transcriptional programs in mouse prefrontal cortex during adolescence and addiction > Results > Cell type-specific transcriptional changes during adolescence
What the sources say
- Not checked yetcites [8] Selemon, L. D. A role for synaptic plasticity in the adolescent development of executive function. Transl. Psychiatry 3, e238 (2013). source
plain- Asserted: passes — The authors put it forward as true.
- Checkable: passes — It can be checked against evidence.
- Load-bearing: fails — The paper’s conclusions may not depend on it.
- Based: passes — The paper gives a reason why it holds.
Probably not a substantial claim. The paper’s conclusions may not depend on it.
What the paper did — it cites no source for this, so there is none to check. The quote shows it is in the paper.
In the paper
“Indeed, broad expression of Reln in coronal sections within PFC can be confirmed from RNA-FISH (Supplementary Fig. 3c).”
§ Cell type-specific transcriptional programs in mouse prefrontal cortex during adolescence and addiction > Results > Molecularly distinct neuronal subtypes in the PFC
plain- Asserted: passes — The authors put it forward as true.
- Checkable: passes — It can be checked against evidence.
- Load-bearing: fails — The paper’s conclusions may not depend on it.
- Based: passes — The paper gives a reason why it holds.
Probably not a substantial claim. The paper’s conclusions may not depend on it.
A conclusion the paper draws from its own results — it cites no other source for it, so there is none to check. The quote shows it is in the paper.
In the paper
“Thus, layer properties confer further identity to each subtype, which provides a foundation for understanding cell cluster-specific function.”
§ Cell type-specific transcriptional programs in mouse prefrontal cortex during adolescence and addiction > Results > Molecularly distinct neuronal subtypes in the PFC
plaindirect- Asserted: passes — The authors put it forward as true.
- Checkable: passes — It can be checked against evidence.
- Load-bearing: passes — The paper’s conclusions depend on it.
- Based: passes — The paper gives a reason why it holds.
It may state two separate claims as one.
A conclusion the paper draws from its own results — it cites no other source for it, so there is none to check. The quote shows it is in the paper.
In the paper
“These results indicate that PFC has neuron populations that are transcriptionally distinct from its closest (ALM), as well as farthest (VISp) neighbors, which may explain unique functions of the PFC compared to the other cortical regions.”
§ Cell type-specific transcriptional programs in mouse prefrontal cortex during adolescence and addiction > Results > PFC transcriptional features are different from VISp or ALM
hedgedconditional- Asserted: passes — The authors put it forward as true.
- Checkable: passes — It can be checked against evidence.
- Load-bearing: passes — The paper’s conclusions depend on it.
- Based: passes — The paper gives a reason why it holds.
It may state two separate claims as one.
A conclusion the paper draws from its own results — it cites no other source for it, so there is none to check. The quote shows it is in the paper.
In the paper
“Cumulatively, these pathways facilitate functions like membrane protrusion, ruffling, adherence, and neurite/dendrite growth that are pivotal for structural changes in synapses, dendrites and axons: implying extensive structural plasticity (or modifications) in most excitatory populations20–24.”
§ Cell type-specific transcriptional programs in mouse prefrontal cortex during adolescence and addiction > Results > Cell type-specific transcriptional changes during adolescence
hedgeddirect- Asserted: passes — The authors put it forward as true.
- Checkable: passes — It can be checked against evidence.
- Load-bearing: passes — The paper’s conclusions depend on it.
- Based: passes — The paper gives a reason why it holds.
It may state two separate claims as one.
In the paper
“consistent with prior knowledge that formation and migration of different cell types in cortex is complete by this time19.”
§ Cell type-specific transcriptional programs in mouse prefrontal cortex during adolescence and addiction > Results > Cell type-specific transcriptional changes during adolescence
What the sources say
- Not checked yetcites [19] Loo, L. et al. Single-cell transcriptomic analysis of mouse neocortical development. Nat. Commun. 10, 134 (2019). source
boosted- Asserted: passes — The authors put it forward as true.
- Checkable: passes — It can be checked against evidence.
- Load-bearing: fails — The paper’s conclusions may not depend on it.
- Based: passes — The paper gives a reason why it holds.
Probably not a substantial claim. The paper’s conclusions may not depend on it.
A conclusion the paper draws from its own results — it cites no other source for it, so there is none to check. The quote shows it is in the paper.
In the paper
“Overall, these analyses revealed that PFC neurons have very distinct transcriptional properties relative to other cortical regions, which may underlie their unique functional abilities for dynamic integration of varied convergent signals, or their sustained postnatal neuroplasticity/adaptability.”
§ Cell type-specific transcriptional programs in mouse prefrontal cortex during adolescence and addiction > Results > PFC transcriptional features are different from VISp or ALM
hedgedconditional- Asserted: passes — The authors put it forward as true.
- Checkable: passes — It can be checked against evidence.
- Load-bearing: passes — The paper’s conclusions depend on it.
- Based: passes — The paper gives a reason why it holds.
It may state two separate claims as one.
In the paper
“For example, L2/3 are largely involved in intra-cortical (cortico-cortical) regulations, while L5 sends long distance projections outside cortex and L6 receives subcortical inputs (e.g., from thalamus) and projects to superficial layers13.”
§ Cell type-specific transcriptional programs in mouse prefrontal cortex during adolescence and addiction > Results > Molecularly distinct neuronal subtypes in the PFC
What the sources say
- Not checked yetcites [13] Shipp, S. Structure and function of the cerebral cortex. Curr. Biol.: CB 17, R443–R449 (2007). source
boostedcorrelational- Asserted: passes — The authors put it forward as true.
- Checkable: passes — It can be checked against evidence.
- Load-bearing: fails — The paper’s conclusions may not depend on it.
- Based: passes — The paper gives a reason why it holds.
Probably not a substantial claim. The paper’s conclusions may not depend on it. It may state two separate claims as one.
What the paper did — it cites no source for this, so there is none to check. The quote shows it is in the paper.
In the paper
“Comparable cell numbers and data quality were obtained from both saline (11,886 cells) and cocaine (12,936 cells) groups”
§ Cell type-specific transcriptional programs in mouse prefrontal cortex during adolescence and addiction > Results > Cocaine induced cell-type specific transcriptional changes
plain- Asserted: passes — The authors put it forward as true.
- Checkable: passes — It can be checked against evidence.
- Load-bearing: passes — The paper’s conclusions depend on it.
- Based: passes — The paper gives a reason why it holds.
It may state two separate claims as one.
None of the sources cited for this claim have been checked yet.
In the paper
“Dysfunction of this complex has been associated with autism33, and H4K16 acetylation by this complex is associated with brain aging34.”
§ Cell type-specific transcriptional programs in mouse prefrontal cortex during adolescence and addiction > Results > Changes in epigenetic factors during adolescence
What the sources say
- Not checked yetcites [33] Bernier, R. et al. Disruptive CHD8 mutations define a subtype of autism early in development. Cell 158, 263–276 (2014). source
- Not checked yetcites [34] Jun, G. et al. A novel Alzheimer disease locus located near the gene encoding tau protein. Mol. psychiatry 21, 108–117 (2016). source
plaincorrelational- Asserted: passes — The authors put it forward as true.
- Checkable: passes — It can be checked against evidence.
- Load-bearing: fails — The paper’s conclusions may not depend on it.
- Based: passes — The paper gives a reason why it holds.
Probably not a substantial claim. The paper’s conclusions may not depend on it. It may state two separate claims as one.
In the paper
“induced plasticity under psychological, emotional or stressful conditions like PTSD, depression, social isolation or drug addiction is believed to elicit significant cellular re-adaptations in PFC leading to long term behavioral changes5.”
§ Cell type-specific transcriptional programs in mouse prefrontal cortex during adolescence and addiction > Results > Cocaine induced cell-type specific transcriptional changes
What the sources say
- Not checked yetcites [5] McEwen, B. S. & Morrison, J. H. The brain on stress: vulnerability and plasticity of the prefrontal cortex over the life course. Neuron 79, 16–29 (2013). source
hedgeddirect- Asserted: passes — The authors put it forward as true.
- Checkable: passes — It can be checked against evidence.
- Load-bearing: passes — The paper’s conclusions depend on it.
- Based: passes — The paper gives a reason why it holds.
Probably not a substantial claim.
What the paper did — it cites no source for this, so there is none to check. The quote shows it is in the paper.
In the paper
“these observations are limited by the low abundance of the inhibitory cell populations and are consequently difficult to interpret.”
§ Cell type-specific transcriptional programs in mouse prefrontal cortex during adolescence and addiction > Results > Cocaine induced cell-type specific transcriptional changes
plaindirect- Asserted: passes — The authors put it forward as true.
- Checkable: passes — It can be checked against evidence.
- Load-bearing: fails — The paper’s conclusions may not depend on it.
- Based: passes — The paper gives a reason why it holds.
Probably not a substantial claim. The paper’s conclusions may not depend on it.
None of the sources cited for this claim have been checked yet.
In the paper
“Oxidative phosphorylation is pivotal in fueling pre- and post-synaptic processing45, whose alteration impacts mitochondrial function, which in turn affects the sirtuin pathway46.”
§ Cell type-specific transcriptional programs in mouse prefrontal cortex during adolescence and addiction > Results > Cocaine induced cell-type specific transcriptional changes
What the sources say
- Not checked yetcites [45] Hall, C. N., Klein-Flugge, M. C., Howarth, C. & Attwell, D. Oxidative phosphorylation, not glycolysis, powers presynaptic and postsynaptic mechanisms underlying brain information processing. J. Neurosci. 32, 8940–8951 (2012). source
- Not checked yetcites [46] Verdin, E., Hirschey, M. D., Finley, L. W. & Haigis, M. C. Sirtuin regulation of mitochondria: energy production, apoptosis, and signaling. Trends Biochem. Sci. 35, 669–675 (2010). source
plaindirect- Asserted: passes — The authors put it forward as true.
- Checkable: passes — It can be checked against evidence.
- Load-bearing: unclear — It is unclear whether the paper’s conclusions depend on it.
- Based: passes — The paper gives a reason why it holds.
It may state two separate claims as one.
A conclusion the paper draws from its own results — it cites no other source for it, so there is none to check. The quote shows it is in the paper.
In the paper
“many relevant genes exhibit cell type-specific expression for each disease, providing higher specificity for both diagnosis and treatment.”
§ Cell type-specific transcriptional programs in mouse prefrontal cortex during adolescence and addiction > Results > Selective expression of neuropsychiatric disease genes
plaindirect- Asserted: passes — The authors put it forward as true.
- Checkable: passes — It can be checked against evidence.
- Load-bearing: passes — The paper’s conclusions depend on it.
- Based: passes — The paper gives a reason why it holds.
It may state two separate claims as one.
A conclusion the paper draws from its own results — it cites no other source for it, so there is none to check. The quote shows it is in the paper.
In the paper
“This is a fundamental difference from adaptive neuroplasticity of adolescence, where structural changes in neurons/synapses appear to play a more predominant role in neuroadaptation with altered oxidative phosphorylation, although affected, play a secondary role”
§ Cell type-specific transcriptional programs in mouse prefrontal cortex during adolescence and addiction > Results > Cocaine induced cell-type specific transcriptional changes
hedgedcorrelational- Asserted: passes — The authors put it forward as true.
- Checkable: passes — It can be checked against evidence.
- Load-bearing: passes — The paper’s conclusions depend on it.
- Based: passes — The paper gives a reason why it holds.
It may state two separate claims as one.
In the paper
“schizophrenia and bipolar disorder, two major PFC-related disorders, share highly similar behavioral features and are often difficult to diagnose or treat differentially42.”
§ Cell type-specific transcriptional programs in mouse prefrontal cortex during adolescence and addiction > Results > Selective expression of neuropsychiatric disease genes
What the sources say
- Not checked yetcites [42] Altamura, A. C. & Goikolea, J. M. Differential diagnoses and management strategies in patients with schizophrenia and bipolar disorder. Neuropsychiatr. Dis. Treat. 4, 311–317 (2008). source
plaincorrelational- Asserted: passes — The authors put it forward as true.
- Checkable: passes — It can be checked against evidence.
- Load-bearing: passes — The paper’s conclusions depend on it.
- Based: passes — The paper gives a reason why it holds.
Probably not a substantial claim. It may state two separate claims as one.
In the paper
“transcriptional plasticity during this period is believed to play a key role in disease pathogenesis10.”
§ Cell type-specific transcriptional programs in mouse prefrontal cortex during adolescence and addiction > Results > Selective expression of neuropsychiatric disease genes
What the sources say
- Not checked yetcites [10] Paus, T., Keshavan, M. & Giedd, J. N. Why do many psychiatric disorders emerge during adolescence? Nat. Rev. Neurosci. 9, 947–957 (2008). source
hedgedconditional- Asserted: passes — The authors put it forward as true.
- Checkable: passes — It can be checked against evidence.
- Load-bearing: passes — The paper’s conclusions depend on it.
- Based: passes — The paper gives a reason why it holds.
Probably not a substantial claim.
In the paper
“progressive engagement of the deeper PFC layers (L5-6) upon withdrawal might explain psychomotor aspects of drug withdrawal and would be consistent with symptoms seen in humans44.”
§ Cell type-specific transcriptional programs in mouse prefrontal cortex during adolescence and addiction > Results > Cocaine induced cell-type specific transcriptional changes
What the sources say
- Not checked yetcites [44] Donroe, J. H. & Tetrault, J. M. Substance use, intoxication, and withdrawal in the critical care setting. Crit. Care Clin. 33, 543–558 (2017). source
hedgedconditional- Asserted: passes — The authors put it forward as true.
- Checkable: passes — It can be checked against evidence.
- Load-bearing: passes — The paper’s conclusions depend on it.
- Based: passes — The paper gives a reason why it holds.
It may state two separate claims as one.
A conclusion the paper draws from its own results — it cites no other source for it, so there is none to check. The quote shows it is in the paper.
In the paper
“These broadly expressed genes often comprise enzymes, metabolic or cytoskeletal regulators essential for general cellular functions.”
§ Cell type-specific transcriptional programs in mouse prefrontal cortex during adolescence and addiction > Results > Selective expression of neuropsychiatric disease genes
plaincorrelational- Asserted: passes — The authors put it forward as true.
- Checkable: passes — It can be checked against evidence.
- Load-bearing: fails — The paper’s conclusions may not depend on it.
- Based: passes — The paper gives a reason why it holds.
Probably not a substantial claim. The paper’s conclusions may not depend on it.
In the paper
“we chose cocaine self-administration11, a well-established drug addiction model.”
§ Cell type-specific transcriptional programs in mouse prefrontal cortex during adolescence and addiction > Results > Cocaine induced cell-type specific transcriptional changes
What the sources say
- Not checked yetcites [11] Kmiotek, E. K., Baimel, C. & Gill, K. J. Methods for intravenous self administration in a mouse model. J. Vis. Exp., e3739, https://doi.org/10.3791/3739 (2012). source
boosted- Asserted: passes — The authors put it forward as true.
- Checkable: passes — It can be checked against evidence.
- Load-bearing: fails — The paper’s conclusions may not depend on it.
- Based: passes — The paper gives a reason why it holds.
Probably not a substantial claim. The paper’s conclusions may not depend on it.
In the paper
“Likewise, downregulation of Mbd3 (Fig. 4f), a component of the NuRD complex (Supplementary Fig. 6c), can prevent deacetylation to promote transcription36.”
§ Cell type-specific transcriptional programs in mouse prefrontal cortex during adolescence and addiction > Results > Changes in epigenetic factors during adolescence
What the sources say
- Not checked yetcites [36] Saito, M. & Ishikawa, F. The mCpG-binding domain of human MBD3 does not bind to mCpG but interacts with NuRD/Mi2 components HDAC1 and MTA2. J. Biol. Chem. 277, 35434–35439 (2002). source
plaindirect- Asserted: passes — The authors put it forward as true.
- Checkable: passes — It can be checked against evidence.
- Load-bearing: fails — The paper’s conclusions may not depend on it.
- Based: passes — The paper gives a reason why it holds.
Probably not a substantial claim. The paper’s conclusions may not depend on it.
A conclusion the paper draws from its own results — it cites no other source for it, so there is none to check. The quote shows it is in the paper.
In the paper
“it likely indicates that neural regulation (transcriptional) during maintenance is largely operated by the basal ganglia, and only withdrawal induces greater cortical involvement.”
§ Cell type-specific transcriptional programs in mouse prefrontal cortex during adolescence and addiction > Results > Cocaine induced cell-type specific transcriptional changes
hedgeddirect- Asserted: passes — The authors put it forward as true.
- Checkable: passes — It can be checked against evidence.
- Load-bearing: passes — The paper’s conclusions depend on it.
- Based: unclear — It is unclear why the paper says it holds.
It may state two separate claims as one.
In the paper
“Many neuropsychiatric disorders have been linked to genetic mutations and impaired gene expression7.”
§ Cell type-specific transcriptional programs in mouse prefrontal cortex during adolescence and addiction > Results > Selective expression of neuropsychiatric disease genes
What the sources say
- Not checked yetcites [7] Nurnberger, J. I., Berrettini, W. & Niculescu, A. B. in The Medical Basis of Psychiatry (eds S. Hossein Fatemi & Paula J. Clayton) 553–600 (Springer New York, 2016). source
plaincorrelational- Asserted: passes — The authors put it forward as true.
- Checkable: passes — It can be checked against evidence.
- Load-bearing: fails — The paper’s conclusions may not depend on it.
- Based: passes — The paper gives a reason why it holds.
Probably not a substantial claim. The paper’s conclusions may not depend on it. It may state two separate claims as one.
The paper states this without a source or data behind it here, so there is nothing to check it against. The quote shows it is in the paper.
In the paper
“upregulation of pathways like sirtuin signaling, mitochondrial function and oxidative phosphorylation also contribute to neuronal stress.”
§ Cell type-specific transcriptional programs in mouse prefrontal cortex during adolescence and addiction > Discussion
plaindirect- Asserted: passes — The authors put it forward as true.
- Checkable: passes — It can be checked against evidence.
- Load-bearing: fails — The paper’s conclusions may not depend on it.
- Based: fails — The paper may give no reason why it holds.
Probably not a substantial claim. The paper’s conclusions may not depend on it. The paper may give no reason why it holds.
A conclusion the paper draws from its own results — it cites no other source for it, so there is none to check. The quote shows it is in the paper.
In the paper
“In general, our results are consistent with these observations.”
§ Cell type-specific transcriptional programs in mouse prefrontal cortex during adolescence and addiction > Discussion
hedged- Asserted: passes — The authors put it forward as true.
- Checkable: passes — It can be checked against evidence.
- Load-bearing: fails — The paper’s conclusions may not depend on it.
- Based: passes — The paper gives a reason why it holds.
Probably not a substantial claim. The paper’s conclusions may not depend on it.
What the paper did — it cites no source for this, so there is none to check. The quote shows it is in the paper.
In the paper
“While excitatory neurons show more widespread changes than inhibitory neurons, the lower abundance of the later underpowering the differential gene expression analysis cannot be fully omitted as a possibility.”
§ Cell type-specific transcriptional programs in mouse prefrontal cortex during adolescence and addiction > Discussion
hedgedconditional- Asserted: passes — The authors put it forward as true.
- Checkable: passes — It can be checked against evidence.
- Load-bearing: passes — The paper’s conclusions depend on it.
- Based: passes — The paper gives a reason why it holds.
It may state two separate claims as one.
A conclusion the paper draws from its own results — it cites no other source for it, so there is none to check. The quote shows it is in the paper.
In the paper
“it is likely that one or more of these PFC neuron subtypes (5 out of 13 excitatory) respond to dopamine released from midbrain projections and participate in reward processing in conjunction with regions like the VTA and NAc.”
§ Cell type-specific transcriptional programs in mouse prefrontal cortex during adolescence and addiction > Results > Cocaine induced cell-type specific transcriptional changes
hedgedconditional- Asserted: passes — The authors put it forward as true.
- Checkable: passes — It can be checked against evidence.
- Load-bearing: passes — The paper’s conclusions depend on it.
- Based: passes — The paper gives a reason why it holds.
It may state two separate claims as one.
A conclusion the paper draws from its own results — it cites no other source for it, so there is none to check. The quote shows it is in the paper.
In the paper
“these cocaine-taking associated transcriptome changes provide supporting evidence that cocaine-taking does have an impact on the transcriptome of the adult PFC and that the impact could be variable across different neuron sub-types.”
§ Cell type-specific transcriptional programs in mouse prefrontal cortex during adolescence and addiction > Discussion
hedgeddirect- Asserted: passes — The authors put it forward as true.
- Checkable: passes — It can be checked against evidence.
- Load-bearing: passes — The paper’s conclusions depend on it.
- Based: passes — The paper gives a reason why it holds.
It may state two separate claims as one.
A conclusion the paper draws from its own results — it cites no other source for it, so there is none to check. The quote shows it is in the paper.
In the paper
“A patient with a particular disorder can be diagnosed based on the specific disease-related mutation identified by sequencing of genomic DNA isolated from blood sample or oral swab.”
§ Cell type-specific transcriptional programs in mouse prefrontal cortex during adolescence and addiction > Discussion
plaindirect- Asserted: passes — The authors put it forward as true.
- Checkable: passes — It can be checked against evidence.
- Load-bearing: fails — The paper’s conclusions may not depend on it.
- Based: fails — The paper may give no reason why it holds.
Probably not a substantial claim. The paper’s conclusions may not depend on it. The paper may give no reason why it holds.
In the paper
“That cocaine alters oxidative phosphorylation and other metabolic parameters in PFC has been observed in prior human studies53, we reveal that this function is altered only in specific cell types.”
§ Cell type-specific transcriptional programs in mouse prefrontal cortex during adolescence and addiction > Discussion
What the sources say
- Not checked yetcites [53] Lehrmann, E. et al. Transcriptional profiling in the human prefrontal cortex: evidence for two activational states associated with cocaine abuse. Pharm. J. 3, 27–40 (2003).
plaindirect- Asserted: passes — The authors put it forward as true.
- Checkable: passes — It can be checked against evidence.
- Load-bearing: unclear — It is unclear whether the paper’s conclusions depend on it.
- Based: passes — The paper gives a reason why it holds.
It may state two separate claims as one.
A conclusion the paper draws from its own results — it cites no other source for it, so there is none to check. The quote shows it is in the paper.
In the paper
“While adolescence broadly invoked structural plasticity of axons and synapses, cocaine predominantly altered metabolic parameters to support synaptic potentiation”
§ Cell type-specific transcriptional programs in mouse prefrontal cortex during adolescence and addiction > Discussion
plaindirect- Asserted: passes — The authors put it forward as true.
- Checkable: passes — It can be checked against evidence.
- Load-bearing: passes — The paper’s conclusions depend on it.
- Based: passes — The paper gives a reason why it holds.
It may state two separate claims as one.
A conclusion the paper draws from its own results — it cites no other source for it, so there is none to check. The quote shows it is in the paper.
In the paper
“This can in turn cause excitotoxicity and deterioration of neural health and excitability that eventually resulting in a long-term deleterious effects of drug addiction.”
§ Cell type-specific transcriptional programs in mouse prefrontal cortex during adolescence and addiction > Discussion
plaindirect- Asserted: passes — The authors put it forward as true.
- Checkable: passes — It can be checked against evidence.
- Load-bearing: fails — The paper’s conclusions may not depend on it.
- Based: fails — The paper may give no reason why it holds.
Probably not a substantial claim. The paper’s conclusions may not depend on it. The paper may give no reason why it holds. It may state two separate claims as one.
In the paper
“prior studies that demonstrated prominent transcriptional differences between the two geometric poles of the cortex (i.e., anterior and posterior)47”
§ Cell type-specific transcriptional programs in mouse prefrontal cortex during adolescence and addiction > Discussion
What the sources say
- Not checked yetcites [47] Saunders, A. et al. Molecular Diversity and Specializations among the Cells of the Adult Mouse Brain. Cell 174, 1015–1030 (2018). e1016. source
boostedcorrelational- Asserted: passes — The authors put it forward as true.
- Checkable: passes — It can be checked against evidence.
- Load-bearing: fails — The paper’s conclusions may not depend on it.
- Based: passes — The paper gives a reason why it holds.
Probably not a substantial claim. The paper’s conclusions may not depend on it.
What the paper did — it cites no source for this, so there is none to check. The quote shows it is in the paper.
In the paper
“we performed gene expression analyses using the 13 “low resolution” clusters for a better power and higher accuracy to determine differential transcription.”
§ Cell type-specific transcriptional programs in mouse prefrontal cortex during adolescence and addiction > Discussion
plain- Asserted: passes — The authors put it forward as true.
- Checkable: passes — It can be checked against evidence.
- Load-bearing: passes — The paper’s conclusions depend on it.
- Based: passes — The paper gives a reason why it holds.
Probably not a substantial claim.
In the paper
“prior human studies have predicted such possibilities52.”
§ Cell type-specific transcriptional programs in mouse prefrontal cortex during adolescence and addiction > Discussion
What the sources say
- Not checked yetcites [52] Zhou, Z., Enoch, M. A. & Goldman, D. Gene expression in the addicted brain. Int Rev. Neurobiol. 116, 251–273 (2014). source
plain- Asserted: passes — The authors put it forward as true.
- Checkable: passes — It can be checked against evidence.
- Load-bearing: fails — The paper’s conclusions may not depend on it.
- Based: passes — The paper gives a reason why it holds.
Probably not a substantial claim. The paper’s conclusions may not depend on it.
What the paper did — it cites no source for this, so there is none to check. The quote shows it is in the paper.
In the paper
“the age difference between the two models (adolescence- P21 and cocaine starting at P60), which can naturally impact the basal adaptability/plasticity of the brain may also have some contribution towards the difference.”
§ Cell type-specific transcriptional programs in mouse prefrontal cortex during adolescence and addiction > Discussion
hedgedconditional- Asserted: passes — The authors put it forward as true.
- Checkable: passes — It can be checked against evidence.
- Load-bearing: fails — The paper’s conclusions may not depend on it.
- Based: passes — The paper gives a reason why it holds.
Probably not a substantial claim. The paper’s conclusions may not depend on it.
A conclusion the paper draws from its own results — it cites no other source for it, so there is none to check. The quote shows it is in the paper.
In the paper
“our data suggest that the impact of cocaine in PFC is highly cell subtype-specific and temporally regulated.”
§ Cell type-specific transcriptional programs in mouse prefrontal cortex during adolescence and addiction > Results > Cocaine induced cell-type specific transcriptional changes
hedgeddirect- Asserted: passes — The authors put it forward as true.
- Checkable: passes — It can be checked against evidence.
- Load-bearing: passes — The paper’s conclusions depend on it.
- Based: passes — The paper gives a reason why it holds.
It may state two separate claims as one.
None of the sources cited for this claim have been checked yet.
In the paper
“Our integrative analyses have allowed us to: (a) identify disease-relevant cell types for a disorder; (b) identify unique dysfunctions in individual cohorts (due to impact on very specific subtypes); (c) deduce a potential functional basis of a disorder (such as excitatory/inhibitory balance48,49, lack of myelination50 etc.) based on the cells affected.”
§ Cell type-specific transcriptional programs in mouse prefrontal cortex during adolescence and addiction > Discussion
What the sources say
- Not checked yetcites [48] Nelson, S. B. & Valakh, V. Excitatory/Inhibitory Balance and Circuit Homeostasis in Autism Spectrum Disorders. Neuron 87, 684–698 (2015). source
- Not checked yetcites [49] Yizhar, O. et al. Neocortical excitation/inhibition balance in information processing and social dysfunction. Nature 477, 171–178 (2011). source
- Not checked yetcites [50] Nave, K. A. & Ehrenreich, H. Myelination and oligodendrocyte functions in psychiatric diseases. JAMA Psychiatry 71, 582–584 (2014). source
plaindirect- Asserted: passes — The authors put it forward as true.
- Checkable: passes — It can be checked against evidence.
- Load-bearing: passes — The paper’s conclusions depend on it.
- Based: passes — The paper gives a reason why it holds.
It may state two separate claims as one.
In the paper
“Psychiatric disorders are complex, poorly understood and mostly incurable7.”
§ Cell type-specific transcriptional programs in mouse prefrontal cortex during adolescence and addiction > Discussion
What the sources say
- Not checked yetcites [7] Nurnberger, J. I., Berrettini, W. & Niculescu, A. B. in The Medical Basis of Psychiatry (eds S. Hossein Fatemi & Paula J. Clayton) 553–600 (Springer New York, 2016). source
plain- Asserted: passes — The authors put it forward as true.
- Checkable: fails — It may be too vague to check against evidence.
- Load-bearing: fails — The paper’s conclusions may not depend on it.
- Based: passes — The paper gives a reason why it holds.
Probably not a substantial claim. It may be too vague to check against evidence. The paper’s conclusions may not depend on it. It may state two separate claims as one.
In the paper
“Prior studies indicate that inhibitory neurons show uniform molecular features even between distant cortical areas14.”
§ Cell type-specific transcriptional programs in mouse prefrontal cortex during adolescence and addiction > Discussion
What the sources say
- Not checked yetcites [14] Tasic, B. et al. Shared and distinct transcriptomic cell types across neocortical areas. Nature 563, 72–78 (2018). source
hedged- Asserted: passes — The authors put it forward as true.
- Checkable: passes — It can be checked against evidence.
- Load-bearing: fails — The paper’s conclusions may not depend on it.
- Based: passes — The paper gives a reason why it holds.
Probably not a substantial claim. The paper’s conclusions may not depend on it.
In the paper
“These findings align with preexisting notion that exposure to addictive substances during adolescence can impair PFC maturation, and open doors for more precise mechanistic and therapeutic studies51.”
§ Cell type-specific transcriptional programs in mouse prefrontal cortex during adolescence and addiction > Discussion
What the sources say
- Not checked yetcites [51] Walker, D. M. et al. Cocaine Self-administration Alters Transcriptome-wide Responses in the Brain’s Reward Circuitry. Biol. Psychiatry 84, 867–880 (2018). source
plainconditional- Asserted: passes — The authors put it forward as true.
- Checkable: passes — It can be checked against evidence.
- Load-bearing: fails — The paper’s conclusions may not depend on it.
- Based: passes — The paper gives a reason why it holds.
Probably not a substantial claim. The paper’s conclusions may not depend on it.
In the paper
“Prior studies show that cortical DNA methylation takes place during postnatal 1–4 weeks40.”
§ Cell type-specific transcriptional programs in mouse prefrontal cortex during adolescence and addiction > Discussion
What the sources say
- Not checked yetcites [40] Lister, R. et al. Global epigenomic reconfiguration during mammalian brain development. Science 341, 1237905 (2013). source
plain- Asserted: passes — The authors put it forward as true.
- Checkable: passes — It can be checked against evidence.
- Load-bearing: fails — The paper’s conclusions may not depend on it.
- Based: passes — The paper gives a reason why it holds.
Probably not a substantial claim. The paper’s conclusions may not depend on it.
A conclusion the paper draws from its own results — it cites no other source for it, so there is none to check. The quote shows it is in the paper.
In the paper
“This implies that acquisition of reward possibly has a greater impact on basal forebrain structures of the reward circuit like the nucleus accumbens, and a craving response upon withdrawal greatly engages the PFC.”
§ Cell type-specific transcriptional programs in mouse prefrontal cortex during adolescence and addiction > Discussion
hedgedconditional- Asserted: passes — The authors put it forward as true.
- Checkable: passes — It can be checked against evidence.
- Load-bearing: fails — The paper’s conclusions may not depend on it.
- Based: passes — The paper gives a reason why it holds.
Probably not a substantial claim. The paper’s conclusions may not depend on it. It may state two separate claims as one.
In the paper
“Genome wide association studies (GWAS) have linked these disorders to a group of genes41.”
§ Cell type-specific transcriptional programs in mouse prefrontal cortex during adolescence and addiction > Discussion
What the sources say
- Not checked yetcites [41] Collins, A. L. & Sullivan, P. F. Genome-wide association studies in psychiatry: what have we learned? Br. J. Psychiatry 202, 1–4 (2013). source
plaincorrelational- Asserted: passes — The authors put it forward as true.
- Checkable: passes — It can be checked against evidence.
- Load-bearing: passes — The paper’s conclusions depend on it.
- Based: passes — The paper gives a reason why it holds.
Probably not a substantial claim.
A conclusion the paper draws from its own results — it cites no other source for it, so there is none to check. The quote shows it is in the paper.
In the paper
“with knowledge of the cellular basis of pathogenesis, understanding of the disease mechanisms/manifestation, progress and targeted cell-type specific therapy can be developed/executed.”
§ Cell type-specific transcriptional programs in mouse prefrontal cortex during adolescence and addiction > Discussion
plaindirect- Asserted: passes — The authors put it forward as true.
- Checkable: fails — It may be too vague to check against evidence.
- Load-bearing: passes — The paper’s conclusions depend on it.
- Based: fails — The paper may give no reason why it holds.
Probably not a substantial claim. It may be too vague to check against evidence. The paper may give no reason why it holds. It may state two separate claims as one.
In the paper
“there are many factors modulating drug self-administration54, and further studies are needed for a complete understanding of neural mechanisms underlying the pathogenesis of voluntary drug taking.”
§ Cell type-specific transcriptional programs in mouse prefrontal cortex during adolescence and addiction > Discussion
What the sources say
- Not checked yetcites [54] Ahmed, S. H. & Koob, G. F. Transition from moderate to excessive drug intake: change in hedonic set point. Science 282, 298–300 (1998). source
plain- Asserted: passes — The authors put it forward as true.
- Checkable: fails — It may be too vague to check against evidence.
- Load-bearing: fails — The paper’s conclusions may not depend on it.
- Based: passes — The paper gives a reason why it holds.
Probably not a substantial claim. It may be too vague to check against evidence. The paper’s conclusions may not depend on it. It may state two separate claims as one.
A conclusion the paper draws from its own results — it cites no other source for it, so there is none to check. The quote shows it is in the paper.
In the paper
“our study provides evidence that PFC, unlike other brain regions, retains significant plasticity much later in life, and cell type-specific transcriptional responses can adapt to stimuli such as cocaine withdrawal.”
§ Cell type-specific transcriptional programs in mouse prefrontal cortex during adolescence and addiction > Discussion
plaindirect- Asserted: passes — The authors put it forward as true.
- Checkable: passes — It can be checked against evidence.
- Load-bearing: passes — The paper’s conclusions depend on it.
- Based: passes — The paper gives a reason why it holds.
It may state two separate claims as one.
A conclusion the paper draws from its own results — it cites no other source for it, so there is none to check. The quote shows it is in the paper.
In the paper
“while histone modifiers are clearly predominant regulators, a marginal role of DNA methylation in some of the initial impact of P21→P60 cannot be fully ruled out.”
§ Cell type-specific transcriptional programs in mouse prefrontal cortex during adolescence and addiction > Discussion
hedgedconditional- Asserted: passes — The authors put it forward as true.
- Checkable: passes — It can be checked against evidence.
- Load-bearing: unclear — It is unclear whether the paper’s conclusions depend on it.
- Based: passes — The paper gives a reason why it holds.
It may state two separate claims as one.
What the paper did — it cites no source for this, so there is none to check. The quote shows it is in the paper.
In the paper
“As an initial quality control, cells that: have a potential mitochondria contamination (>10% of their total transcripts from mitochondrial transcriptome) or likely represent double-droplets (cells expressing more than the 99th percentile of the number of genes, 4766 genes) were removed.”
§ Cell type-specific transcriptional programs in mouse prefrontal cortex during adolescence and addiction > Methods > Preprocessing of single-cell gene expression data
plain- Asserted: passes — The authors put it forward as true.
- Checkable: passes — It can be checked against evidence.
- Load-bearing: passes — The paper’s conclusions depend on it.
- Based: passes — The paper gives a reason why it holds.
Probably not a substantial claim.
- Rests on an assumption: Abnormally high mitochondrial mRNA is an indication of dead or dying cells.
- Rests on an assumption: Incorporation of cells with abnormally high mitochondrial mRNA into the analysis can skew the results and introduce errors in detection of differentially expressed genes.
What the paper did — it cites no source for this, so there is none to check. The quote shows it is in the paper.
In the paper
“Specifically, the cluster markers were calculated by using a Bonferroni-corrected negative binomial generalized linear model (FindAllMarkers function of the Seurat package, test.use = “negbinom”) while controlling for the number of UMI in each cell, the percent of mitochondrial genes, and sample-to-sample variation.”
§ Cell type-specific transcriptional programs in mouse prefrontal cortex during adolescence and addiction > Methods > Identification of cluster markers
plain- Asserted: passes — The authors put it forward as true.
- Checkable: passes — It can be checked against evidence.
- Load-bearing: passes — The paper’s conclusions depend on it.
- Based: passes — The paper gives a reason why it holds.
Probably not a substantial claim.
In the paper
“Then, the ‘multiBatchNorm” function of the scran R/Bioconductor package75 was used to rescale the datasets to similar sequencing depth.”
§ Cell type-specific transcriptional programs in mouse prefrontal cortex during adolescence and addiction > Methods > Detecting differential gene expression PFC vs. VISp or ALM
What the sources say
- Not checked yetcites [75] Lun, A. T., McCarthy, D. J. & Marioni, J. C. A step-by-step workflow for low-level analysis of single-cell RNA-seq data with Bioconductor. F1000Research 5, 2122 (2016).
plaindirect- Asserted: passes — The authors put it forward as true.
- Checkable: passes — It can be checked against evidence.
- Load-bearing: passes — The paper’s conclusions depend on it.
- Based: passes — The paper gives a reason why it holds.
Probably not a substantial claim.
- Rests on an assumption: Canonical correlation analysis (CCA) can only present cells into another projection space that brings similar cells into near proximity; it does not correct the gene expression between two datasets.
A conclusion the paper draws from its own results — it cites no other source for it, so there is none to check. The quote shows it is in the paper.
In the paper
“When we checked their distribution in the t-SNE they showed a random localization in the t-SNE plot indicating that they couldn’t be faithfully classified due to technical issues rather than representing new cell-types.”
§ Cell type-specific transcriptional programs in mouse prefrontal cortex during adolescence and addiction > Methods > Comparison between PFC cells of P21 and P60 mice
hedgeddirect- Asserted: passes — The authors put it forward as true.
- Checkable: passes — It can be checked against evidence.
- Load-bearing: unclear — It is unclear whether the paper’s conclusions depend on it.
- Based: passes — The paper gives a reason why it holds.
It may state two separate claims as one.
What the paper did — it cites no source for this, so there is none to check. The quote shows it is in the paper.
In the paper
“To avoid outlier effect, the mean expression of each cluster was calculated using cells with an expression value <99th percentile for each gene.”
§ Cell type-specific transcriptional programs in mouse prefrontal cortex during adolescence and addiction > Methods > Association of GWAS genes to cell clusters
plain- Asserted: passes — The authors put it forward as true.
- Checkable: passes — It can be checked against evidence.
- Load-bearing: passes — The paper’s conclusions depend on it.
- Based: passes — The paper gives a reason why it holds.
Probably not a substantial claim.
In the paper
“To remove any potential batch effect between saline and cocaine samples, we run the CCA analysis17.”
§ Cell type-specific transcriptional programs in mouse prefrontal cortex during adolescence and addiction > Methods > Broad clustering analysis and t-SNE plot generation
What the sources say
- Not checked yetcites [17] Butler, A., Hoffman, P., Smibert, P., Papalexi, E. & Satija, R. Integrating single-cell transcriptomic data across different conditions, technologies, and species. Nat. Biotechnol. 36, 411–420 (2018). source
plaindirect- Asserted: passes — The authors put it forward as true.
- Checkable: passes — It can be checked against evidence.
- Load-bearing: passes — The paper’s conclusions depend on it.
- Based: passes — The paper gives a reason why it holds.
Probably not a substantial claim.
In the paper
“We thus first used canonical correlation analysis (CCA)17 to find a projection space that maximize the correlation between the two samples so that batch effect can be removed.”
§ Cell type-specific transcriptional programs in mouse prefrontal cortex during adolescence and addiction > Methods > Corresponding cell clusters between PFC, VISp, and ALM
What the sources say
- Not checked yetcites [17] Butler, A., Hoffman, P., Smibert, P., Papalexi, E. & Satija, R. Integrating single-cell transcriptomic data across different conditions, technologies, and species. Nat. Biotechnol. 36, 411–420 (2018). source
plaindirectn = 2- Asserted: passes — The authors put it forward as true.
- Checkable: passes — It can be checked against evidence.
- Load-bearing: passes — The paper’s conclusions depend on it.
- Based: passes — The paper gives a reason why it holds.
Probably not a substantial claim.
- Rests on an assumption: Conventional correlation analysis can lead to inconsistent results when two datasets are sequenced at different depths.
The paper relies on this without support.
Coordinated activity-induced transcriptional changes across multiple neuron subtypes of the PFC play a pivotal role in encoding and regulating major cognitive behaviors.
“Coordinated activity-induced transcriptional changes across multiple neuron subtypes of the prefrontal cortex (PFC) play a pivotal role in encoding and regulating major cognitive behaviors.”
The paper relies on this without support.
The cellular mechanisms underlying the dysfunctions caused by early and later life events are largely unknown.
“However, the cellular mechanisms underlying these dysfunctions are largely unknown.”
The paper relies on this without support.
The profound cellular heterogeneity of the PFC has hindered the study of cell-type-specific transcriptional dynamics.
“However, the profound cellular heterogeneity of the PFC has hindered the study of cell-type-specific transcriptional dynamics.”
The paper relies on this without support.
The PFC is comprised of 4 layers (L1, L2/3, L5, and L6) and does not contain a L4.
“The PFC is comprised of 4 layers (L) L1, L2/3, L5, and L6 (but does not contain a L4).”
The paper relies on this without support.
Mice are weaned from maternal care at P21 and begin exploring the environment on their own, and are considered as adult at P60.
“Mice are weaned from maternal care at P21 and begin exploring the environment on their own, and are considered as adult at P60.”
The paper relies on this without support.
Widespread change in transcription is often associated with broad chromatin and epigenetic regulations.
“Widespread change in transcription is often associated with broad chromatin and epigenetic regulations.”
The paper relies on this without support.
Altered histone modifiers can regulate gene expression either positively or negatively.
“The altered histone modifiers can regulate gene expression either positively or negatively.”
The paper relies on this without support.
Transcriptional regulation by Chd8 has been associated with neuronal function.
“Transcriptional regulation by Chd8 has been associated with neuronal function.”
The paper relies on this without support.
The PFC plays a central role in the pathophysiology of several neuropsychiatric disorders, including schizophrenia, bipolar disorder, psychosis, mania, depression or suicidal tendencies.
“The PFC is believed to play a central role in the pathophysiology of several neuropsychiatric disorders, including schizophrenia, bipolar disorder, psychosis, mania, depression or suicidal tendencies.”
The paper relies on this without support.
The cellular and molecular mechanisms underlying involvement of GWAS candidate genes in neuropsychiatric disorders remain largely unknown.
“However, the cellular and molecular mechanisms underlying their involvement remain largely unknown.”
The paper relies on this without support.
A causal relationship between a gene function and a disorder, as well as the underlying mechanism, is difficult to establish.
“However, a causal relationship between a gene function and a disorder, as well as the underlying mechanism is difficult to establish.”
The paper relies on this without support.
Many psychiatric disorders may emerge from dysfunctions of non-neuronal cells, which cause disruptions of major support systems like myelination or blood-brain barrier.
“It is now appreciated that many psychiatric disorders may emerge from dysfunctions of non-neuronal cells, which cause disruptions of major support systems like myelination or blood-brain barrier.”
The paper relies on this without support.
Adolescence is a major landmark of postnatal PFC maturation.
“Adolescence is known to be a major landmark of postnatal PFC maturation.”
The paper relies on this without support.
Which type of cells in PFC exhibit transcriptional dynamics during adolescence, and by what means, have remained unknown.
“Yet which type of cells in PFC exhibit transcriptional dynamics during this period, and by what means, have remained unknown.”
The paper relies on this without support.
Less is known about cell type-specific regulation of the neuronal epigenome in later postnatal life.
“Less is known about cell type-specific regulation of the neuronal epigenome in later postnatal life.”
The paper relies on this without support.
Induced plasticity should mainly impact neurons within the circuits that respond to the specific stimulus.
“Unlike global adaptations that may occur in all cells of a neuron subtype during development, induced plasticity should mainly impact neurons within the circuits that respond to the specific stimulus.”
The paper relies on this without support.
Abnormally high mitochondrial mRNA is an indication of dead or dying cells.
“Abnormally high mitochondrial mRNA is an indication of dead or dying cells.”
The paper relies on this without support.
Incorporation of cells with abnormally high mitochondrial mRNA into the analysis can skew the results and introduce errors in detection of differentially expressed genes.
“Incorporation of these cells into the analysis can skew the results and introduce errors in detection of differentially expressed genes.”
The paper relies on this without support.
Conventional correlation analysis can lead to inconsistent results when two datasets are sequenced at different depths.
“Since the two datasets were sequenced at different depths, conventional correlation analysis can lead to inconsistent results.”
The paper relies on this without support.
Canonical correlation analysis (CCA) can only present cells into another projection space that brings similar cells into near proximity; it does not correct the gene expression between two datasets.
“As the canonical correlation analysis (CCA) can only present cells into another projection space that brings similar cells into near proximity, it does not correct the gene expression between two datasets.”
The paper relies on this without support.
The second criterion (cells expressing a gene concentrated in a subset of clusters) enables detection of potential false-positive genes that are broadly expressed by showing variability in their expression along cell-types.
“The second criteria enables us to detect potential false-positive genes that broadly expressed by showing a variability in their expression along the cell-types.”
The authors state this as an assumption.
The two-phase transcription model assumes that cells in a homogeneous population respond non-homogeneously to a stimulus.
“To detect the genes affected by cocaine in each cluster, we used a “Two-phase transcription” model (SC2P package43), which assumes that cells in a homogeneous population response non-homogeneously to a stimulus.”
Claims other papers make about this one
Each is checked against this paper’s own text: does it say what the citing paper says it does?
The cited source says what the claim attributes to it.
In the citing paper
“Within our compendium, we identified a total of fourteen studies with control groups that included six or more samples5,6,15,49–59.”
From Confronting false discoveries in single-cell differential expression (2021) · cites this paper as [54]
Self-check
Percentages, sums and reported differences re-computed from the paper’s own numbers.
Each contradiction between two passages listed here was confirmed by an independent check.
Rated major: it would touch a result — a value a result rests on, reported and recomputed p-values on opposite sides of the significance level, two passages that conflict with no sign which is right, or a cited work retracted before this paper was published.
In the paper
§ Cell type-specific transcriptional programs in mouse prefrontal cortex during adolescence and addiction > Results > Cellular composition of PFC
“The excitatory neurons form the largest (52.3%) cell class in the PFC, while the inhibitory neurons comprise a smaller portion (4.3%) of the total populations”
§ Cell type-specific transcriptional programs in mouse prefrontal cortex during adolescence and addiction > Results > Cellular composition of PFC
“In the end, we obtained 9195 high quality non-neuronal (median UMI: 3764; median 1658 genes/cell) and 15,627 neuronal (median UMI: 13,194; median 3914 genes/cell) cells”
Rated minor: it would not touch a result — a value no result rests on, a p-value that stays on the same side of the significance level, or a conflict that is clerical, resolved elsewhere in the paper, or outside its own findings.
In the paper
§ Cell type-specific transcriptional programs in mouse prefrontal cortex during adolescence and addiction > Results > Cocaine induced cell-type specific transcriptional changes
“At 15 day drug withdrawal, the number of genes affected increased in every single subtype with Exc-2, 6, 7, and 8 showing the greatest effects.”
§ Cell type-specific transcriptional programs in mouse prefrontal cortex during adolescence and addiction > Results > Cocaine induced cell-type specific transcriptional changes
“Curiously, the number of altered genes reduced between 48 h and 15-day withdrawal in Exc-1.”
Rated minor: it would not touch a result — a value no result rests on, a p-value that stays on the same side of the significance level, or a conflict that is clerical, resolved elsewhere in the paper, or outside its own findings.
In the paper
§ Cell type-specific transcriptional programs in mouse prefrontal cortex during adolescence and addiction > Discussion
“Compared to the excitatory neurons of VISp and ALM, the PFC has 5 (PFC9, 15, 16, 17) and 2 (PFC7 and 14) unique neuron subtypes respectively”
§ Cell type-specific transcriptional programs in mouse prefrontal cortex during adolescence and addiction > Results > PFC transcriptional features are different from VISp or ALM
“For example, PFC-9 (G13) or PFC6,15,16,17 (G11) showed no similarity to any VISp subpopulations”
Citations
Cites
Integrating single-cell transcriptomic data across different conditions, technologies, and species
Butler, A., Hoffman, P., Smibert, P., Papalexi, E., & Satija, R. (2018) · Nature Biotechnology · doi:10.1038/nbt.4096 · Cited by 13,174
Complex heatmaps reveal patterns and correlations in multidimensional genomic data
Gu, Z., Eils, R., & Schlesner, M. (2016) · Bioinformatics · doi:10.1093/bioinformatics/btw313 · Cited by 10,037
Massively parallel digital transcriptional profiling of single cells
Zheng, G. X. Y., Terry, J. M., Belgrader, P., Ryvkin, P., Bent, Z. W., Wilson, R., Ziraldo, S. B., Wheeler, T. D., McDermott, G. P., Zhu, J., et al. (2017) · Nature Communications · doi:10.1038/ncomms14049 · Cited by 7,353
Causal analysis approaches in Ingenuity Pathway Analysis
Krämer, A., Green, J., Pollard, J., & Tugendreich, S. (2014) · Bioinformatics · doi:10.1093/bioinformatics/btt703 · Cited by 5,724
circlize implements and enhances circular visualization in R
Gu, Z., Gu, L., Eils, R., Schlesner, M., & Brors, B. (2014) · Bioinformatics · doi:10.1093/bioinformatics/btu393 · Cited by 4,290
Cell types in the mouse cortex and hippocampus revealed by single-cell RNA-seq
Zeisel, A., Muñoz-Manchado, A. B., Codeluppi, S., Lönnerberg, P., La Manno, G., Juréus, A., Marques, S., Munguba, H., He, L., Betsholtz, C., et al. (2015) · Science · doi:10.1126/science.aaa1934 · Cited by 3,124
Why do many psychiatric disorders emerge during adolescence?
Paus, T., Keshavan, M., & Giedd, J. N. (2008) · Nature Reviews Neuroscience · doi:10.1038/nrn2513 · Cited by 3,123
Neocortical excitation/inhibition balance in information processing and social dysfunction
Yizhar, O., Fenno, L. E., Prigge, M., Schneider, F., Davidson, T. J., O’Shea, D. J., Sohal, V. S., Goshen, I., Finkelstein, J., Paz, J. T., et al. (2011) · Nature · doi:10.1038/nature10360 · Cited by 2,454
The new NHGRI-EBI Catalog of published genome-wide association studies (GWAS Catalog)
MacArthur, J., Bowler, E., Cerezo, M., Gil, L., Hall, P., Hastings, E., Junkins, H., McMahon, A., Milano, A., Morales, J., et al. (2017) · Nucleic Acids Research · doi:10.1093/nar/gkw1133 · Cited by 2,161
Global epigenomic reconfiguration during mammalian brain development
Lister, R., Mukamel, E. A., Nery, J. R., Urich, M., Puddifoot, C. A., Johnson, N. D., Lucero, J., Huang, Y., Dwork, A. J., Schultz, M. D., et al. (2013) · Science · doi:10.1126/science.1237905 · Cited by 1,830
Research works printed but not linked: 1
- Crow, M., Paul, A., Ballouz, S., Huang, Z. J. & Gillis, J. Characterizing the replicability of cell types defined by single cell RNA-sequencing data using MetaNeighbor. Nature. Communications 9, 884 (2018).
Cited by
Sorted by citations
Confronting false discoveries in single-cell differential expression
Squair, J. W., Gautier, M., Kathe, C., Anderson, M. A., James, N. D., Hutson, T. H., Hudelle, R., Qaiser, T., Matson, K. J. E., Barraud, Q., et al. (2021) · doi:10.1101/2021.03.12.435024 · Cited by 1,086
Single-cell and spatial transcriptomics: deciphering brain complexity in health and disease
Piwecka, M., Rajewsky, N., & Rybak-Wolf, A. (2023) · Nature Reviews Neurology · doi:10.1038/s41582-023-00809-y · Cited by 320
Early Alzheimer’s disease pathology in human cortex involves transient cell states
Gazestani, V., Kamath, T., Nadaf, N. M., Dougalis, A., Burris, S. J., Rooney, B., Junkkari, A., Vanderburg, C., Pelkonen, A., Gomez-Budia, M., et al. (2023) · Cell · doi:10.1016/j.cell.2023.08.005 · Cited by 209
Kim, D. W., Washington, P. W., Wang, Z. Q., Lin, S. H., Sun, C., Ismail, B. T., Wang, H., Jiang, L., & Blackshaw, S. (2020) · Nature Communications · doi:10.1038/s41467-020-18231-z · Cited by 177
Insulin action in the brain: cell types, circuits, and diseases
Chen, W., Cai, W., Hoover, B., & Kahn, C. R. (2022) · Trends in Neurosciences · doi:10.1016/j.tins.2022.03.001 · Cited by 184
Self-citation
Metadata
- Authors
- Bhattacherjee, A., Djekidel, M. N., Chen, R., Chen, W., Tuesta, L. M., & Zhang, Y.
- Affiliations
- Boston Children's Hospital (US)
- Corresponding author
- Zhang, Yi
- Venue
- Nature Communications
- Published
- 2019-09-13
- Volume
- 10
- Issue
- 1
- Pages
- 4169-4169
- ISSN
- 2041-1723 (ISSN-L)
- PMC
- PMC6744514
- OpenAlex
- W2972625781
- Semantic Scholar
- ab7e80771b61b067cc03d0f701ea0a3f71c9fe84
- Cited by
- 174
- References
- 79
- Citations by year
- 2026: 21 · 2025: 32 · 2024: 33 · 2023: 32 · 2022: 25 · 2021: 20 · 2020: 9 · 2019: 1
- FWCI
- 4.55
- Type
- journal article
- Language
- en
- Open access
- gold
- doi.org
- Locations
- Nature Communications (publishedVersion, cc-by)
- PubMed Central (publishedVersion, cc-by)
- PubMed (publishedVersion)
- RePEc: Research Papers in Economics (submittedVersion)
- DOAJ (DOAJ: Directory of Open Access Journals) (submittedVersion)
- DOAJ (DOAJ: Directory of Open Access Journals) (submittedVersion, cc-by-sa)
- Funders
- Howard Hughes Medical Institute
- Topics
- Life Sciences › Biochemistry, Genetics and Molecular Biology › Molecular Biology › Single-cell and spatial transcriptomics
- Life Sciences › Neuroscience › Cellular and Molecular Neuroscience › Neuroscience and Neuropharmacology Research
- Life Sciences › Neuroscience › Cellular and Molecular Neuroscience › Neurotransmitter Receptor Influence on Behavior
- Keywords
- prefrontal cortex, neuronal cell types, cell-type-specific transcription, adolescence, cocaine dependence, drug withdrawal, transcriptional dynamics, neuropsychiatric disorders, single-cell transcriptomics
- MeSH terms
- Animals, Male, Neurosciences, Behavior, Addictive, Prefrontal Cortex, Sequence Analysis, RNA, Mice
About these checks
Registry, retraction, Cites and statistics results are computed, not judged, with one exception: a printed reference that no index lists is read once by a model before it counts as a citation error. Claims are extracted by a model and kept only when their quote appears verbatim in the text; each cited source is then checked, with a model’s help, for whether it says what the claim relies on. Those verdicts can be wrong — read the claim’s quote and the cited source before relying on one.
A language model drew the claims from the paper on 2026-10-10, under version 3 of the claim definition (model deepseek-v4.1-flash, prompt extract-v3).
A second model labelled each claim on 2026-10-10 (model jev-1.13-20260917, definition revision gold-guideline-v0.2).
Cited sources are checked with a language model’s help (gpt-6-sol).
Statistics and arithmetic are recomputed, not judged.
Confidence bands are shown only for fields calibrated on our annotated test set. None is calibrated yet, so no band is shown.
What counts as a claim ›How we measure confidence ›How we check this ›
Are you an author, or do you see a problem with this page? Request a review
