

The DOI matches its Crossref record; 33 of the 34 references it cites were found in a registry or an index; none of the 21 sources its claims cite is checked for support yet.
Taking stock of national climate policies to evaluate implementation of the Paris Agreement
Open accessAbstract
Many countries have implemented national climate policies to accomplish pledged Nationally Determined Contributions and to contribute to the temperature objectives of the Paris Agreement on climate change. In 2023, the global stocktake will assess the combined effort of countries. Here, based on a public policy database and a multi-model scenario analysis, we show that implementation of current policies leaves a median emission gap of 22.4 to 28.2 GtCO 2 eq by 2030 with the optimal pathways to implement the well below 2 °C and 1.5 °C Paris goals. If Nationally Determined Contributions would be fully implemented, this gap would be reduced by a third. Interestingly, the countries evaluated were found to not achieve their pledged contributions with implemented policies (implementation gap), or to have an ambition gap with optimal pathways towards well below 2 °C. This shows that all countries would need to accelerate the implementation of policies for renewable technologies, while efficiency improvements are especially important in emerging countries and fossil-fuel-dependent countries.
Overview
AI snapshot
Written from the paper’s full text.
TL;DR
Using a policy inventory and multi-model scenario analysis, current national climate policies leave a median 2030 emissions gap of 22.4 GtCO2eq with well-below-2 °C pathways and 28.2 GtCO2eq with 1.5 °C pathways. Full implementation of conditional NDCs would reduce the 2 °C gap by a third but still leave a significant ambition gap.
Key findings
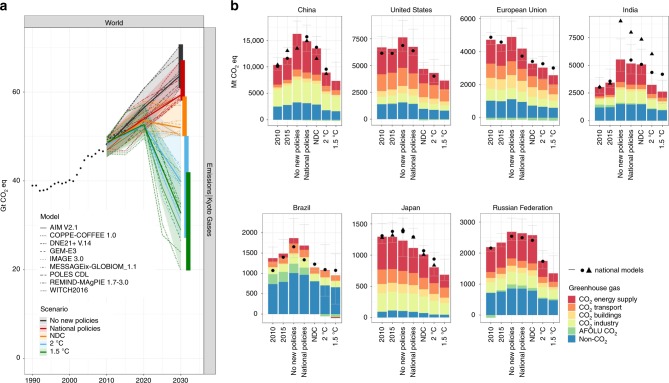
- Global greenhouse gas emissions under the National policies scenario reach 59.3 GtCO2eq (58.4–63.7) by 2030, a 5.3% (3.8%–7.9%) reduction relative to No new policies; this covers 15.4% (10.8%–19.0%) of the gap to the 2 °C pathway and 11% (7.6%–15.9%) to the 1.5 °C pathway.
- The total 2030 emissions gap between National policies and cost-optimal pathways is 22.4 GtCO2eq (13.6–29.6) for 2 °C and 28.2 GtCO2eq (19.8–42.2) for 1.5 °C. Full conditional NDCs give 51.9 GtCO2eq (50.4–57.4) in 2030, leaving an implementation gap of 7.7 GtCO2eq (5.3–9.7); the 2 °C gap is reduced by a third, leaving a median ambition gap of 16.5 GtCO2eq (6.4–21.0) for 2 °C and 21.2 GtCO2eq (12.2–31.6) for 1.5 °C.
- For seven large economies, policy implementation reduces national emissions by 0% to 9% (median) relative to No new policies. Implementation gaps with NDCs range from 3% (3–7%) for the Russian Federation to 28% (22–37%) for the United States; China, India, Japan, and the Russian Federation are projected to come close to their NDC targets, while Brazil, the European Union, and the United States are further removed.
- Closing the global gap by 2030 requires increasing the low-carbon share of final energy by 6.9 pp (4.0%–12.3%) and improving energy intensity by 9.6% (4.8%–24.7%) for 2 °C; for 1.5 °C, these values are 13.0% (7.2%–24.0%) and 17.5% (12.5%–26.8%).
Methods
- Multi-model scenario analysis using nine global integrated assessment models and ten national models, starting from SSP2, with five scenarios: No new policies, National policies, NDCs, 2 °C, and 1.5 °C.
- National policies were selected from an open-access policy database, based on high-impact policies for G20 economies, with a cut-off date of 31 December 2016; results are presented globally and for Brazil, China, the European Union, India, Japan, the Russian Federation, and the United States.
- Results use medians and 10th–90th percentile ranges across models; gaps are decomposed using Kaya identity indicators, and 2 °C/1.5 °C scenarios use carbon budgets of 1000 GtCO2 and 400 GtCO2 for 2011–2100, respectively.
Limitations
- The paper states that the analysis is limited to national policies and NDCs for G20 economies representing 75% of total 2010 greenhouse gas emissions; countries with high-impact policies but not included represent around 5% of global 2010 emissions.
- The paper states that the policy inventory covers implemented and planned national policies up to 2017, with a cut-off date of 31 December 2016, so very recent policy updates or planned policies in the pipeline were not included.
- The paper states that IAMs differ in aggregation and policy representation, often assume one central planner, and have limited ability to reflect social and economic dynamics of developing and transition economies; cost-optimal 2 °C/1.5 °C pathways may imply higher costs in low-income regions unless complemented by financial transfers. Evident from the text: NDC targets for China and India could not be translated into one specific absolute greenhouse gas emission level, and AFOLU emission estimates are inherently uncertain.
Model-written summary. Check it against the paper before relying on it.
Integrity signals
Registry
Cites
Statistics
Figures
Verification
Claims the paper makes
34 Own result · 13 Not checked yet · 13 No basis given · 12 Own interpretation · 4 Own method
A result the paper reports from its own data — it cites no other source for it, so there is none to check. The quote shows it is in the paper.
In the paper
“and 28.2 GtCO2eq with a 1.5 °C pathway.”
- Also stated in: § Global emissions gap and for seven large G20 countries · plain
“and 28.2 GtCO2eq (19.8–42.2) for the 1.5 °C limit”
§ Taking stock of national climate policies to evaluate implementation of the Paris Agreement > Introduction
plaindirect- Asserted: passes — The authors put it forward as true.
- Checkable: passes — It can be checked against evidence.
- Load-bearing: passes — The paper’s conclusions depend on it.
- Based: passes — The paper gives a reason why it holds.
- The authors state this as an assumption: The 2 °C and 1.5 °C pathways are calculated assuming cost-optimal implementation.
- Also stated in: § Global emissions gap and for seven large G20 countries · plain
A result the paper reports from its own data — it cites no other source for it, so there is none to check. The quote shows it is in the paper.
In the paper
“Under the No new policies scenario, the models project an increase in global greenhouse gas emissions to 63.9 GtCO2eq (61.0–69.1; median and 10th to 90th percentile range over all model results) by 2030.”
§ Taking stock of national climate policies to evaluate implementation of the Paris Agreement > Results > Global implementation and total emissions gap
plaindirect- Asserted: passes — The authors put it forward as true.
- Checkable: passes — It can be checked against evidence.
- Load-bearing: passes — The paper’s conclusions depend on it.
- Based: passes — The paper gives a reason why it holds.
A result the paper reports from its own data — it cites no other source for it, so there is none to check. The quote shows it is in the paper.
In the paper
“It is estimated that the countries with high-impact policies, but not included in our assessment, represent around 5% of global 2010 emissions (see Supplementary Table 1).”
§ Taking stock of national climate policies to evaluate implementation of the Paris Agreement > Introduction
hedged- Asserted: passes — The authors put it forward as true.
- Checkable: passes — It can be checked against evidence.
- Load-bearing: unclear — It is unclear whether the paper’s conclusions depend on it.
- Based: passes — The paper gives a reason why it holds.
The paper states this without a source or data behind it here, so there is nothing to check it against. The quote shows it is in the paper.
In the paper
“leaving a median ambition gap of 16.5 GtCO2eq (6.4–21.0) with 2 °C pathways”
§ Taking stock of national climate policies to evaluate implementation of the Paris Agreement > Results > Global emissions gap and for seven large G20 countries
plaindirect- Asserted: passes — The authors put it forward as true.
- Checkable: passes — It can be checked against evidence.
- Load-bearing: passes — The paper’s conclusions depend on it.
- Based: passes — The paper gives a reason why it holds.
- The authors state this as an assumption: The 2 °C and 1.5 °C pathways are calculated assuming cost-optimal implementation.
A result the paper reports from its own data — it cites no other source for it, so there is none to check. The quote shows it is in the paper.
In the paper
“This leaves a small implementation gap for China, India, Japan, Russian Federation as they are close to achieving their NDC”
- Also stated in: § Impact of national policies for seven large G20 economies · hedged
“China, India, Japan and Russian Federation are projected to come close to achieving their NDC targets with national policies by 2030.”
§ Taking stock of national climate policies to evaluate implementation of the Paris Agreement > Introduction
plaindirectn = 7- Asserted: passes — The authors put it forward as true.
- Checkable: passes — It can be checked against evidence.
- Load-bearing: passes — The paper’s conclusions depend on it.
- Based: passes — The paper gives a reason why it holds.
- Also stated in: § Impact of national policies for seven large G20 economies · hedged
A result the paper reports from its own data — it cites no other source for it, so there is none to check. The quote shows it is in the paper.
In the paper
“Implementation of national policies is not projected to reverse the increase of global emissions by 2030, and would result in emission levels of 59.3 GtCO2eq (58.4–63.7) (Fig. 1)”
§ Taking stock of national climate policies to evaluate implementation of the Paris Agreement > Results > Global implementation and total emissions gap
hedgeddirect- Asserted: passes — The authors put it forward as true.
- Checkable: passes — It can be checked against evidence.
- Load-bearing: passes — The paper’s conclusions depend on it.
- Based: passes — The paper gives a reason why it holds.
A result the paper reports from its own data — it cites no other source for it, so there is none to check. The quote shows it is in the paper.
In the paper
“The 2 °C global emissions gap can be reduced by a third, if conditional NDCs were fully implemented”
- Also stated in: § Global emissions gap and for seven large G20 countries · plain
“The global emissions gap with the 2 °C scenario can be reduced by a third, if conditional NDCs would be fully implemented”
§ Taking stock of national climate policies to evaluate implementation of the Paris Agreement > Introduction
plaindirect- Asserted: passes — The authors put it forward as true.
- Checkable: passes — It can be checked against evidence.
- Load-bearing: passes — The paper’s conclusions depend on it.
- Based: passes — The paper gives a reason why it holds.
- The authors state this as an assumption: The 2 °C and 1.5 °C pathways are calculated assuming cost-optimal implementation.
- Also stated in: § Global emissions gap and for seven large G20 countries · plain
The paper states this without a source or data behind it here, so there is nothing to check it against. The quote shows it is in the paper.
In the paper
“For seven large individual countries (China, the United States, India, the European Union, Japan, Brazil and the Russian Federation), policy implementation is expected to reduce emissions at the national level by 0 to 9% (median estimates) compared to the hypothetical situation if no policies would be implemented.”
§ Taking stock of national climate policies to evaluate implementation of the Paris Agreement > Introduction
hedgeddirectn = 7- Asserted: passes — The authors put it forward as true.
- Checkable: passes — It can be checked against evidence.
- Load-bearing: passes — The paper’s conclusions depend on it.
- Based: passes — The paper gives a reason why it holds.
A result the paper reports from its own data — it cites no other source for it, so there is none to check. The quote shows it is in the paper.
In the paper
“although 5.3% lower compared to the hypothetical situation if these policies would not have been implemented.”
- Also stated in: § Global implementation and total emissions gap · plain
“which is a 5.3% (3.8%–7.9%) reduction relative to the No new policies scenario”
§ Taking stock of national climate policies to evaluate implementation of the Paris Agreement > Introduction
plaindirect- Asserted: passes — The authors put it forward as true.
- Checkable: passes — It can be checked against evidence.
- Load-bearing: passes — The paper’s conclusions depend on it.
- Based: passes — The paper gives a reason why it holds.
- Also stated in: § Global implementation and total emissions gap · plain
A result the paper reports from its own data — it cites no other source for it, so there is none to check. The quote shows it is in the paper.
In the paper
“The results show that if no additional action is taken beyond current implemented national climate policies, greenhouse gas emissions are projected to increase substantially between 2015 and 2030, although 5.3% lower compared to the hypothetical situation if these policies would not have been implemented.”
- Also stated in: § Global implementation and total emissions gap · plain
“Implementation of national policies is not projected to reverse the increase of global emissions by 2030”
§ Taking stock of national climate policies to evaluate implementation of the Paris Agreement > Introduction
plaindirect- Asserted: passes — The authors put it forward as true.
- Checkable: passes — It can be checked against evidence.
- Load-bearing: passes — The paper’s conclusions depend on it.
- Based: passes — The paper gives a reason why it holds.
- Also stated in: § Global implementation and total emissions gap · plain
- Probably not a substantial claim. 16
- It may state two separate claims as one. 27
The paper states this without a source or data behind it here, so there is nothing to check it against. The quote shows it is in the paper.
In the paper
“In general, NDC targets for G20 economies are defined for the year 2030, but the US NDC target is defined for the year 2025.”
§ Taking stock of national climate policies to evaluate implementation of the Paris Agreement > Methods > Scenarios
plain- Asserted: passes — The authors put it forward as true.
- Checkable: passes — It can be checked against evidence.
- Load-bearing: fails — The paper’s conclusions may not depend on it.
- Based: passes — The paper gives a reason why it holds.
Probably not a substantial claim. The paper’s conclusions may not depend on it. It may state two separate claims as one.
A result the paper reports from its own data — it cites no other source for it, so there is none to check. The quote shows it is in the paper.
In the paper
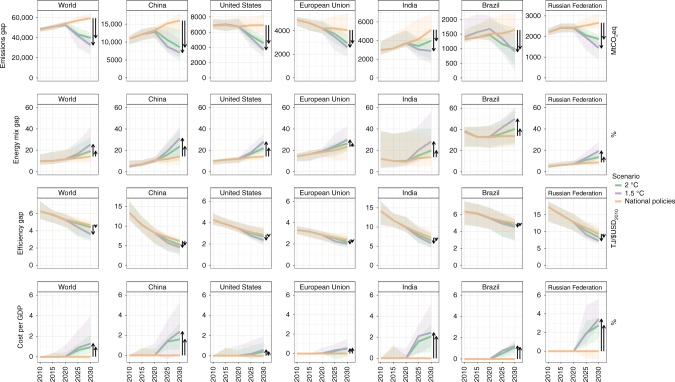
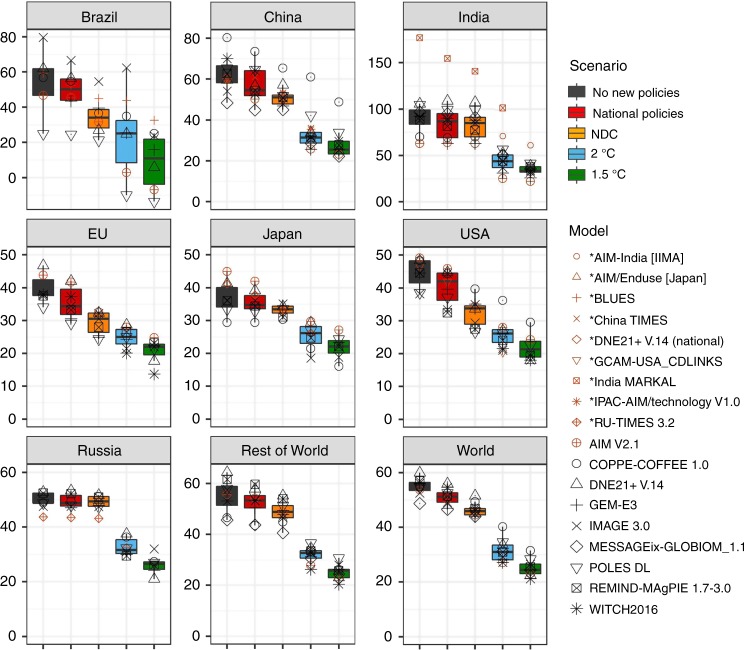
“For the seven individual G20 countries, greenhouse gas emissions by 2030 would need to decrease compared to the national policies scenario by 25 to 41% (median) to stay on track to keep temperature below 2 °C, while this is 33 to 54% (median) under the 1.5 °C scenario (see Table 2 and Fig. 3).”
§ Taking stock of national climate policies to evaluate implementation of the Paris Agreement > Results > Global emissions gap and for seven large G20 countries
hedgeddirectn = 7- Asserted: passes — The authors put it forward as true.
- Checkable: passes — It can be checked against evidence.
- Load-bearing: passes — The paper’s conclusions depend on it.
- Based: passes — The paper gives a reason why it holds.
It may state two separate claims as one.
- The authors state this as an assumption: The 2 °C and 1.5 °C pathways are calculated assuming cost-optimal implementation.
A result the paper reports from its own data — it cites no other source for it, so there is none to check. The quote shows it is in the paper.
In the paper
“In contrast, effort-sharing approaches based on equity principles would lead to lower allowance of cumulative emissions in the EU, Japan, the Russian Federation and the United States, and to higher allowances for India (see Supplementary Fig. 3), resulting in an opposite impact on the gap between national policies and these allowances.”
§ Taking stock of national climate policies to evaluate implementation of the Paris Agreement > Discussion
hedgeddirect- Asserted: passes — The authors put it forward as true.
- Checkable: passes — It can be checked against evidence.
- Load-bearing: unclear — It is unclear whether the paper’s conclusions depend on it.
- Based: passes — The paper gives a reason why it holds.
It may state two separate claims as one.
None of the sources cited for this claim have been checked yet.
In the paper
“The results from this study show that, for national policies, greenhouse gas emissions by 2030 would be somewhat higher and for well below 2 °C scenarios lower than earlier studies indicated2,4,42”
§ Taking stock of national climate policies to evaluate implementation of the Paris Agreement > Methods > Results
What the sources say
- Not checked yetcites [2] Rogelj, J. et al. Paris Agreement climate proposals need a boost to keep warming well below 2 degrees C. Nature 534, 631–639 (2016). source
- Not checked yetcites [4] Vandyck, T., Keramidas, K., Saveyn, B., Kitous, A. & Vrontisi, Z. A global stocktake of the Paris pledges: Implications for energy systems and economy. Glob. Environ. Change 41, 46–63 (2016). source
- Not checked yetcites [42] van Soest, H. L. et al. Early action on Paris Agreement allows for more time to change energy systems. Clim. Change 144, 165–179 (2017). source
hedged- Asserted: passes — The authors put it forward as true.
- Checkable: passes — It can be checked against evidence.
- Load-bearing: passes — The paper’s conclusions depend on it.
- Based: passes — The paper gives a reason why it holds.
It may state two separate claims as one.
A result the paper reports from its own data — it cites no other source for it, so there is none to check. The quote shows it is in the paper.
In the paper
“Projections for final energy intensity give a different picture, where the difference between the National policies scenario and the 2 °C scenarios are small for the European Union, Japan and the United States, somewhat larger (and more uncertain) for Brazil, and largest for China, India and the Russian Federation (See Fig. 3).”
§ Taking stock of national climate policies to evaluate implementation of the Paris Agreement > Results > Global emissions gap and for seven large G20 countries
plainn = 7- Asserted: passes — The authors put it forward as true.
- Checkable: passes — It can be checked against evidence.
- Load-bearing: unclear — It is unclear whether the paper’s conclusions depend on it.
- Based: passes — The paper gives a reason why it holds.
It may state two separate claims as one.
- The authors state this as an assumption: The 2 °C and 1.5 °C pathways are calculated assuming cost-optimal implementation.
A result the paper reports from its own data — it cites no other source for it, so there is none to check. The quote shows it is in the paper.
In the paper
“Global annual mitigation costs per GDP by 2030, under the national policies scenario, are small, and increase to 0.9% (0.3%–2.2%) under the 2 °C scenario, and to 1.3% (1.0%–4.0%) under the 1.5 °C scenario (see Fig. 3).”
§ Taking stock of national climate policies to evaluate implementation of the Paris Agreement > Results > Global emissions gap and for seven large G20 countries
plaindirect- Asserted: passes — The authors put it forward as true.
- Checkable: passes — It can be checked against evidence.
- Load-bearing: passes — The paper’s conclusions depend on it.
- Based: passes — The paper gives a reason why it holds.
It may state two separate claims as one.
- The authors state this as an assumption: The 2 °C and 1.5 °C pathways are calculated assuming cost-optimal implementation.
A result the paper reports from its own data — it cites no other source for it, so there is none to check. The quote shows it is in the paper.
In the paper
“Between 42 and 94% of the high-impact policies from the seven G20 economies were implemented in the nine IAMs considered in this paper, and are estimated to represent 50 to 100% of possible greenhouse gas reductions (see Supplementary Note 2 and Supplementary Table 5).”
§ Taking stock of national climate policies to evaluate implementation of the Paris Agreement > Methods > Scenarios
hedgeddirect- Asserted: passes — The authors put it forward as true.
- Checkable: passes — It can be checked against evidence.
- Load-bearing: passes — The paper’s conclusions depend on it.
- Based: passes — The paper gives a reason why it holds.
It may state two separate claims as one.
- The authors state this as an assumption: If a policy instrument would end before the policy target year, the instrument is assumed to continue until the target year of the aspirational goal.
- The authors state this as an assumption: Where a G20 country is part of a larger model region, the policy indicator is aggregated by assuming business-as-usual for those countries without policies and implementation of the policy for countries with policies.
- The authors state this as an assumption: Equivalent effort after 2030 is assumed, defined as a constant percentage reduction relative to the No new policies scenario or similar forms of continued ambition.
A result the paper reports from its own data — it cites no other source for it, so there is none to check. The quote shows it is in the paper.
In the paper
“This is respectively a global reduction of 36% (23–49%) and 45% (33–65%) by 2030 relative to the national policies scenario.”
§ Taking stock of national climate policies to evaluate implementation of the Paris Agreement > Results > Global emissions gap and for seven large G20 countries
plaindirect- Asserted: passes — The authors put it forward as true.
- Checkable: passes — It can be checked against evidence.
- Load-bearing: passes — The paper’s conclusions depend on it.
- Based: passes — The paper gives a reason why it holds.
It may state two separate claims as one.
- The authors state this as an assumption: The 2 °C and 1.5 °C pathways are calculated assuming cost-optimal implementation.
The paper states this without a source or data behind it here, so there is nothing to check it against. The quote shows it is in the paper.
In the paper
“The current policy implementation is weak and includes significant gaps (e.g., industry, freight transport policies).”
§ Taking stock of national climate policies to evaluate implementation of the Paris Agreement > Discussion
plain- Asserted: passes — The authors put it forward as true.
- Checkable: passes — It can be checked against evidence.
- Load-bearing: passes — The paper’s conclusions depend on it.
- Based: passes — The paper gives a reason why it holds.
It may state two separate claims as one.
A result the paper reports from its own data — it cites no other source for it, so there is none to check. The quote shows it is in the paper.
In the paper
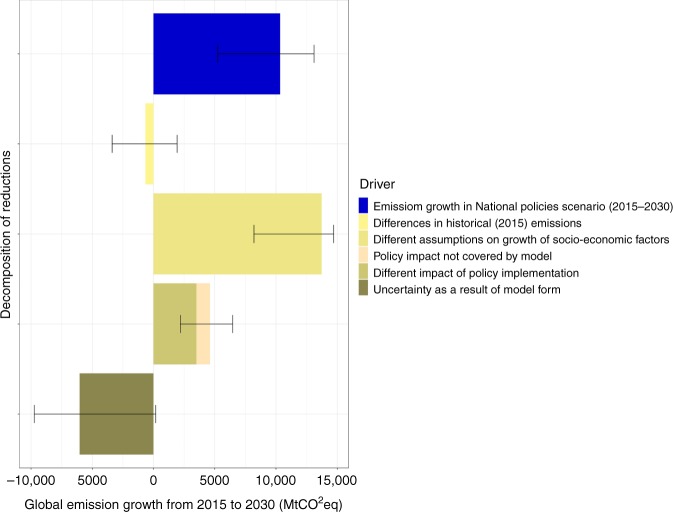
“Of the total impact, the policy impact is around one third, and a somewhat larger part is real uncertainty.”
§ Taking stock of national climate policies to evaluate implementation of the Paris Agreement > Methods > Uncertainty
plain- Asserted: passes — The authors put it forward as true.
- Checkable: passes — It can be checked against evidence.
- Load-bearing: unclear — It is unclear whether the paper’s conclusions depend on it.
- Based: passes — The paper gives a reason why it holds.
It may state two separate claims as one.
A result the paper reports from its own data — it cites no other source for it, so there is none to check. The quote shows it is in the paper.
In the paper
“These numbers are 13.0% (7.2%–24.0%) and 17.5% (12.5%–26.8%) for the 1.5 °C case (see Fig. 3).”
§ Taking stock of national climate policies to evaluate implementation of the Paris Agreement > Results > Global emissions gap and for seven large G20 countries
plaindirect- Asserted: passes — The authors put it forward as true.
- Checkable: passes — It can be checked against evidence.
- Load-bearing: passes — The paper’s conclusions depend on it.
- Based: passes — The paper gives a reason why it holds.
It may state two separate claims as one.
- The authors state this as an assumption: The 2 °C and 1.5 °C pathways are calculated assuming cost-optimal implementation.
A result the paper reports from its own data — it cites no other source for it, so there is none to check. The quote shows it is in the paper.
In the paper
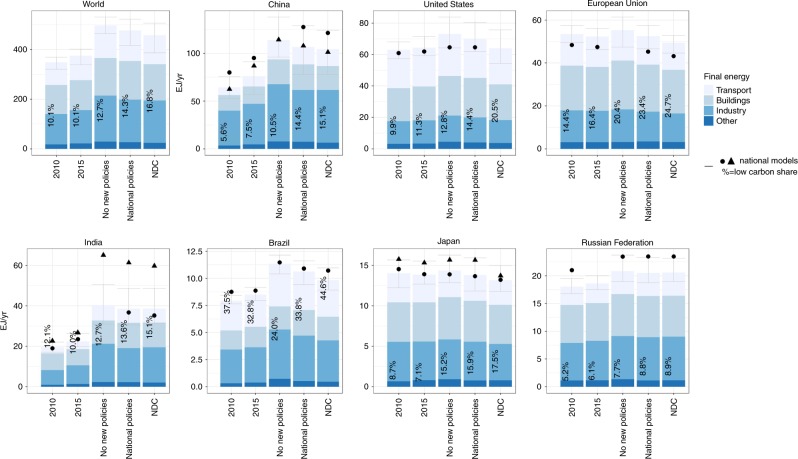
“These gaps can be closed by strongly increasing the low-carbon share of final energy by 5.4 pp for the European Union to 8.5 pp for China to stay below 2 °C, and between 5.4 pp in the European Union to 20.2 pp in China for the 1.5 °C case.”
§ Taking stock of national climate policies to evaluate implementation of the Paris Agreement > Results > Global emissions gap and for seven large G20 countries
boosteddirectn = 7- Asserted: passes — The authors put it forward as true.
- Checkable: passes — It can be checked against evidence.
- Load-bearing: passes — The paper’s conclusions depend on it.
- Based: passes — The paper gives a reason why it holds.
It may state two separate claims as one.
- The authors state this as an assumption: The 2 °C and 1.5 °C pathways are calculated assuming cost-optimal implementation.
The paper states this without a source or data behind it here, so there is nothing to check it against. The quote shows it is in the paper.
In the paper
“Based on this analysis, it can be concluded that assumptions on socio-economic factors explain the largest part of the ranges in the results for 2030; while the differences in policy impact explain about 1/3 of them.”
§ Taking stock of national climate policies to evaluate implementation of the Paris Agreement > Results > Uncertainty range
boosteddirect- Asserted: passes — The authors put it forward as true.
- Checkable: passes — It can be checked against evidence.
- Load-bearing: passes — The paper’s conclusions depend on it.
- Based: passes — The paper gives a reason why it holds.
It may state two separate claims as one.
A result the paper reports from its own data — it cites no other source for it, so there is none to check. The quote shows it is in the paper.
In the paper
“This shows that the impact of historical calibration on the projected global growth in emissions between 2015 and 2030 is small; this growth is much more dependent on socio-economic factors such as GDP and population growth.”
§ Taking stock of national climate policies to evaluate implementation of the Paris Agreement > Methods > Uncertainty
plaindirect- Asserted: passes — The authors put it forward as true.
- Checkable: passes — It can be checked against evidence.
- Load-bearing: unclear — It is unclear whether the paper’s conclusions depend on it.
- Based: passes — The paper gives a reason why it holds.
It may state two separate claims as one.
The paper states this without a source or data behind it here, so there is nothing to check it against. The quote shows it is in the paper.
In the paper
“To close the gap by 2030 with the National policies scenario, the non-fossil share would need to increase by 6.9 pp (4.0%–12.3%) (energy mix gap), and the energy-intensity needs to improve by 9.6% (4.8%–24.7%)) (efficiency improvement gap).”
§ Taking stock of national climate policies to evaluate implementation of the Paris Agreement > Results > Global emissions gap and for seven large G20 countries
hedgeddirect- Asserted: passes — The authors put it forward as true.
- Checkable: passes — It can be checked against evidence.
- Load-bearing: passes — The paper’s conclusions depend on it.
- Based: passes — The paper gives a reason why it holds.
It may state two separate claims as one.
- The authors state this as an assumption: The 2 °C and 1.5 °C pathways are calculated assuming cost-optimal implementation.
A conclusion the paper draws from its own results — it cites no other source for it, so there is none to check. The quote shows it is in the paper.
In the paper
“while this is not the case for the European Union, United States and Brazil, but their ambition gap is smaller as NDCs are close to the cost-optimal 2 °C pathways.”
§ Taking stock of national climate policies to evaluate implementation of the Paris Agreement > Introduction
plaindirectn = 7- Asserted: passes — The authors put it forward as true.
- Checkable: passes — It can be checked against evidence.
- Load-bearing: passes — The paper’s conclusions depend on it.
- Based: passes — The paper gives a reason why it holds.
It may state two separate claims as one.
- The authors state this as an assumption: The 2 °C and 1.5 °C pathways are calculated assuming cost-optimal implementation.
In the paper
“The objective of the Paris Climate Agreement is to hold average global warming to well below 2 °C above pre-industrial levels and to pursue efforts to limit the temperature increase to 1.5 °C1.”
§ Taking stock of national climate policies to evaluate implementation of the Paris Agreement > Introduction
What the sources say
- Not checked yetcites [1] UNFCCC. Paris Agreement, Decision 1/CP.21 (UNFCCC, 2015).
plain- Asserted: passes — The authors put it forward as true.
- Checkable: passes — It can be checked against evidence.
- Load-bearing: passes — The paper’s conclusions depend on it.
- Based: passes — The paper gives a reason why it holds.
Probably not a substantial claim. It may state two separate claims as one.
What the paper did — it cites no source for this, so there is none to check. The quote shows it is in the paper.
In the paper
“To evaluate the coherence of the national pathways, we compared the aggregated results of the integrated assessment models with similar runs of national models for the same countries.”
§ Taking stock of national climate policies to evaluate implementation of the Paris Agreement > Introduction
plain- Asserted: passes — The authors put it forward as true.
- Checkable: passes — It can be checked against evidence.
- Load-bearing: passes — The paper’s conclusions depend on it.
- Based: passes — The paper gives a reason why it holds.
Probably not a substantial claim.
A conclusion the paper draws from its own results — it cites no other source for it, so there is none to check. The quote shows it is in the paper.
In the paper
“which would close the global implementation gap, but would still leave a significant ambition gap.”
§ Taking stock of national climate policies to evaluate implementation of the Paris Agreement > Introduction
hedgeddirect- Asserted: passes — The authors put it forward as true.
- Checkable: passes — It can be checked against evidence.
- Load-bearing: passes — The paper’s conclusions depend on it.
- Based: passes — The paper gives a reason why it holds.
It may state two separate claims as one.
- The authors state this as an assumption: The 2 °C and 1.5 °C pathways are calculated assuming cost-optimal implementation.
None of the sources cited for this claim have been checked yet.
In the paper
“Previous studies have highlighted that taken together, the NDCs and national policies fall significantly short of the overall ambition of the Paris Agreement2–4.”
§ Taking stock of national climate policies to evaluate implementation of the Paris Agreement > Introduction
What the sources say
- Not checked yetcites [2] Rogelj, J. et al. Paris Agreement climate proposals need a boost to keep warming well below 2 degrees C. Nature 534, 631–639 (2016). source
- Not checked yetcites [3] Vrontisi, Z. et al. Enhancing global climate policy ambition towards a 1.5 °C stabilization: a short-term multi-model assessment. Environ. Res. Lett. 13, 44039 (2018). source
- Not checked yetcites [4] Vandyck, T., Keramidas, K., Saveyn, B., Kitous, A. & Vrontisi, Z. A global stocktake of the Paris pledges: Implications for energy systems and economy. Glob. Environ. Change 41, 46–63 (2016). source
plain- Asserted: passes — The authors put it forward as true.
- Checkable: passes — It can be checked against evidence.
- Load-bearing: passes — The paper’s conclusions depend on it.
- Based: passes — The paper gives a reason why it holds.
Probably not a substantial claim.
In the paper
“The nine integrated assessment models (see Methods) used in this study have all submitted data for the 1.5 °C scenarios to the IPCC 1.5 °C report9.”
§ Taking stock of national climate policies to evaluate implementation of the Paris Agreement > Introduction
What the sources say
- Not checked yetcites [9] IPCC. Chapter 2: Mitigation Pathways Compatible with 1.5 °C in the Context of Sustainable Development (IPCC, 2018).
plain- Asserted: passes — The authors put it forward as true.
- Checkable: passes — It can be checked against evidence.
- Load-bearing: fails — The paper’s conclusions may not depend on it.
- Based: passes — The paper gives a reason why it holds.
Probably not a substantial claim. The paper’s conclusions may not depend on it.
What the paper did — it cites no source for this, so there is none to check. The quote shows it is in the paper.
In the paper
“Such a multi-model approach using a range of model types (simulation/optimisation, general or partial equilibrium) adds to the robustness of the assessment.”
§ Taking stock of national climate policies to evaluate implementation of the Paris Agreement > Introduction
plaindirect- Asserted: passes — The authors put it forward as true.
- Checkable: fails — It may be too vague to check against evidence.
- Load-bearing: passes — The paper’s conclusions depend on it.
- Based: fails — The paper may give no reason why it holds.
Probably not a substantial claim. It may be too vague to check against evidence. The paper may give no reason why it holds.
In the paper
“This range is a result of the differences in historical emissions21, different assumptions about socio-economic growth rates, different impact of policy implementation in models, and finally real uncertainty as a result of structural model differences (see Methods).”
§ Taking stock of national climate policies to evaluate implementation of the Paris Agreement > Results > Uncertainty range
What the sources say
- Not checked yetcites [21] Rogelj, J. et al. Understanding the origin of Paris Agreement emission uncertainties. Nat. Commun. 8, 15748 (2017). source
plaindirect- Asserted: passes — The authors put it forward as true.
- Checkable: passes — It can be checked against evidence.
- Load-bearing: passes — The paper’s conclusions depend on it.
- Based: passes — The paper gives a reason why it holds.
It may state two separate claims as one.
A conclusion the paper draws from its own results — it cites no other source for it, so there is none to check. The quote shows it is in the paper.
In the paper
“The result is implementation of measures in countries where this is cheapest, but this does not imply that the implementing country would need to face all the costs.”
§ Taking stock of national climate policies to evaluate implementation of the Paris Agreement > Methods > Effort-sharing
plaindirect- Asserted: passes — The authors put it forward as true.
- Checkable: passes — It can be checked against evidence.
- Load-bearing: fails — The paper’s conclusions may not depend on it.
- Based: passes — The paper gives a reason why it holds.
Probably not a substantial claim. The paper’s conclusions may not depend on it. It may state two separate claims as one.
A conclusion the paper draws from its own results — it cites no other source for it, so there is none to check. The quote shows it is in the paper.
In the paper
“These costs can be shared, and thus financed by other countries.”
§ Taking stock of national climate policies to evaluate implementation of the Paris Agreement > Methods > Effort-sharing
plaindirect- Asserted: passes — The authors put it forward as true.
- Checkable: passes — It can be checked against evidence.
- Load-bearing: fails — The paper’s conclusions may not depend on it.
- Based: passes — The paper gives a reason why it holds.
Probably not a substantial claim. The paper’s conclusions may not depend on it. It may state two separate claims as one.
In the paper
“MAC cost measures tend to exclude existing distortions in the economy42.”
§ Taking stock of national climate policies to evaluate implementation of the Paris Agreement > Methods > Indicators to track progress
What the sources say
- Not checked yetcites [42] van Soest, H. L. et al. Early action on Paris Agreement allows for more time to change energy systems. Clim. Change 144, 165–179 (2017). source
plain- Asserted: passes — The authors put it forward as true.
- Checkable: passes — It can be checked against evidence.
- Load-bearing: fails — The paper’s conclusions may not depend on it.
- Based: passes — The paper gives a reason why it holds.
Probably not a substantial claim. The paper’s conclusions may not depend on it.
A conclusion the paper draws from its own results — it cites no other source for it, so there is none to check. The quote shows it is in the paper.
In the paper
“If less cooperation between countries is assumed, a different allocation would increase total costs of implementation.”
§ Taking stock of national climate policies to evaluate implementation of the Paris Agreement > Discussion
hedgeddirect- Asserted: passes — The authors put it forward as true.
- Checkable: passes — It can be checked against evidence.
- Load-bearing: fails — The paper’s conclusions may not depend on it.
- Based: passes — The paper gives a reason why it holds.
Probably not a substantial claim. The paper’s conclusions may not depend on it.
A conclusion the paper draws from its own results — it cites no other source for it, so there is none to check. The quote shows it is in the paper.
In the paper
“In all, 2 °C and 1.5 °C pathways in this study are calculated assuming cost-optimal implementation, but it might not be the most realistic approach to deriving national reduction targets, as it would typically lead to relatively high costs in low-income countries.”
§ Taking stock of national climate policies to evaluate implementation of the Paris Agreement > Discussion
hedgedconditional- Asserted: passes — The authors put it forward as true.
- Checkable: passes — It can be checked against evidence.
- Load-bearing: fails — The paper’s conclusions may not depend on it.
- Based: passes — The paper gives a reason why it holds.
Probably not a substantial claim. The paper’s conclusions may not depend on it. It may state two separate claims as one.
- The authors state this as an assumption: The 2 °C and 1.5 °C pathways are calculated assuming cost-optimal implementation.
A conclusion the paper draws from its own results — it cites no other source for it, so there is none to check. The quote shows it is in the paper.
In the paper
“If cost-effective climate policy would be adopted, emission trading or transnational climate financing could still ensure a cost-optimal implementation.”
§ Taking stock of national climate policies to evaluate implementation of the Paris Agreement > Discussion
hedgedconditional- Asserted: passes — The authors put it forward as true.
- Checkable: passes — It can be checked against evidence.
- Load-bearing: fails — The paper’s conclusions may not depend on it.
- Based: fails — The paper may give no reason why it holds.
Probably not a substantial claim. The paper’s conclusions may not depend on it. The paper may give no reason why it holds.
A conclusion the paper draws from its own results — it cites no other source for it, so there is none to check. The quote shows it is in the paper.
In the paper
“In order to do so, all countries would need to accelerate the implementation of renewable technologies, while efficiency improvements are especially important in emerging countries (China, India, Brazil) and fossil-fuel-dependent countries (Russian Federation).”
§ Taking stock of national climate policies to evaluate implementation of the Paris Agreement > Discussion
hedgeddirect- Asserted: passes — The authors put it forward as true.
- Checkable: fails — It may be too vague to check against evidence.
- Load-bearing: passes — The paper’s conclusions depend on it.
- Based: passes — The paper gives a reason why it holds.
Probably not a substantial claim. It may be too vague to check against evidence. It may state two separate claims as one.
What the paper did — it cites no source for this, so there is none to check. The quote shows it is in the paper.
In the paper
“We have compared the results of the global models also to the outcomes of the same scenarios from national models from each individual country. These results confirm the above trends, although the absolute levels differ in a few cases (Figs. 1 and 2)”
§ Taking stock of national climate policies to evaluate implementation of the Paris Agreement > Results > Impact of national policies for seven large G20 economies
plaincorrelational- Asserted: passes — The authors put it forward as true.
- Checkable: passes — It can be checked against evidence.
- Load-bearing: unclear — It is unclear whether the paper’s conclusions depend on it.
- Based: passes — The paper gives a reason why it holds.
It may state two separate claims as one.
None of the sources cited for this claim have been checked yet.
In the paper
“Previous literature has shown that inadequate near-term reduction efforts imply that a substantially higher rate of transformation will be needed to comply with the 2 °C limit11, stranded assets25 and substantially higher mitigation costs in the long term, and reduced techno-economic mitigation potential due to carbon lock-in26.”
§ Taking stock of national climate policies to evaluate implementation of the Paris Agreement > Discussion
What the sources say
- Not checked yetcites [11] Riahi, K. et al. Locked into Copenhagen pledges—implications of short-term emission targets for the cost and feasibility of long-term climate goals. Technol. Forecast. Soc. Change 90, 8–23 (2015). source
- Not checked yetcites [25] Mercure, J. F. et al. Macroeconomic impact of stranded fossil fuel assets. Nat. Clim. Change 8, 588–593 (2018). source
- Not checked yetcites [26] Davis, S. J., Caldeira, K. & Matthews, H. D. Future CO2 emissions and climate change from existing energy infrastructure. Science 329, 1330–1333 (2010). source
plaindirect- Asserted: passes — The authors put it forward as true.
- Checkable: passes — It can be checked against evidence.
- Load-bearing: fails — The paper’s conclusions may not depend on it.
- Based: passes — The paper gives a reason why it holds.
Probably not a substantial claim. The paper’s conclusions may not depend on it. It may state two separate claims as one.
A conclusion the paper draws from its own results — it cites no other source for it, so there is none to check. The quote shows it is in the paper.
In the paper
“Unless governments increase ambition, the collective effort of current national policies significantly stays short of the objectives of the Paris Agreement and even fails to meet the joint ambition secured in NDCs.”
§ Taking stock of national climate policies to evaluate implementation of the Paris Agreement > Discussion
plainconditional- Asserted: passes — The authors put it forward as true.
- Checkable: passes — It can be checked against evidence.
- Load-bearing: passes — The paper’s conclusions depend on it.
- Based: passes — The paper gives a reason why it holds.
It may state two separate claims as one.
What the paper did — it cites no source for this, so there is none to check. The quote shows it is in the paper.
In the paper
“Note that very recent policy updates since 2017, or planned policies in the pipeline to be implemented were not included.”
§ Taking stock of national climate policies to evaluate implementation of the Paris Agreement > Results > Impact of national policies for seven large G20 economies
plain- Asserted: passes — The authors put it forward as true.
- Checkable: passes — It can be checked against evidence.
- Load-bearing: passes — The paper’s conclusions depend on it.
- Based: passes — The paper gives a reason why it holds.
Probably not a substantial claim.
None of the sources cited for this claim have been checked yet.
In the paper
“Integrated assessment models (IAMs) describe key processes in the interaction of human development and natural environment and are designed to assess the implications of achieving climate objectives2,34.”
§ Taking stock of national climate policies to evaluate implementation of the Paris Agreement > Methods > Integrated assessment models
What the sources say
- Not checked yetcites [2] Rogelj, J. et al. Paris Agreement climate proposals need a boost to keep warming well below 2 degrees C. Nature 534, 631–639 (2016). source
- Not checked yetcites [34] UNEP. The Emissions Gap report 2016 (UNEP, 2016).
plain- Asserted: passes — The authors put it forward as true.
- Checkable: passes — It can be checked against evidence.
- Load-bearing: fails — The paper’s conclusions may not depend on it.
- Based: passes — The paper gives a reason why it holds.
Probably not a substantial claim. The paper’s conclusions may not depend on it. It may state two separate claims as one.
The paper relies on this without support.
The success of the Paris Agreement critically depends on the implementation of climate policies at the national level.
“While this objective is formulated at the global level, the success of the agreement critically depends on the implementation of climate policies at the national level.”
The authors state this as an assumption.
Countries pursue the same national efforts between 2030 and 2050 under the National policies scenario by keeping total percentage emission reductions relative to the No new policies scenario constant.
“and in addition assume countries pursue the same national efforts between 2030 and 2050 under the National policies scenario by keeping total percentage emission reductions relative to the No new policies scenario constant.”
The authors state this as an assumption.
The 2 °C and 1.5 °C pathways are calculated assuming cost-optimal implementation.
“In all, 2 °C and 1.5 °C pathways in this study are calculated assuming cost-optimal implementation”
The authors state this as an assumption.
If a policy instrument would end before the policy target year, the instrument is assumed to continue until the target year of the aspirational goal.
“If the policy instrument would end before the policy target year, we assumed continuation of this instrument until the target year of the aspirational goal.”
The authors state this as an assumption.
Where a G20 country is part of a larger model region, the policy indicator is aggregated by assuming business-as-usual for those countries without policies and implementation of the policy for countries with policies.
“In case a G20 country is part of a larger model region, the policy (indicator) is aggregated by assuming business-as-usual for those countries without policies, and implementation of the policy for countries with policies32.”
The authors state this as an assumption.
Equivalent effort after 2030 is assumed, defined as a constant percentage reduction relative to the No new policies scenario or similar forms of continued ambition.
“The national policies were implemented for the period from 2010 to 2030, and equivalent effort was assumed after 2030.”
Claims other papers make about this one
Each is checked against this paper’s own text: does it say what the citing paper says it does?
In the citing paper
“Localized climate goals have been enacted in countries with robust federal climate goals (3).”
From A framework for localizing global climate solutions and their carbon reduction potential (2021) · cites this paper as [3]
Self-check
Percentages, sums and reported differences re-computed from the paper’s own numbers.
Each contradiction between two passages listed here was confirmed by an independent check.
Rated major: it would touch a result — a value a result rests on, reported and recomputed p-values on opposite sides of the significance level, two passages that conflict with no sign which is right, or a cited work retracted before this paper was published.
In the paper
§ Taking stock of national climate policies to evaluate implementation of the Paris Agreement > Results > Impact of national policies for seven large G20 economies
“Policy implementation is estimated to result in reductions of 0% (0–2%) for the Russian Federation to 10% (4–12%) for the United States, relative to the no new policies scenario (see Table 2).”
§ Taking stock of national climate policies to evaluate implementation of the Paris Agreement > Results > Global implementation and total emissions gap
“| United States | 0.4 (0.3, 1.2) | 6 (4, 13) | 2.1 (1.5, 3.2) | 31 (22, 38) |”
Rated major: it would touch a result — a value a result rests on, reported and recomputed p-values on opposite sides of the significance level, two passages that conflict with no sign which is right, or a cited work retracted before this paper was published.
In the paper
§ Taking stock of national climate policies to evaluate implementation of the Paris Agreement > Results > Impact of national policies for seven large G20 economies
“Implementation of national policies still leaves an implementation gap with NDCs of 3% (3–7%) for the Russian Federation to 28% (22–37%) for the United States (see Table 2).”
§ Taking stock of national climate policies to evaluate implementation of the Paris Agreement > Results > Global implementation and total emissions gap
“| United States | 0.4 (0.3, 1.2) | 6 (4, 13) | 2.1 (1.5, 3.2) | 31 (22, 38) |”
Rated minor: it would not touch a result — a value no result rests on, a p-value that stays on the same side of the significance level, or a conflict that is clerical, resolved elsewhere in the paper, or outside its own findings.
In the paper
§ Taking stock of national climate policies to evaluate implementation of the Paris Agreement > Results > Global implementation and total emissions gap
“| | Absolute emissions gap between national policies and 2 °C scenarios | Absolute emissions gap between national policies and 2 °C scenarios | Emissions gap in percentages between national policies and 1.5 °C scenarios | Emissions gap in percentages between national policies and 2 °C scenarios |”
§ Taking stock of national climate policies to evaluate implementation of the Paris Agreement > Results > Global emissions gap and for seven large G20 countries
“and 28.2 GtCO2eq (19.8–42.2) for the 1.5 °C limit (see Table 3 and Fig. 3). This is respectively a global reduction of 36% (23–49%) and 45% (33–65%) by 2030 relative to the national policies scenario.”
Rated minor: it would not touch a result — a value no result rests on, a p-value that stays on the same side of the significance level, or a conflict that is clerical, resolved elsewhere in the paper, or outside its own findings.
In the paper
§ Taking stock of national climate policies to evaluate implementation of the Paris Agreement > Results > Impact of national policies for seven large G20 economies
“Implementation of national policies still leaves an implementation gap with NDCs of 3% (3–7%) for the Russian Federation to 28% (22–37%) for the United States (see Table 2).”
§ Taking stock of national climate policies to evaluate implementation of the Paris Agreement > Results > Global implementation and total emissions gap
“| Russian Federation | 0.0 (0, 0) | 0 (0, 2) | 0.1 (–0.1, 0.2) | 3 (–3, 7) |”
Citations
Cites
Paris Agreement climate proposals need a boost to keep warming well below 2 °C
Rogelj, J., den Elzen, M., Höhne, N., Fransen, T., Fekete, H., Winkler, H., Schaeffer, R., Sha, F., Riahi, K., & Meinshausen, M. (2016) · Nature · doi:10.1038/nature18307 · Cited by 3,637
Self-citationClimate change 2007 - mitigation of climate change
Metz, B., Davidson, O. R., Bösch, P., Dave, R., & Meyer, L. (2007) · Cited by 3,484
Carbon emissions from land use and land-cover change
Houghton, R. A., House, J. I., Pongratz, J., van der Werf, G. R., DeFries, R., Hansen, M. C., Quéré, C. L., & Ramankutty, N. (2012) · Biogeosciences · doi:10.5194/bg-9-5125-2012 · Cited by 1,437
Future CO 2 Emissions and Climate Change from Existing Energy Infrastructure
Davis, S. J., Caldeira, K., & Matthews, H. D. (2010) · Science · doi:10.1126/science.1188566 · Cited by 1,399
Fricko, O., Havlik, P., Rogelj, J., Klimont, Z., Gusti, M., Johnson, N., Kolp, P., Strubegger, M., Valin, H., Amann, M., et al. (2017) · Global Environmental Change · doi:10.1016/j.gloenvcha.2016.06.004 · Cited by 1,075
Self-citationInstrument Choice in Environmental Policy
Goulder, L. H., & Parry, I. W. H. (2008) · Review of Environmental Economics and Policy · doi:10.1093/reep/ren005 · Cited by 891
The key role of forests in meeting climate targets requires science for credible mitigation
Grassi, G., House, J. I., Dentener, F. J., Federici, S., den Elzen, M. G. J., & Penman, J. M. (2017) · Nature Climate Change · doi:10.1038/nclimate3227 · Cited by 655
Kriegler, E., Edmonds, J., Stéphane Hallegatte, A., Ebi, K. L., Kram, T., Riahi, K., Winkler, H., & van Vuuren, D. P. (2014) · Climatic Change · doi:10.1007/s10584-013-0971-5 · Cited by 589
Self-citationResidual fossil CO2 emissions in 1.5–2 °C pathways
Luderer, G., Vrontisi, Z., Bertram, C., Edelenbosch, O. Y., Pietzcker, R. C., Rogelj, J., De Boer, H. S., Drouet, L., Emmerling, J., Fricko, O., et al. (2018) · Nature Climate Change · doi:10.1038/s41558-018-0198-6 · Cited by 575
Self-citationDrivers of declining CO2 emissions in 18 developed economies
Quéré, C. L., Korsbakken, J. I., Wilson, C., Tosun, J., Andrew, R. M., Andres, R. J., Canadell, J. G., Jordan, A., Peters, G. P., & van Vuuren, D. P. (2019) · Nature Climate Change · doi:10.1038/s41558-019-0419-7 · Cited by 548
Research works printed but not linked: 4
- IPCC. Chapter 2: Mitigation Pathways Compatible with 1.5 °C in the Context of Sustainable Development (IPCC, 2018).
- Blanco, G. et al. In Climate Change 2014: Mitigation of Climate Change (Cambridge University Press, Cambridge, United Kingdom and New York, NY, USA, 2014).
- Kitous, A., Keramidas, K., Vandyck, T. & Saveyn, B. GECO 2016. Global Energy and Climate Outlook. Road from Paris. Impact of Climate Policies on Global Energy Markets in the Context of the UNFCCC Paris Agreement. JRC Science for policy report. https://doi.org/10.2791/662470 (2016). · DOI
- FAOSTAT. Food and agriculture data, http://faostat3.fao.org/home/E. Vol. 2017 FAOSTAT provides free access to food and agriculture (FAOSTAT, 2017).
Cited by
Sorted by citations
Items 101–200 of 467
Rafaj, P., Kiesewetter, G., Krey, V., Schöpp, W., Bertram, C., Drouet, L., Fricko, O., Fujimori, S., Harmsen, M. J. H. M., Hilaire, J., et al. (2021) · Environmental Research Letters · doi:10.1088/1748-9326/abdf0b · Cited by 46
Self-citationPolicy sequencing towards carbon pricing among the world’s largest emitters
Linsenmeier, M., Mohommad, A., & Schwerhoff, G. (2022) · Nature Climate Change · doi:10.1038/s41558-022-01538-8 · Cited by 41
Probability of Achieving NDC and Implications for Climate Policy: CO-STIRPAT Approach
Jin, I. (2023) · Journal of Economic Analysis · doi:10.58567/jea02040005 · Cited by 41
de Almeida, D. M. F., Carvalho, L., Ferreira, P., Dionísio, A., & Haq, I. U. (2024) · Sustainability · doi:10.3390/su16209089 · Cited by 45
Deng, Z., Hu, Y., Wang, X., Li, C., Wang, J., He, P., Wang, Z., & Bryan, B. A. (2025) · Nature Communications · doi:10.1038/s41467-025-59275-3 · Cited by 46
Zhao, W., Kinouchi, T., & Nguyễn, H. Q. (2021) · Journal of Hydrology · doi:10.1016/j.jhydrol.2021.126461 · Cited by 42
A research and development investment strategy to achieve the Paris climate agreement
Reis, L. A., Vrontisi, Z., Verdolini, E., Fragkiadakis, K., & Tavoni, M. (2023) · Nature Communications · doi:10.1038/s41467-023-38620-4 · Cited by 39
Self-citationFang, G., Wang, L., Gao, Z., Chen, J., & Tian, L. (2022) · Environmental Science and Pollution Research · doi:10.1007/s11356-022-20958-9 · Cited by 39
Climate Policy Ambition: Exploring A Policy Density Perspective
Schaub, S., Tosun, J., Jordan, A., & Enguer, J. (2022) · Politics and Governance · doi:10.17645/pag.v10i3.5347 · Cited by 38
Contrasting suitability and ambition in regional carbon mitigation
Liu, Y., Du, M., Cui, Q., Liu, Y., Liu, Q., Liu, Q., Tong, D., Feng, K., & Hubacek, K. (2022) · Nature Communications · doi:10.1038/s41467-022-31729-y · Cited by 39
Perdana, S., & Marc Vielle, B. (2023) · Environmental Economics and Policy Studies · doi:10.1007/s10018-023-00361-5 · Cited by 42
Roelfsema, M., van Soest, H. L., den Elzen, M. G. J., de Coninck, H., Kuramochi, T., Harmsen, M. J. H. M., Dafnomilis, I., Höhne, N., & van Vuuren, D. P. (2022) · Environmental Science & Policy · doi:10.1016/j.envsci.2022.05.001 · Cited by 42
Self-citationZhang, Q., Mao, X., Lu, J., Guo, Z. P., Duman, Z., Chen, Y., Song, P., & Tu, K. (2023) · Applied Energy · doi:10.1016/j.apenergy.2023.122415 · Cited by 36
Advances in understanding of air–sea exchange and cycling of greenhouse gases in the upper ocean
Bange, H. W., Mongwe, P., Shutler, J. D., Arévalo-Martínez, D. L., Bianchi, D., Lauvset, S. K., Liu, C., Löscher, C. R., Martins, H., Rosentreter, J. A., et al. (2024) · Elementa Science of the Anthropocene · doi:10.1525/elementa.2023.00044 · Cited by 36
Heterogeneous pressure on croplands from land-based strategies to meet the 1.5 °C target
Gao, P., Gao, Y., Ou, Y., McJeon, H. C., Iyer, G. C., Ye, S., Yang, X., & Song, C. (2025) · Nature Climate Change · doi:10.1038/s41558-025-02294-1 · Cited by 35
Self-citationWei, Y., Zhao, T., Wang, J., & Zhang, X. (2021) · Environmental Science and Pollution Research · doi:10.1007/s11356-021-12599-1 · Cited by 35
Sweden’s Climate Act – its origin and emergence
Karlsson, M. (2021) · Climate Policy · doi:10.1080/14693062.2021.1922339 · Cited by 35
Chen, X., Yang, F., Zhang, S., Zakeri, B., Chen, X., Liu, C.-Y., & Hou, F. (2021) · Energy · doi:10.1016/j.energy.2021.121024 · Cited by 35
Herc, L., Pfeifer, A., Feijoo, F., & Duić, N. (2021) · e-Prime - Advances in Electrical Engineering Electronics and Energy · doi:10.1016/j.prime.2021.100024 · Cited by 34
Targeted Green Recovery Measures in a Post-COVID-19 World Enable the Energy Transition
Dafnomilis, I., Chen, H.-H., den Elzen, M. G. J., Fragkos, P. F., Chewpreecha, U., van Soest, H. L., Fragkiadakis, K., Karkatsoulis, P., Paroussos, L., de Boer, H. S., et al. (2022) · Frontiers in Climate · doi:10.3389/fclim.2022.840933 · Cited by 34
Self-citationTschötschel, R., Schuck, A. R. T., Schwinges, A., & Wonneberger, A. (2021) · Journal of Environmental Psychology · doi:10.1016/j.jenvp.2021.101655 · Cited by 33
Wright, S. J., Sietsma, A. J., Eguren, S. K., Athanasiadis, I. N., & Biesbroek, R. G. (2023) · Regional Environmental Change · doi:10.1007/s10113-023-02113-3 · Cited by 37
Shared insights for heat health risk adaptation in metropolitan areas of developing countries
Wen-bo, Y., Yang, J., Sun, D., Xue, B., Sun, W., Ren, J., Yu, H., Xiao, X., Xia, J. C., & Li, X. (2024) · iScience · doi:10.1016/j.isci.2024.109728 · Cited by 31
Scotti, F., Flori, A., Crescenzi, R., & Fabio Pammolli, A. (2024) · Climate Policy · doi:10.1080/14693062.2024.2366894 · Cited by 31
Wiedenhofer, D., Streeck, J., Wiese, F., Verdolini, E., Mastrucci, A., Ju, Y., Boza‐Kiss, B., Min, J., Norman, J., Wieland, H., et al. (2025) · Annual Review of Environment and Resources · doi:10.1146/annurev-environ-111523-102441 · Cited by 38
Self-citationTemperatures and health costs of emergency department visits: A multisite time series study in China
Wang, Y., Liu, Y., Ye, D., Li, N., Bi, P., Tong, S., Wang, Y., Cheng, Y., Li, Y., & Yao, X. (2021) · Environmental Research · doi:10.1016/j.envres.2021.111023 · Cited by 31
Pahle, M., Schaeffer, R., Pachauri, S., Eom, J., Awasthy, A., Chen, W., Maria, C. D., Jiang, K., He, C., Portugal‐Pereira, J., et al. (2021) · Energy Policy · doi:10.1016/j.enpol.2021.112662 · Cited by 31
Self-citationThe Continuing Case for a Polycentric Approach for Coping with Climate Change
Lofthouse, J. K., & Herzberg, R. Q. (2023) · Sustainability · doi:10.3390/su15043770 · Cited by 36
Shi, Y., Feng, D., Yu, S., Fang, C., Li, H., & Zhou, Y. L. (2022) · Journal of Cleaner Production · doi:10.1016/j.jclepro.2022.132673 · Cited by 30
MUSE: An open-source agent-based integrated assessment modelling framework
Giarola, S., Sachs, J., d’Avezac, M., Kell, A., & Hawkes, A. D. (2022) · Energy Strategy Reviews · doi:10.1016/j.esr.2022.100964 · Cited by 30
Coal-exit alliance must confront freeriding sectors to propel Paris-aligned momentum
Bi, S., Bauer, N., & Jewell, J. (2023) · Nature Climate Change · doi:10.1038/s41558-022-01570-8 · Cited by 32
Toward a relational approach in global climate governance: Exploring the role of trust
Suiseeya, K. R. M., Elhard, D. K., & Paul, C. J. (2021) · Wiley Interdisciplinary Reviews Climate Change · doi:10.1002/wcc.712 · Cited by 35
Longa, F. D., Fragkos, P. F., Nogueira, L. P. P., & van der Zwaan, B. (2022) · Computers & Industrial Engineering · doi:10.1016/j.cie.2022.108029 · Cited by 29
The Influence of International Agreements on Disaster Risk Reduction
Raikes, J., Smith, T. F., Baldwin, C. L., & Henstra, D. (2022) · International Journal of Disaster Risk Reduction · doi:10.1016/j.ijdrr.2022.102999 · Cited by 29
Inequality repercussions of financing negative emissions
Andreoni, P., Emmerling, J., & Tavoni, M. (2023) · Nature Climate Change · doi:10.1038/s41558-023-01870-7 · Cited by 28
Self-citationPoverty and inequality implications of carbon pricing under the long-term climate target
Zhao, S.-Y., Fujimori, S., Hasegawa, T., Oshiro, K., & Sasaki, K. (2022) · Sustainability Science · doi:10.1007/s11625-022-01206-y · Cited by 26
Self-citationTeng, L., Xuan, Y., Liu, X., Liu, D., & Ding, Y. (2023) · Renewable and Sustainable Energy Reviews · doi:10.1016/j.rser.2023.113484 · Cited by 29
Li, F., Liu, H., Ma, Y., Xie, X., Wang, Y., & Yang, Y. (2022) · Technological Forecasting and Social Change · doi:10.1016/j.techfore.2022.121897 · Cited by 27
Kearney, S. G., Watson, J. E. M., Reside, A. E., Fisher, D. O., Maron, M., Doherty, T. S., Legge, S., Woinarski, J. C. Z., Garnett, S. T., Wintle, B. A., et al. (2022) · Biological Conservation · doi:10.1016/j.biocon.2022.109833 · Cited by 28
The Impacts of Road Traffic on Urban Carbon Emissions and the Corresponding Planning Strategies
Lei, H., Zeng, S., Namaiti, A., & Zeng, J. J. (2023) · Land · doi:10.3390/land12040800 · Cited by 27
Ren, Q., Li, J., & Albrecht, J. (2024) · Business Strategy and the Environment · doi:10.1002/bse.4019 · Cited by 27
Gutierrez, L. A., Polidoro, B., Obura, D. O., Cavada-Blanco, F., Linardich, C., Pettersson, E., Pearce‐Kelly, P., Kemppinen, K., Alvarado, J. J., Álvarez‐Filip, L., et al. (2024) · PLoS ONE · doi:10.1371/journal.pone.0309354 · Cited by 29
Oshiro, K., & Fujimori, S. (2020) · Sustainability Science · doi:10.1007/s11625-020-00862-2 · Cited by 26
Self-citationThe use of environmental scenarios to project future health effects: a scoping review
Weber, E., Downward, G. S., Ebi, K. L., Lucas, P., & van Vuuren, D. P. (2023) · The Lancet Planetary Health · doi:10.1016/s2542-5196(23)00110-9 · Cited by 29
Zhou, Y., Dan, Z., & Yu, X. (2024) · Energy and Buildings · doi:10.1016/j.enbuild.2024.114004 · Cited by 28
Rajendran, R., Krishnaswamy, J., & Subramaniam, N. (2023) · Renewable and Sustainable Energy Reviews · doi:10.1016/j.rser.2023.113692 · Cited by 25
Demko, J., & Machava, J. (2022) · Sustainability · doi:10.3390/su14063506 · Cited by 24
Uncertainty of biomass stocks in Spanish forests: a comprehensive comparison of allometric equations
Améztegui, A., Rodrígues, M., & Granda, V. (2022) · European Journal of Forest Research · doi:10.1007/s10342-022-01444-w · Cited by 24
Choi, S., Kim, J.-A., Heo, G. S., & Park, H. (2022) · Journal of Molecular Liquids · doi:10.1016/j.molliq.2022.119821 · Cited by 25
Abudu, H., Wesseh, P. K., & Lin, B. (2022) · Environmental Impact Assessment Review · doi:10.1016/j.eiar.2022.106917 · Cited by 24
Bell‐James, J., & Watson, J. E. M. (2025) · Nature Ecology & Evolution · doi:10.1038/s41559-025-02636-4 · Cited by 28
Improved sustainability assessment of the G20’s supply chains of materials, fuels, and food
Cabernard, L., Pfister, S., & Hellweg, S. (2022) · Environmental Research Letters · doi:10.1088/1748-9326/ac52c7 · Cited by 23
Biochar raw material selection and application in the food chain: A review
Yu, D., Niu, J., Zhong, L., Chen, K., Wang, G., Yan, M., Li, D., & Yao, Z. (2022) · The Science of The Total Environment · doi:10.1016/j.scitotenv.2022.155571 · Cited by 23
Regenerative Management of Coastal Tourism Destinations for the Anthropocene
Álvarez, S. (2023) · Journal of Travel Research · doi:10.1177/00472875231173125 · Cited by 24
Attribution of Urban Diurnal Thermal Environmental Change: Importance of Global–Local Effects
Yu, W., Yang, J., Cong, N., Ren, J., Yu, H., Xiao, X., & Xia, J. C. (2023) · IEEE Journal of Selected Topics in Applied Earth Observations and Remote Sensing · doi:10.1109/jstars.2023.3308045 · Cited by 23
Climate Policy Uncertainty and Corporate Sustainability Capability: Evidence From ESG Performance
Liu, X., & Xiang, Y. (2025) · Corporate Social Responsibility and Environmental Management · doi:10.1002/csr.3244 · Cited by 25
Ten new insights in climate science 2020 – a horizon scan
Pihl, E., Alfredsson, E. C., Bengtsson, M., Bowen, K., Broto, V. C., Chou, K.-T., Cleugh, H., Ebi, K. L., Edwards, C. M., Fisher, E., et al. (2021) · Global Sustainability · doi:10.1017/sus.2021.2 · Cited by 22
Proposal of Implementation Framework of Cooperative Approaches and Sustainable Development Mechanism
Deng, H., Su, Y., Liao, Z., & Wu, J. (2022) · Sustainability · doi:10.3390/su14020655 · Cited by 22
Renewable energy drivers in France: a spatial econometric perspective
Damette, O., & Lô, G. D. (2021) · Regional Studies · doi:10.1080/00343404.2021.1998415 · Cited by 22
Tracking carbon intensity changes between China and Japan: Based on the decomposition technique
Li, J., Meng, G., Li, C., & Du, K. (2022) · Journal of Cleaner Production · doi:10.1016/j.jclepro.2022.131090 · Cited by 22
Developing new pathways for energy and environmental decision-making in India: a review
Durga, S., Evans, M., Clarke, L., & Banerjee, R. (2022) · Environmental Research Letters · doi:10.1088/1748-9326/ac6f13 · Cited by 22
Infrastructure Strategies for Achieving the Global Development Agendas in Small Islands
Adshead, D., Roman, O., Thacker, S., & Hall, J. W. (2021) · Earth s Future · doi:10.1029/2020ef001699 · Cited by 22
Ullah, A., Pinglu, C., Khan, S., & Qian, N. (2025) · Sustainable Development · doi:10.1002/sd.3409 · Cited by 25
Heterocycles for direct air capture and MOFs prepared from CO 2 utilization
Du, J., Liu, L., Sun, Q., Song, Z., Yao, A., Ma, J., Chung, T., Xu, W., Zhang, H., & Liu, J. (2024) · Journal of Materials Chemistry A · doi:10.1039/d3ta07024g · Cited by 21
Evaluating the carbon emissions of Hong Kong's building sector from the life cycle perspective
Wang, Y., & Pan, W. (2024) · Building and Environment · doi:10.1016/j.buildenv.2024.111975 · Cited by 20
Abudu, H., Wesseh, P. K., & Lin, B. (2022) · Advances in Climate Change Research · doi:10.1016/j.accre.2022.06.004 · Cited by 20
Energy policy pathways to inform climate policy in Saudi Arabia
Matar, W., Mansouri, N. Y., & Umeozor, E. (2024) · Journal of Cleaner Production · doi:10.1016/j.jclepro.2024.141190 · Cited by 19
The impossible triangle of carbon mitigation policy
Jia, Z., Liu, Y., & Lin, B. (2024) · Energy Policy · doi:10.1016/j.enpol.2024.114107 · Cited by 19
Wojewodzki, M., Cheong, T. S., Shen, J., & Cheng, L. T. W. (2023) · Journal of Environmental Management · doi:10.1016/j.jenvman.2023.118355 · Cited by 19
Assessing enhanced NDC and climate compatible development pathways for India
Vishwanathan, S. S., Fragkos, P. F., Fragkiadakis, K., & GARG, A. K. (2023) · Energy Strategy Reviews · doi:10.1016/j.esr.2023.101152 · Cited by 21
Self-citationWhat determines climate ambition? Analysing NDC enhancement with a mixed-method design
Peterson, L., van Asselt, H., Hermwille, L., & Oberthür, S. (2023) · npj Climate Action · doi:10.1038/s44168-023-00051-8 · Cited by 19
Souza, C. D. O., Angelkorte, G. B., Rochedo, P., & Szklo, A. S. (2021) · Climatic Change · doi:10.1007/s10584-021-03201-1 · Cited by 19
Self-citationPetrielli, G. P., Nogueira, G. P., Henzler, D. D. S., de Souza, N. R. D., Bruno, K. M. B., Luciano, A. C. D. S., Maire, G. L., & Hernandes, T. A. D. (2022) · Resources Conservation and Recycling · doi:10.1016/j.resconrec.2022.106725 · Cited by 18
Glasgow to Paris—The impact of the Glasgow commitments for the Paris climate agreement
Reis, L. A., & Tavoni, M. (2022) · iScience · doi:10.1016/j.isci.2023.105933 · Cited by 18
The impact of policy and model uncertainties on emissions projections of the Paris Agreement pledges
den Elzen, M. G. J., Dafnomilis, I., Hof, A. F., Olsson, M., Beusen, A. H. W., Botzen, W. J. W., Kuramochi, T., Nascimento, L., & Rogelj, J. (2023) · Environmental Research Letters · doi:10.1088/1748-9326/acceb7 · Cited by 18
Oshiro, K., & Fujimori, S. (2024) · Energy and Climate Change · doi:10.1016/j.egycc.2024.100128 · Cited by 19
Self-citationDelley, M., Ha, T. M., Götze, F., Markoni, E., Ngo, M. H., Nguyen, A. D., Bui, T. L., Le, N. T., Pham, B. D., & Brunner, T. A. (2024) · Frontiers in Psychology · doi:10.3389/fpsyg.2024.1286579 · Cited by 20
Draeger, R., Cunha, B. S. L. D., Müller-Casseres, E., Rochedo, P., Szklo, A. S., & Schaeffer, R. (2022) · Energy · doi:10.1016/j.energy.2022.124451 · Cited by 18
Self-citationSewerin, S., Kaack, L. H., Küttel, J., Sigurdsson, F., Martikainen, O., Esshaki, A., & Hafner, F. (2023) · Scientific Data · doi:10.1038/s41597-023-02801-z · Cited by 18
Policy and Regulatory Frameworks for Sustainable Environmental Practices
Ogwu, M. C., Malahi, S. E., & Izah, S. C. (2025) · Environmental science and engineering · doi:10.1007/978-3-031-85327-2_16 · Cited by 17
Pereira, L. M., Morrow, D. R., Aquila, V., Beckage, B., Beckbesinger, S., Beukes, L., Buck, H. J., Carlson, C. J., Geden, O., Jones, A. P., et al. (2021) · Ecology and Society · doi:10.5751/es-12856-260430 · Cited by 17
Sustainable development goals in energy system models: A systematic interlinkages mapping analysis
Zaidan, S., & El‐Fadel, M. (2024) · Journal of Cleaner Production · doi:10.1016/j.jclepro.2024.142638 · Cited by 20
Dunn, J. B., Greene, K., Vasquez-Arroyo, E., Awais, M., Gómez-Sanabria, A., Kyle, P. G., Palatnik, R. R., Schaeffer, R., Zhou, P., Aissaoui, B., et al. (2024) · Environmental Science & Technology Letters · doi:10.1021/acs.estlett.4c00280 · Cited by 17
Self-citationGiannousakis, A., Baumstark, L., & Kriegler, E. (2020) · Climate Policy · doi:10.1080/14693062.2020.1798734 · Cited by 16
Self-citationThe heterogeneous driving forces behind carbon emissions change in 30 selective emerging economies
Li, S., Cui, C., Meng, J., Li, Y., Shan, Y., Zhao, W., Parikh, P., Yao, J., & Guan, D. (2023) · Patterns · doi:10.1016/j.patter.2023.100760 · Cited by 17
Garaffa, R., Weitzel, M., Vandyck, T., Keramidas, K., Dowling, P., Fosse, F., Tchung-Ming, S., Ana, D. V., Ruß, P., Schade, B., et al. (2023) · One Earth · doi:10.1016/j.oneear.2023.10.012 · Cited by 18
Self-citationZhan, S., Zhou, Y. L., Feng, D., Wang, H., & Fang, C. (2024) · IET Renewable Power Generation · doi:10.1049/rpg2.13071 · Cited by 16
Dong, X., & Zhao, Y. (2025) · International Journal of Hydrogen Energy · doi:10.1016/j.ijhydene.2025.01.458 · Cited by 16
O’Flynn, C., Seymour, V., Crawshaw, J., Parrott, T., Reeby, C., & Silva, S. R. P. (2021) · Sustainability · doi:10.3390/su13179954 · Cited by 16
den Elzen, M. G. J., Dafnomilis, I., Forsell, N., Fragkos, P. F., Fragkiadakis, K., Höhne, N., Kuramochi, T., Nascimento, L., Roelfsema, M., van Soest, H. L., et al. (2021) · Research Square · doi:10.21203/rs.3.rs-954654/v1 · Cited by 16
Self-citationBaker, J., Kammerer, M., Castro, P., & Ingold, K. M. (2025) · Climate Policy · doi:10.1080/14693062.2024.2443482 · Cited by 15
Raya-Tapia, A. Y., López-Flores, F. J., Sánchez, A., Martı́n, M., Márquez, C. R., & Ponce‐Ortega, J. M. (2025) · Industrial & Engineering Chemistry Research · doi:10.1021/acs.iecr.5c02274 · Cited by 16
Techno-economic and environmental assessment of bioenergy and livestock integrated systems in Brazil
de Souza, N. R. D., Cavalett, O., & Junqueira, T. L. (2022) · Sustainable Production and Consumption · doi:10.1016/j.spc.2022.05.013 · Cited by 16
Gao, J., & Pan, L. (2022) · Sustainability · doi:10.3390/su142215045 · Cited by 16
The role of bioenergy in Brazil's low-carbon future
Poggio, M., Império, M., Baptista, L. B., Schaeffer, R., Lucena, A. F. P., Szklo, A. S., Rochedo, P., Hultman, N., McJeon, H. C., & Clarke, L. (2023) · Energy and Climate Change · doi:10.1016/j.egycc.2023.100123 · Cited by 15
Self-citationden Elzen, M. G. J., Dafnomilis, I., Nascimento, L., Beusen, A. H. W., Forsell, N., Gubbels, J., Harmsen, M. J. H. M., Hooijschuur, E., Gutiérrez, Z. A., & Kuramochi, T. (2025) · Annals of the New York Academy of Sciences · doi:10.1111/nyas.15285 · Cited by 17
Self-citationHerran, D. S., & Fujimori, S. (2021) · Sustainability Science · doi:10.1007/s11625-021-00930-1 · Cited by 15
Self-citationKorkmaz, Ö. (2021) · Resources Policy · doi:10.1016/j.resourpol.2021.102517 · Cited by 15
Exploring Global Climate Policy Futures and Their Representation in Integrated Assessment Models
Hickmann, T., Bertram, C., Biermann, F., Brutschin, E., Kriegler, E., Livingston, J. E., Pianta, S., Riahi, K., van Ruijven, B. J., & van Vuuren, D. P. (2022) · Politics and Governance · doi:10.17645/pag.v10i3.5328 · Cited by 15
Self-citationRule-Governed Behavior and Climate Change: Why Climate Warnings Fail to Motivate Sufficient Action
Pietras, C. J. (2022) · Behavior and Social Issues · doi:10.1007/s42822-022-00109-y · Cited by 17
Metadata
- Authors
- Roelfsema, M., van Soest, H. L., Harmsen, M., van Vuuren, D. P., Bertram, C., den Elzen, M., Höhne, N., Iacobuta, G., Krey, V., Kriegler, E., Luderer, G., Riahi, K., Ueckerdt, F., Després, J., Drouet, L., Emmerling, J., Frank, S., Fricko, O., Gidden, M., Humpenöder, F., Huppmann, D., Fujimori, S., Fragkiadakis, K., Gi, K., Keramidas, K., Köberle, A. C., Aleluia Reis, L., Rochedo, P., Schaeffer, R., Oshiro, K., Vrontisi, Z., Chen, W., Iyer, G. C., Edmonds, J., Kannavou, M., Jiang, K., Mathur, R., Safonov, G., & Vishwanathan, S. S.
- Affiliations
- Utrecht University (NL)
- Netherlands Environmental Assessment Agency (NL)
- Leibniz Association (DE)
- NewClimate Institute (DE)
- International Institute for Applied Systems Analysis (AT)
- European Commission (BE)
- RFF-CMCC European Institute on Economics and the Environment (IT)
- Kyoto University (JP)
- National Technical University of Athens (GR)
- Research Institute of Innovative Technology for the Earth (JP)
- Universidade Federal do Rio de Janeiro (BR)
- Tsinghua University (CN)
- Joint Global Change Research Institute (US)
- National Development and Reform Commission (CN)
- Energy and Resources Institute (IN)
- Indian Institute of Management Ahmedabad (IN)
- Corresponding author
- Roelfsema, Mark
- ORCID
- Roelfsema, Mark
- Harmsen, Mathijs
- van Vuuren, Detlef P.
- Bertram, Christoph
- den Elzen, Michel
- Höhne, Niklas
- Krey, Volker
- Kriegler, Elmar
- Luderer, Gunnar
- Riahi, Keywan
- Ueckerdt, Falko
- Després, Jacques
- Drouet, Laurent
- Emmerling, Johannes
- Frank, Stefan
- Fricko, Oliver
- Gidden, Matthew
- Humpenöder, Florian
- Huppmann, Daniel
- Fujimori, Shinichiro
- Fragkiadakis, Kostas
- Gi, Keii
- Keramidas, Kimon
- Köberle, Alexandre C.
- Rochedo, Pedro
- Schaeffer, Roberto
- Oshiro, Ken
- Vrontisi, Zoi
- Chen, Wenying
- Iyer, Gokul C.
- Edmonds, Jae
- Kannavou, Maria
- Jiang, Kejun
- Mathur, Ritu
- Safonov, George
- Vishwanathan, Saritha Sudharmma
- Venue
- Nature Communications
- Published
- 2020-04-29
- Volume
- 11
- Issue
- 1
- Pages
- 2096-2096
- ISSN
- 2041-1723 (ISSN-L)
- PMC
- PMC7190619
- OpenAlex
- W3021969666
- Semantic Scholar
- 5293b34dc2aedce731eedcf7271965fa168c0753
- Cited by
- 467
- References
- 34
- Citations by year
- 2026: 51 · 2025: 78 · 2024: 79 · 2023: 77 · 2022: 76 · 2021: 85 · 2020: 20
- FWCI
- 54.85
- Type
- journal article
- Language
- en
- Open access
- gold
- doi.org
- Locations
- Nature Communications (publishedVersion, cc-by)
- PubMed Central (publishedVersion, cc-by)
- PubMed (publishedVersion)
- Socio-Environmental Systems Modeling (acceptedVersion, cc-by)
- IIASA PURE (International Institute of Applied Systems Analysis) (acceptedVersion)
- Institutional Repositories DataBase (IRDB) (submittedVersion, cc-by)
- OSTI OAI (U.S. Department of Energy Office of Scientific and Technical Information) (submittedVersion, other-oa)
- RePEc: Research Papers in Economics (submittedVersion)
- DOAJ (DOAJ: Directory of Open Access Journals) (submittedVersion, cc-by-sa)
- Utrecht University Repository (Utrecht University) (submittedVersion, other-oa)
- RENATE (submittedVersion, cc-by-nc-nd)
- Joint Research Centre (European Commission) (submittedVersion)
- Publication Database PIK (Potsdam Institute for Climate Impact Research (PIK)) (submittedVersion, other-oa)
- Kyoto University Research Information Repository (Kyoto University) (submittedVersion, cc-by)
- VU Research Portal (submittedVersion)
- Spiral (Imperial College London) (submittedVersion, cc-by)
- Data Archiving and Networked Services (DANS) (submittedVersion, cc-by)
- RENATE (cc-by)
- Funders
- Environmental Restoration and Conservation Agency (2-1702, 2-1908)
- European Commission (21020701/2017/770447/SER/CLIMA.C.1 EuropeAid/138417/DH/SER/MulitOC, HORIZON2020, 642147, 821471)
- Indian Institute of Management Ahmedabad
- Tsinghua University
- Korea Advanced Institute of Science and Technology
- National Research University Higher School of Economics
- Environment and Climate Change Canada
- National Development and Reform Commission
- International Institute for Applied Systems Analysis
- Institut Teknologi Bandung
- National Cancer Institute
- Topics
- Social Sciences › Economics, Econometrics and Finance › Economics and Econometrics › Climate Change Policy and Economics
- Physical Sciences › Environmental Science › Global and Planetary Change › Sustainability and Climate Change Governance
- Social Sciences › Economics, Econometrics and Finance › Economics and Econometrics › Energy, Environment, Economic Growth
- Keywords
- Paris Agreement, Nationally Determined Contributions, climate policy implementation, emissions gap, Global Stocktake, 2°C target, 1.5°C target, renewable energy deployment, energy efficiency, emerging markets, climate change mitigation
About these checks
Registry, retraction, Cites and statistics results are computed, not judged, with one exception: a printed reference that no index lists is read once by a model before it counts as a citation error. Claims are extracted by a model and kept only when their quote appears verbatim in the text; each cited source is then checked, with a model’s help, for whether it says what the claim relies on. Those verdicts can be wrong — read the claim’s quote and the cited source before relying on one.
A language model drew the claims from the paper on 2026-10-10, under version 3 of the claim definition (model deepseek-v4.1-flash, prompt extract-v3).
A second model labelled each claim on 2026-10-10 (model jev-1.13-20260917, definition revision gold-guideline-v0.2).
Statistics and arithmetic are recomputed, not judged.
Confidence bands are shown only for fields calibrated on our annotated test set. None is calibrated yet, so no band is shown.
What counts as a claim ›How we measure confidence ›How we check this ›
Are you an author, or do you see a problem with this page? Request a review
