

The DOI matches its Crossref record; 66 of the 66 references it cites were found in a registry or an index; 40 of the 49 sources its claims cite were checked for support.
Progressive Cactus is a multiple-genome aligner for the thousand-genome era
Open accessAbstract
New genome assemblies have been arriving at a rapidly increasing pace, thanks to decreases in sequencing costs and improvements in third-generation sequencing technologies 1–3 . For example, the number of vertebrate genome assemblies currently in the NCBI (National Center for Biotechnology Information) database 4 increased by more than 50% to 1,485 assemblies in the year from July 2018 to July 2019. In addition to this influx of assemblies from different species, new human de novo assemblies 5 are being produced, which enable the analysis of not only small polymorphisms, but also complex, large-scale structural differences between human individuals and haplotypes. This coming era and its unprecedented amount of data offer the opportunity to uncover many insights into genome evolution but also present challenges in how to adapt current analysis methods to meet the increased scale. Cactus 6 , a reference-free multiple genome alignment program, has been shown to be highly accurate, but the existing implementation scales poorly with increasing numbers of genomes, and struggles in regions of highly duplicated sequences. Here we describe progressive extensions to Cactus to create Progressive Cactus, which enables the reference-free alignment of tens to thousands of large vertebrate genomes while maintaining high alignment quality. We describe results from an alignment of more than 600 amniote genomes, which is to our knowledge the largest multiple vertebrate genome alignment created so far.
Overview
AI snapshot
Written from the paper’s full text.
TL;DR
Progressive Cactus extends the reference-free Cactus aligner with a progressive strategy that scales linearly with genome number while retaining high accuracy and ancestral reconstruction. The authors demonstrate it on simulated data, guide-tree and assembly-quality tests, and a 605-genome amniote alignment spanning more than 1 trillion bases.
Key findings
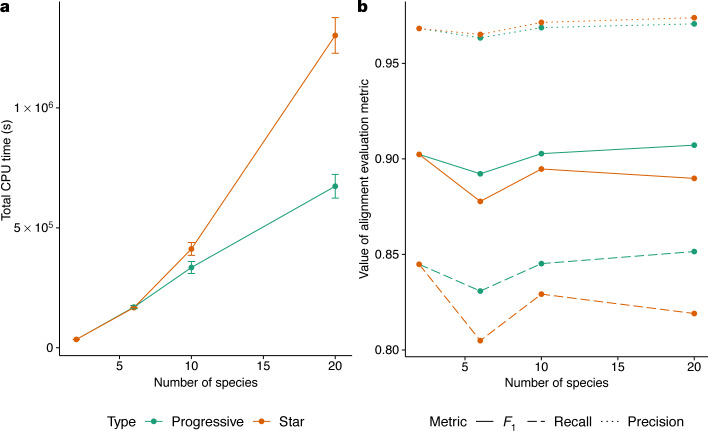
- Progressive Cactus achieved higher Alignathon accuracy than any participating aligner, with F1 scores of 0.989 for simulated primates and 0.795 for simulated mammals. In simulated catarrhine alignments, progressive mode reduced runtime by 15% for 10 species and 48% for 20 species versus a star-tree strategy.
- Guide-tree choice had limited impact: across four alignments of 48 avian species on chromosome 1, an average of 98.5% of aligned pairs were identical between any two alignments, and pairwise species F1 scores between Jarvis- and Prum-based trees were at least 0.955.
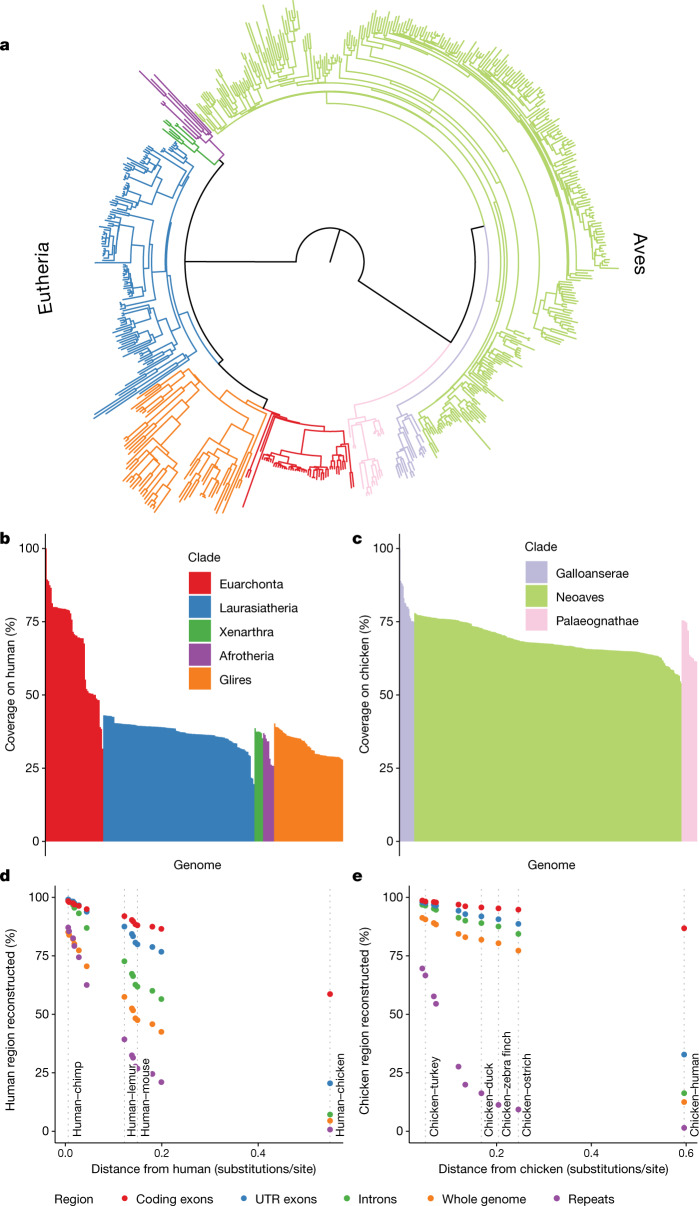
- The 600-way amniote alignment combined 242 Zoonomia mammals and 363 B10K avians, totaling 605 genomes and 1.07 trillion bases, using 73,692 instance-hours and 2.1 million core-hours; the combined common ancestor size was 181 Mb. Median human coverage was 2.3 Gb from Euarchonta, 1.2 Gb from Laurasiatheria, and 1.0 Gb from Glires.
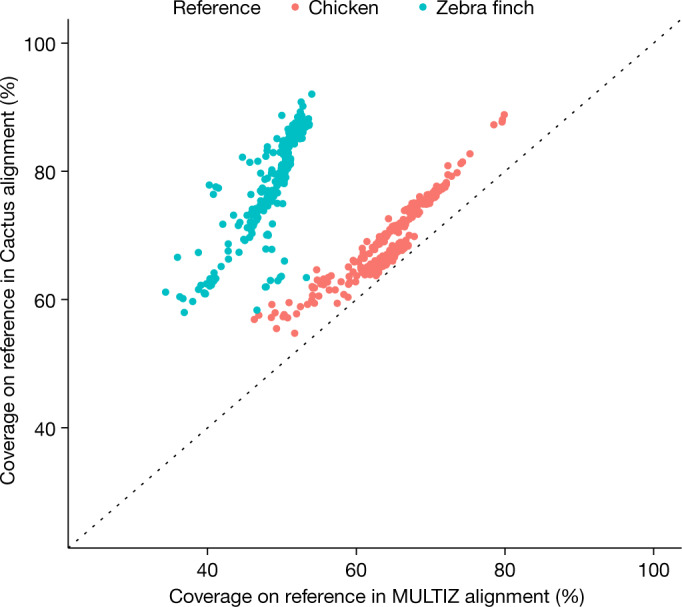
- Ancestral reconstructions retained 86% of human coding bases in the placental ancestor and 95% of chicken coding bases in the avian ancestor. Best-hit filtering reduced human sequence mapping to two or more chimpanzee locations from 6.1% to 2.6% and reduced inferred paralogous alignments from 46% to 26%; Progressive Cactus covered 69.4% of chicken versus 64.9% for MULTIZ, and 79% of zebra finch versus 49.2% for MULTIZ.
Methods
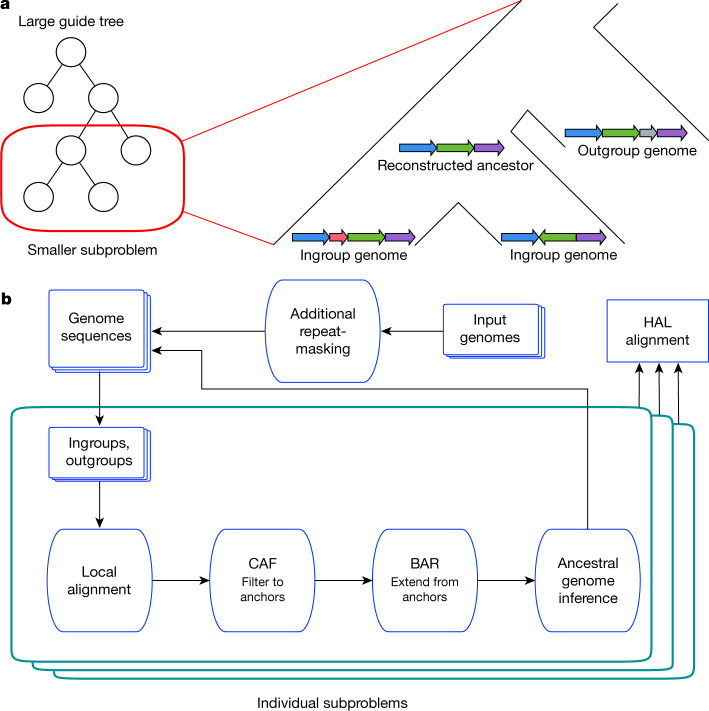
- Progressive Cactus uses an input guide tree to recursively split whole-genome alignment into subproblems, each comparing ingroup genomes plus outgroup genomes; subproblems use LASTZ local alignments, CAF and BAR algorithms, and ancestral assembly reconstruction, with results combined into HAL format.
- Evaluations included Alignathon simulated primate and mammal datasets; twenty simulated 30-Mb catarrhine genomes under progressive versus star trees; 48 avian species reduced to chicken chromosome 1 under four guide trees; 11 boreoeutherian mammals with high- versus low-quality assemblies; and the 605-genome amniote alignment.
- Main analyses compared runtime, precision/recall/F1 against truth sets, Jaccard similarity of aligned pairs, coverage statistics, micro-indel rates, RepeatMasker annotations, and transcript/gene mappings against BLAT, BLAST, LASTZ, and MULTIZ.
Limitations
- Stated: ancestral reconstructions are hypothetical histories; ancestral base calls are generated during alignment and may differ from ideal post hoc calls, though `ancestorsML` can re-estimate them. Adding a genome to an existing alignment re-infers at most one ancestral sequence, so rare sequence in the new genome may not align properly to distant outgroups.
- Stated: paralogy resolution forbids representing incomplete lineage sorting or horizontal transfer and cannot exactly order multiple duplication events along a single branch. Guide trees can affect alignments, though multiple outgroups reduce this effect, and poor assembly quality can still alter alignments.
- Evident: the 600-way alignment is a composite of the Zoonomia and B10K alignments joined by a linker alignment using frog, coelacanth, and zebrafish outgroups, not a single monolithic run; it also required large computational resources (2.1 million core-hours).
Model-written summary. Check it against the paper before relying on it.
Integrity signals
Registry
Cites
Statistics
Figures
Verification
Claims the paper makes
36 Own result · 33 No basis given · 26 Own interpretation · 12 Supported · 10 Partly supported · 6 Own method · 4 No full text of the sources · 2 Couldn’t confirm · 1 Not checked yet · accuracy not yet measured
Every source the paper cites for this claim was checked and supports it.
In the paper
“Reinforcing this, comparing the induced pairwise alignments of human–dog to direct pairwise alignments computed using the established chains and nets pipeline30, we find the same level of Jaccard similarity for both the high- and low-quality assembly alignments (Supplementary Fig. 5).”
§ Progressive Cactus is a multiple-genome aligner for the thousand-genome era > Effect of assembly quality on alignment
What the sources say
- Supportedcites [30] Kent, W. J., Baertsch, R., Hinrichs, A., Miller, W. & Haussler, D. Evolution’s cauldron: duplication, deletion, and rearrangement in the mouse and human genomes. Proc. Natl Acad. Sci. USA 100, 11484–11489 (2003). source
The citation is attached to the established chains-and-nets pipeline, not to the citing authors’ human–dog comparison or Jaccard result. The source’s Methods describe AXTCHAIN constructing chained alignments and CHAINNET organizing chains into nets; it does not report the human–dog result. (LLM, conf=0.91)
plain- Asserted: passes — The authors put it forward as true.
- Checkable: passes — It can be checked against evidence.
- Load-bearing: passes — The paper’s conclusions depend on it.
- Based: passes — The paper gives a reason why it holds.
- Supported
The cited sources support only part of this claim — read each source’s verdict below.
In the paper
“Comparative genomics analyses, including species-tree inference7,8, comparative annotation9,10, and selection detection11,12, require genome alignments.”
§ Progressive Cactus is a multiple-genome aligner for the thousand-genome era > Main
What the sources say
- Partly supportedcites [7] Liu, L., Yu, L. & Edwards, S. V. A maximum pseudo-likelihood approach for estimating species trees under the coalescent model. BMC Evol. Biol. 10, 302 (2010). sourceExperimental — accuracy not yet measured
The Methods section (page not available) describes estimating gene trees from multilocus sequences and resampling sites in aligned sequences, supporting the use of alignments for species-tree inference. But it says MP-EST constructs a species tree from rooted gene trees; it does not establish that genome alignments are required. This citation supports the species-tree portion of the sentence, not the separately cited annotation and selection examples. (LLM, conf=0.85)
- Partly supportedcites [8] Zhang, C., Rabiee, M., Sayyari, E. & Mirarab, S. ASTRAL-III: polynomial time species tree reconstruction from partially resolved gene trees. BMC Bioinformatics 19 (Suppl. 6), 153 (2018). sourceExperimental — accuracy not yet measured
The Background (page unavailable) describes species-tree inference from gene trees drawn from different parts of the genome, and the Results discuss gene alignments. But the Methods define ASTRAL’s input as gene trees, not genome alignments, so the paper does not establish the claimed requirement for genome alignments. This citation is attached to species-tree inference, not comparative annotation or selection detection. (LLM, conf=0.82)
- Supportedcites [9] Fiddes, I. T. et al. Comparative annotation toolkit (CAT)-simultaneous clade and personal genome annotation. Genome Res. 28, 1029–1038 (2017). source
The citation supports the comparative-annotation part of the sentence. The Abstract says CAT uses multiple genome alignments to project annotations across genomes, and the Discussion says those alignments allow CAT to annotate multiple genomes simultaneously. The species-tree and selection examples are attached to other citations. (LLM, conf=0.93)
- Partly supportedcites [10] König, S., Romoth, L. W., Gerischer, L. & Stanke, M. Simultaneous gene finding in multiple genomes. Bioinformatics 32, 3388–3395 (2016). sourceExperimental — accuracy not yet measured
This citation is attached to comparative annotation, not species-tree inference or selection detection. The Abstract says AUGUSTUS cgp requires a genome alignment, supporting the claim for this method. But the Conclusion (section 4) describes protein or transcript alignment as another way to transfer annotations, so the paper does not establish that comparative annotation generally requires genome alignments. (LLM, conf=0.84)
- Not checked — no full text of the sourcecites [11] Hubisz, M. J., Pollard, K. S. & Siepel, A. PHAST and RPHAST: phylogenetic analysis with space/time models. Brief. Bioinform. 12, 41–51 (2011). source
- Supportedcites [12] Garber, M. et al. Identifying novel constrained elements by exploiting biased substitution patterns. Bioinformatics 25, i54–i62 (2009). source
The Abstract describes identifying evolutionary selection using a method that infers substitution biases directly from sequence alignments. The Methods (§2.2) confirm that the analysis used genome sequence alignments. This supports the selection-detection portion of the citing sentence, for which this source is cited. (LLM, conf=0.92)
plaindirect- Asserted: passes — The authors put it forward as true.
- Checkable: passes — It can be checked against evidence.
- Load-bearing: passes — The paper’s conclusions depend on it.
- Based: passes — The paper gives a reason why it holds.
- Partly supported
Every source the paper cites for this claim was checked and supports it.
In the paper
“The Alignathon simulated datasets14 have been aligned with many competing genome aligners and have a known truth set, providing a way to compare Progressive Cactus against other genome aligners.”
§ Progressive Cactus is a multiple-genome aligner for the thousand-genome era > Evaluation on simulated data
What the sources say
- Supportedcites [14] Earl, D. et al. Alignathon: a competitive assessment of whole-genome alignment methods. Genome Res. 24, 2077–2089 (2014). source
The Results (Competition organization and submissions; page unavailable) say the simulated datasets included the truths and received submissions from multiple genome-alignment pipelines. The Results (Genome-wide comparison to simulated genome alignments; page unavailable) explain how predicted alignments were compared with simulated truth, supporting their use to benchmark Progressive Cactus against other aligners. The paper does not need to have tested Progressive Cactus itself for this claim about the datasets to hold. (LLM, conf=0.92)
plaindirect- Asserted: passes — The authors put it forward as true.
- Checkable: passes — It can be checked against evidence.
- Load-bearing: passes — The paper’s conclusions depend on it.
- Based: passes — The paper gives a reason why it holds.
- Supported
Every source the paper cites for this claim was checked and supports it.
In the paper
“different aligners frequently give different results14”
§ Progressive Cactus is a multiple-genome aligner for the thousand-genome era > Main
What the sources say
- Supportedcites [14] Earl, D. et al. Alignathon: a competitive assessment of whole-genome alignment methods. Genome Res. 24, 2077–2089 (2014). source
In Results, under “Comparing the submissions directly” (page not provided), the paper compares alignments produced by different pipelines and finds the mammalian and fly submissions much more divergent from one another. It notes that the primate submissions were relatively similar, so the claim is a fair broad summary rather than a statement that aligners always disagree. (LLM, conf=0.90)
plaincorrelational- Asserted: passes — The authors put it forward as true.
- Checkable: passes — It can be checked against evidence.
- Load-bearing: passes — The paper’s conclusions depend on it.
- Based: passes — The paper gives a reason why it holds.
- Supported
The cited sources support only part of this claim — read each source’s verdict below.
In the paper
“Progressive Cactus, combined with special functionality in the HAL toolkit27, therefore supports the addition and removal of genomes from the alignment”
§ Progressive Cactus is a multiple-genome aligner for the thousand-genome era > Progressive Cactus
What the sources say
- Partly supportedcites [27] Hickey, G., Paten, B., Earl, D., Zerbino, D. & Haussler, D. HAL: a hierarchical format for storing and analyzing multiple genome alignments. Bioinformatics 29, 1341–1342 (2013). sourceExperimental — accuracy not yet measured
Section 2.3 (HAL tools; page not specified) describes a Cactus-to-HAL converter, supporting the claimed connection between Cactus and the HAL toolkit. Neither that section nor the passages found by searching for genome addition and removal say that the toolkit supports adding or removing genomes from an existing alignment. (LLM, conf=0.78)
plaindirect- Asserted: passes — The authors put it forward as true.
- Checkable: passes — It can be checked against evidence.
- Load-bearing: passes — The paper’s conclusions depend on it.
- Based: passes — The paper gives a reason why it holds.
- Partly supported
The cited sources that could be checked couldn’t confirm or dispute this claim.
In the paper
“Progressive Cactus has already proved useful for comparison between assemblies of the same species20.”
§ Progressive Cactus is a multiple-genome aligner for the thousand-genome era > Discussion
What the sources say
- Could not verifycites [20] Kronenberg, Z. N. et al. High-resolution comparative analysis of great ape genomes. Science 360, eaar6343 (2018). sourceExperimental — accuracy not yet measured
The Abstract and Results (Comparative sequence analyses; page unavailable) describe comparisons involving two human assemblies, but do not say Progressive Cactus was used. Searches for “Progressive Cactus,” “Cactus,” and same-species assembly alignment found only a Cactus citation in the References, not evidence of its usefulness for this comparison. (LLM, conf=0.76)
plaindirect- Asserted: passes — The authors put it forward as true.
- Checkable: passes — It can be checked against evidence.
- Load-bearing: unclear — It is unclear whether the paper’s conclusions depend on it.
- Based: passes — The paper gives a reason why it holds.
- Could not verify
The cited sources support only part of this claim — read each source’s verdict below.
In the paper
“consistent with a more conservative mode of genome evolution in avians that is influenced by lower repeat counts and denser gene content33.”
§ Progressive Cactus is a multiple-genome aligner for the thousand-genome era > 600-way amniote alignment
What the sources say
- Partly supportedcites [33] Zhang, G. et al. Comparative genomics reveals insights into avian genome evolution and adaptation. Science 346, 1311–1320 (2014). sourceExperimental — accuracy not yet measured
The Results sections on selective constraints and conservative genome evolution report more slowly evolving regions and less genome shuffling in birds than in mammals. The broad-patterns Results also report fewer repeats and increased gene density, but the paper does not establish that those features influence the conservative mode of evolution. Page numbers are unavailable in our copy. (LLM, conf=0.84)
plaindirect- Asserted: passes — The authors put it forward as true.
- Checkable: passes — It can be checked against evidence.
- Load-bearing: unclear — It is unclear whether the paper’s conclusions depend on it.
- Based: passes — The paper gives a reason why it holds.
- Partly supported
The cited sources support only part of this claim — read each source’s verdict below.
In the paper
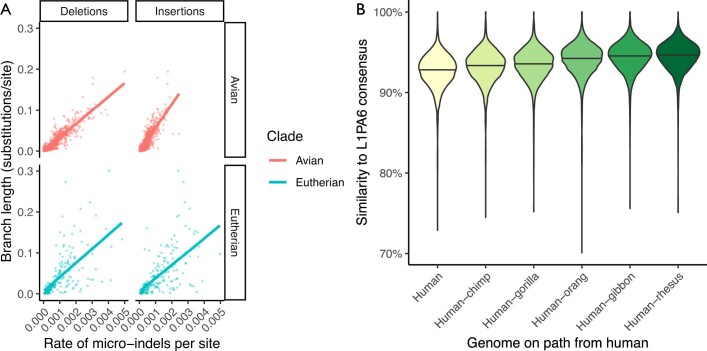
“As expected from previous studies16,34, the rate of small indels in any given branch was correlated with the rate of nucleotide substitution (an R2 value of 0.69 for insertions and 0.80 for deletions in avians, and 0.39 and 0.40, respectively, for eutherians)”
§ Progressive Cactus is a multiple-genome aligner for the thousand-genome era > 600-way amniote alignment
What the sources say
- Partly supportedcites [16] Green, R. E. et al. Three crocodilian genomes reveal ancestral patterns of evolution among archosaurs. Science 346, 1254449 (2014). sourceExperimental — accuracy not yet measured
In “Rates of genome evolution in crocodilians, birds, and other reptiles” (page unavailable), the paper reports micro-indel rates relative to substitution rates across several lineages; its Discussion also says crocodilians’ low evolutionary rates extend to micro-indels. This supports a broad association, but the copy does not report a branch-by-branch correlation or establish it for any given branch. (LLM, conf=0.78)
- Partly supportedcites [34] Chen, J.-Q. et al. Variation in the ratio of nucleotide substitution and indel rates across genomes in mammals and bacteria. Mol. Biol. Evol. 26, 1523–1531 (2009). sourceExperimental — accuracy not yet measured
The Introduction (page unavailable) reports covariation between SNPs and indels within and between species, supporting the general correlation. The paper does not establish that this holds for small indels in any given evolutionary branch; its comparisons concern genomes and genomic regions rather than branch-specific rates. (LLM, conf=0.83)
plaincorrelational- Asserted: passes — The authors put it forward as true.
- Checkable: passes — It can be checked against evidence.
- Load-bearing: unclear — It is unclear whether the paper’s conclusions depend on it.
- Based: passes — The paper gives a reason why it holds.
- Partly supported
The cited sources support only part of this claim — read each source’s verdict below.
In the paper
“Alignments of such assemblies are essential for annotation9 and variant characterization42 and should prove useful for reference-free pangenome construction of the variation present in a population43.”
§ Progressive Cactus is a multiple-genome aligner for the thousand-genome era > Discussion
What the sources say
- Supportedcites [9] Fiddes, I. T. et al. Comparative annotation toolkit (CAT)-simultaneous clade and personal genome annotation. Genome Res. 28, 1029–1038 (2017). source
The citation to Fiddes et al. is attached to annotation, not variant characterization. The Abstract describes multiple-genome alignments as the basis for projecting annotations onto other assemblies, and the Results section reports using such alignments to annotate personal human assemblies. (LLM, conf=0.91)
- Partly supportedcites [42] Hickey, G. et al. Genotyping structural variants in pangenome graphs using the vg toolkit. Genome Biol. 21, 35 (2020). sourceExperimental — accuracy not yet measured
The Results section (‘Graphs from alignment of de novo assemblies’; page unavailable) says whole-genome alignments of assemblies can reveal complex structural variation and support structural-variant genotyping. That supports the variant-characterization point attached to this citation, but the paper does not establish that such alignments are essential for variant characterization generally. The separate annotation claim is attached to another citation. (LLM, conf=0.82)
plain- Asserted: passes — The authors put it forward as true.
- Checkable: passes — It can be checked against evidence.
- Load-bearing: passes — The paper’s conclusions depend on it.
- Based: passes — The paper gives a reason why it holds.
- Supported
Every source the paper cites for this claim was checked and supports it.
In the paper
“Because, unlike Progressive Cactus, MULTIZ is reference-biased”
§ Progressive Cactus is a multiple-genome aligner for the thousand-genome era > 600-way amniote alignment
What the sources say
- Supportedcites [22] Blanchette, M. et al. Aligning multiple genomic sequences with the threaded blockset aligner. Genome Res. 14, 708–715 (2004). source
The MULTIZ section describes its inputs and output as reference-based blocksets. The Evaluation of Alignment Accuracy section explicitly says that MULTIZ alignments are human-referenced and that this affects the quality of the induced mouse–rat alignment. The cited paper does not address Progressive Cactus, but it supports the attributed point about MULTIZ. (LLM, conf=0.92)
plain- Asserted: passes — The authors put it forward as true.
- Checkable: passes — It can be checked against evidence.
- Load-bearing: passes — The paper’s conclusions depend on it.
- Based: passes — The paper gives a reason why it holds.
- Supported
A claim is checked only against the cited paper’s full text, never its abstract, and none is available for its sources.
In the paper
“For any pair of these 48 species, the F1 score for aligned pairs between the previously published28,29 alignments was at least 0.955 (Supplementary Fig. 2).”
§ Progressive Cactus is a multiple-genome aligner for the thousand-genome era > Effect of the guide tree
What the sources say
- Not checked — no full text of the sourcecites [28] Prum, R. O. et al. A comprehensive phylogeny of birds (Aves) using targeted next-generation DNA sequencing. Nature 526, 569–573 (2015). source
- Not checked — no full text of the sourcecites [29] Jarvis, E. D. et al. Whole-genome analyses resolve early branches in the tree of life of modern birds. Science 346, 1320–1331 (2014). source
plain- Asserted: passes — The authors put it forward as true.
- Checkable: passes — It can be checked against evidence.
- Load-bearing: unclear — It is unclear whether the paper’s conclusions depend on it.
- Based: passes — The paper gives a reason why it holds.
The paper states this without a source or data behind it here, so there is nothing to check it against. The quote shows it is in the paper.
In the paper
“but which is tractable to use on hundreds to thousands of large, vertebrate-sized input genomes.”
§ Progressive Cactus is a multiple-genome aligner for the thousand-genome era > Main
plain- Asserted: passes — The authors put it forward as true.
- Checkable: passes — It can be checked against evidence.
- Load-bearing: passes — The paper’s conclusions depend on it.
- Based: passes — The paper gives a reason why it holds.
A result the paper reports from its own data — it cites no other source for it, so there is none to check. The quote shows it is in the paper.
In the paper
“Concordant results were found comparing human–mouse pairwise alignments (Supplementary Fig. 5).”
§ Progressive Cactus is a multiple-genome aligner for the thousand-genome era > Effect of assembly quality on alignment
plain- Asserted: passes — The authors put it forward as true.
- Checkable: passes — It can be checked against evidence.
- Load-bearing: unclear — It is unclear whether the paper’s conclusions depend on it.
- Based: passes — The paper gives a reason why it holds.
The paper states this without a source or data behind it here, so there is nothing to check it against. The quote shows it is in the paper.
In the paper
“We show that the result, which we call Progressive Cactus, is an aligner that retains state-of-the-art accuracy”
§ Progressive Cactus is a multiple-genome aligner for the thousand-genome era > Main
plain- Asserted: passes — The authors put it forward as true.
- Checkable: passes — It can be checked against evidence.
- Load-bearing: passes — The paper’s conclusions depend on it.
- Based: passes — The paper gives a reason why it holds.
A result the paper reports from its own data — it cites no other source for it, so there is none to check. The quote shows it is in the paper.
In the paper
“Despite alignment differences between the long-read and short-read assemblies (Supplementary Table 5), the alignment between these four assemblies was similar in both datasets (for example, 0.855 Jaccard similarity between induced pairwise human–dog alignments) (Supplementary Fig. 4)”
§ Progressive Cactus is a multiple-genome aligner for the thousand-genome era > Effect of assembly quality on alignment
plain- Asserted: passes — The authors put it forward as true.
- Checkable: passes — It can be checked against evidence.
- Load-bearing: passes — The paper’s conclusions depend on it.
- Based: passes — The paper gives a reason why it holds.
The paper states this without a source or data behind it here, so there is nothing to check it against. The quote shows it is in the paper.
In the paper
“the runtime of that initial iteration of Cactus scaled quadratically with the total number of bases in the alignment problem”
§ Progressive Cactus is a multiple-genome aligner for the thousand-genome era > Main
plaindirect- Asserted: passes — The authors put it forward as true.
- Checkable: passes — It can be checked against evidence.
- Load-bearing: passes — The paper’s conclusions depend on it.
- Based: passes — The paper gives a reason why it holds.
The paper states this without a source or data behind it here, so there is nothing to check it against. The quote shows it is in the paper.
In the paper
“and continues to lack reference bias”
§ Progressive Cactus is a multiple-genome aligner for the thousand-genome era > Main
plain- Asserted: passes — The authors put it forward as true.
- Checkable: passes — It can be checked against evidence.
- Load-bearing: passes — The paper’s conclusions depend on it.
- Based: unclear — It is unclear why the paper says it holds.
The paper states this without a source or data behind it here, so there is nothing to check it against. The quote shows it is in the paper.
In the paper
“The key innovation of Progressive Cactus is to adapt the classic ‘progressive’ strategy (used in collinear multiple alignment for decades) to a whole-genome alignment setting.”
§ Progressive Cactus is a multiple-genome aligner for the thousand-genome era > Progressive Cactus
plaindirect- Asserted: passes — The authors put it forward as true.
- Checkable: passes — It can be checked against evidence.
- Load-bearing: passes — The paper’s conclusions depend on it.
- Based: passes — The paper gives a reason why it holds.
A result the paper reports from its own data — it cites no other source for it, so there is none to check. The quote shows it is in the paper.
In the paper
“We describe results from an alignment of more than 600 amniote genomes”
§ Progressive Cactus is a multiple-genome aligner for the thousand-genome era > Abstract
plain- Asserted: passes — The authors put it forward as true.
- Checkable: passes — It can be checked against evidence.
- Load-bearing: passes — The paper’s conclusions depend on it.
- Based: passes — The paper gives a reason why it holds.
The paper states this without a source or data behind it here, so there is nothing to check it against. The quote shows it is in the paper.
In the paper
“but also produces ancestral reconstructions.”
§ Progressive Cactus is a multiple-genome aligner for the thousand-genome era > Progressive Cactus
plaindirect- Asserted: passes — The authors put it forward as true.
- Checkable: passes — It can be checked against evidence.
- Load-bearing: passes — The paper’s conclusions depend on it.
- Based: passes — The paper gives a reason why it holds.
A result the paper reports from its own data — it cites no other source for it, so there is none to check. The quote shows it is in the paper.
In the paper
“The four alignments were highly similar, with an average of 98.5% of aligned pairs identical between any two different alignments (Extended Data Table 2).”
§ Progressive Cactus is a multiple-genome aligner for the thousand-genome era > Effect of the guide tree
plain- Asserted: passes — The authors put it forward as true.
- Checkable: passes — It can be checked against evidence.
- Load-bearing: passes — The paper’s conclusions depend on it.
- Based: passes — The paper gives a reason why it holds.
The paper states this without a source or data behind it here, so there is nothing to check it against. The quote shows it is in the paper.
In the paper
“Cactus now follows a similar strategy, with the key innovation being that Progressive Cactus implements a progressive-alignment strategy for whole-genome alignment using reconstructed ancestral assemblies as the method for combining sub-alignments.”
§ Progressive Cactus is a multiple-genome aligner for the thousand-genome era > Progressive Cactus
plaindirect- Asserted: passes — The authors put it forward as true.
- Checkable: passes — It can be checked against evidence.
- Load-bearing: passes — The paper’s conclusions depend on it.
- Based: passes — The paper gives a reason why it holds.
None of the sources cited for this claim have been checked yet.
In the paper
“The ancestral assemblies consistently contain a relatively higher proportion of sequence for avians than for mammals even across similar phylogenetic distances”
§ Progressive Cactus is a multiple-genome aligner for the thousand-genome era > 600-way amniote alignment
plaincorrelational- Asserted: passes — The authors put it forward as true.
- Checkable: passes — It can be checked against evidence.
- Load-bearing: unclear — It is unclear whether the paper’s conclusions depend on it.
- Based: passes — The paper gives a reason why it holds.
A result the paper reports from its own data — it cites no other source for it, so there is none to check. The quote shows it is in the paper.
In the paper
“Supporting this result, comparing the median per-transcript and per-gene base-level Jaccard similarity of these mappings to chicken, while Progressive Cactus and LASTZ were most similar, Progressive Cactus was more similar to translated BLAT and Blast than LASTZ was (Supplementary Figs. 11, 12, Supplementary Table 10).”
§ Progressive Cactus is a multiple-genome aligner for the thousand-genome era > 600-way amniote alignment
plaincorrelational- Asserted: passes — The authors put it forward as true.
- Checkable: passes — It can be checked against evidence.
- Load-bearing: unclear — It is unclear whether the paper’s conclusions depend on it.
- Based: passes — The paper gives a reason why it holds.
The paper states this without a source or data behind it here, so there is nothing to check it against. The quote shows it is in the paper.
In the paper
“Unfortunately, this method is very sensitive to incomplete outgroup assemblies (containing an incorrect number of copies of a duplicated region) or variation in the similarity between closely related paralogues, causing assignment to the wrong copy.”
§ Progressive Cactus is a multiple-genome aligner for the thousand-genome era > Methods > Paralogy resolution
plaindirect- Asserted: passes — The authors put it forward as true.
- Checkable: passes — It can be checked against evidence.
- Load-bearing: passes — The paper’s conclusions depend on it.
- Based: passes — The paper gives a reason why it holds.
A result the paper reports from its own data — it cites no other source for it, so there is none to check. The quote shows it is in the paper.
In the paper
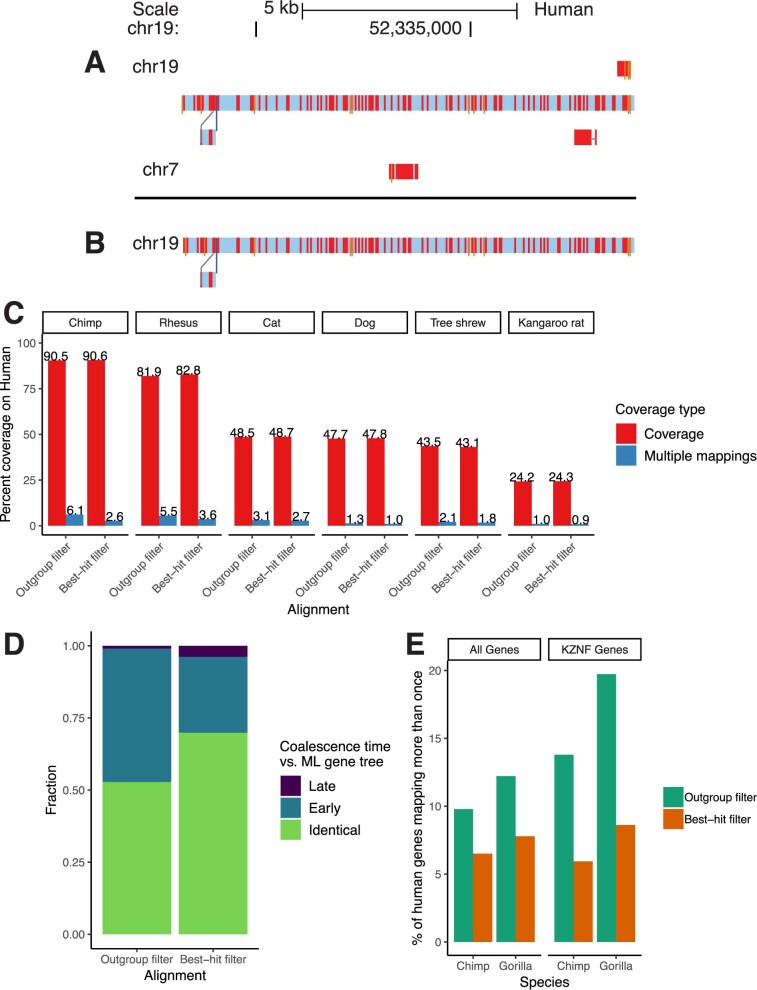
“Not only was CAT less likely to identify a human gene in multiple chimp loci using the best-hit filtering (for example, 6.5% versus 9.8% multiple-mappings across all genes in chimp, and 5.9% versus 13.8% for the recently-duplicated KRAB zinc-finger gene family) (Extended Data Fig. 1e)”
§ Progressive Cactus is a multiple-genome aligner for the thousand-genome era > Methods > Paralogy resolution
plaincorrelational- Asserted: passes — The authors put it forward as true.
- Checkable: passes — It can be checked against evidence.
- Load-bearing: unclear — It is unclear whether the paper’s conclusions depend on it.
- Based: passes — The paper gives a reason why it holds.
A result the paper reports from its own data — it cites no other source for it, so there is none to check. The quote shows it is in the paper.
In the paper
“However, coding bases are still well retained (86.8% from chicken and 58.7% from human).”
§ Progressive Cactus is a multiple-genome aligner for the thousand-genome era > 600-way amniote alignment
boosted- Asserted: passes — The authors put it forward as true.
- Checkable: passes — It can be checked against evidence.
- Load-bearing: passes — The paper’s conclusions depend on it.
- Based: passes — The paper gives a reason why it holds.
A result the paper reports from its own data — it cites no other source for it, so there is none to check. The quote shows it is in the paper.
In the paper
“Comparison of Cactus and LASTZ coding sequence mappings to the union of the translated alignments, both in terms of individual gene counts and coding and mRNA bases, showed that Cactus has a marginally higher fraction of shared elements with the translated alignments than LASTZ (Supplementary Table 9).”
§ Progressive Cactus is a multiple-genome aligner for the thousand-genome era > 600-way amniote alignment
plaincorrelational- Asserted: passes — The authors put it forward as true.
- Checkable: passes — It can be checked against evidence.
- Load-bearing: unclear — It is unclear whether the paper’s conclusions depend on it.
- Based: passes — The paper gives a reason why it holds.
A result the paper reports from its own data — it cites no other source for it, so there is none to check. The quote shows it is in the paper.
In the paper
“Notably, we observe similar rates of deletions between eutherian and avian lineages”
§ Progressive Cactus is a multiple-genome aligner for the thousand-genome era > 600-way amniote alignment
plain- Asserted: passes — The authors put it forward as true.
- Checkable: passes — It can be checked against evidence.
- Load-bearing: unclear — It is unclear whether the paper’s conclusions depend on it.
- Based: passes — The paper gives a reason why it holds.
A result the paper reports from its own data — it cites no other source for it, so there is none to check. The quote shows it is in the paper.
In the paper
“Both Progressive Cactus and LASTZ had much lower levels of multi-mapping (2–3% of transcripts) than either translated method (16–51%) (Supplementary Tables 6–8).”
§ Progressive Cactus is a multiple-genome aligner for the thousand-genome era > 600-way amniote alignment
plain- Asserted: passes — The authors put it forward as true.
- Checkable: passes — It can be checked against evidence.
- Load-bearing: passes — The paper’s conclusions depend on it.
- Based: passes — The paper gives a reason why it holds.
The paper states this without a source or data behind it here, so there is nothing to check it against. The quote shows it is in the paper.
In the paper
“Because, unlike Progressive Cactus, MULTIZ is reference-biased, the difference is starker when looking at the number of bases aligned to a genome not used as the MULTIZ reference (an average of 79% of the zebra finch covered versus 49.2%, for an average increase of 367 Mb) (Fig. 4).”
§ Progressive Cactus is a multiple-genome aligner for the thousand-genome era > 600-way amniote alignment
plaindirect- Asserted: passes — The authors put it forward as true.
- Checkable: passes — It can be checked against evidence.
- Load-bearing: passes — The paper’s conclusions depend on it.
- Based: passes — The paper gives a reason why it holds.
A result the paper reports from its own data — it cites no other source for it, so there is none to check. The quote shows it is in the paper.
In the paper
“Despite its scale, sub-alignments of the 600-way are similar to smaller alignments of the same species.”
§ Progressive Cactus is a multiple-genome aligner for the thousand-genome era > 600-way amniote alignment
plain- Asserted: passes — The authors put it forward as true.
- Checkable: passes — It can be checked against evidence.
- Load-bearing: passes — The paper’s conclusions depend on it.
- Based: passes — The paper gives a reason why it holds.
A result the paper reports from its own data — it cites no other source for it, so there is none to check. The quote shows it is in the paper.
In the paper
“The number of paralogous alignments (represented by the coalescence time between duplicated sequences being too ‘early’ in the HAL tree relative to the ML tree) in the alignment of the 12 boreoeutherian genomes was clearly reduced (46% in the outgroup filtering versus 26% in the best-hit filtering) (Extended Data Fig. 1d).”
§ Progressive Cactus is a multiple-genome aligner for the thousand-genome era > Methods > Paralogy resolution
boosteddirect- Asserted: passes — The authors put it forward as true.
- Checkable: passes — It can be checked against evidence.
- Load-bearing: passes — The paper’s conclusions depend on it.
- Based: passes — The paper gives a reason why it holds.
- Rests on an assumption: The approximately maximum-likelihood trees independently re-estimated by FastTree from the same regions are accurate enough to serve as a reference against which errors in the HAL trees can be detected.
A result the paper reports from its own data — it cites no other source for it, so there is none to check. The quote shows it is in the paper.
In the paper
“Each pair of species has an F1 score between Jarvis- and Prum-based alignments of at least 0.955.”
§ Progressive Cactus is a multiple-genome aligner for the thousand-genome era > Methods > Evaluation of the effect of the guide tree
plain- Asserted: passes — The authors put it forward as true.
- Checkable: passes — It can be checked against evidence.
- Load-bearing: unclear — It is unclear whether the paper’s conclusions depend on it.
- Based: passes — The paper gives a reason why it holds.
A result the paper reports from its own data — it cites no other source for it, so there is none to check. The quote shows it is in the paper.
In the paper
“Within the 7.1 billion aligned base pairs involving human, mouse, rat or dog within the 600-way, 76.49% were present in an alignment with less than a tenth the number of species (Supplementary Fig. 7)”
§ Progressive Cactus is a multiple-genome aligner for the thousand-genome era > 600-way amniote alignment
plain- Asserted: passes — The authors put it forward as true.
- Checkable: passes — It can be checked against evidence.
- Load-bearing: passes — The paper’s conclusions depend on it.
- Based: passes — The paper gives a reason why it holds.
The paper states this without a source or data behind it here, so there is nothing to check it against. The quote shows it is in the paper.
In the paper
“The ancestral reconstructions provide a history of substitution, indel and rearrangement events.”
§ Progressive Cactus is a multiple-genome aligner for the thousand-genome era > 600-way amniote alignment
plain- Asserted: passes — The authors put it forward as true.
- Checkable: passes — It can be checked against evidence.
- Load-bearing: passes — The paper’s conclusions depend on it.
- Based: passes — The paper gives a reason why it holds.
A result the paper reports from its own data — it cites no other source for it, so there is none to check. The quote shows it is in the paper.
In the paper
“Both Progressive Cactus and LASTZ have higher base-level similarity with existing chicken annotations than either translated alignment method (Supplementary Table 11).”
§ Progressive Cactus is a multiple-genome aligner for the thousand-genome era > 600-way amniote alignment
plaincorrelational- Asserted: passes — The authors put it forward as true.
- Checkable: passes — It can be checked against evidence.
- Load-bearing: unclear — It is unclear whether the paper’s conclusions depend on it.
- Based: passes — The paper gives a reason why it holds.
The paper states this without a source or data behind it here, so there is nothing to check it against. The quote shows it is in the paper.
In the paper
“but as a result orthologues for 104 more human genes were identified in the output gene set for chimp (182 in gorilla) (Supplementary Table 14).”
§ Progressive Cactus is a multiple-genome aligner for the thousand-genome era > Methods > Paralogy resolution
plaindirect- Asserted: passes — The authors put it forward as true.
- Checkable: passes — It can be checked against evidence.
- Load-bearing: unclear — It is unclear whether the paper’s conclusions depend on it.
- Based: passes — The paper gives a reason why it holds.
The paper states this without a source or data behind it here, so there is nothing to check it against. The quote shows it is in the paper.
In the paper
“The ancestral assemblies also represent even difficult-to-align regions such as transposable elements.”
§ Progressive Cactus is a multiple-genome aligner for the thousand-genome era > 600-way amniote alignment
plain- Asserted: passes — The authors put it forward as true.
- Checkable: passes — It can be checked against evidence.
- Load-bearing: unclear — It is unclear whether the paper’s conclusions depend on it.
- Based: passes — The paper gives a reason why it holds.
A result the paper reports from its own data — it cites no other source for it, so there is none to check. The quote shows it is in the paper.
In the paper
“As seen in Extended Data Fig. 1, this filtering method tended to resolve duplications far too early, often causing paralogues to be called orthologues.”
§ Progressive Cactus is a multiple-genome aligner for the thousand-genome era > Methods > Paralogy resolution
plaindirect- Asserted: passes — The authors put it forward as true.
- Checkable: passes — It can be checked against evidence.
- Load-bearing: passes — The paper’s conclusions depend on it.
- Based: passes — The paper gives a reason why it holds.
A result the paper reports from its own data — it cites no other source for it, so there is none to check. The quote shows it is in the paper.
In the paper
“Coverage on human increased for all genomes when recoverable chains were removed, especially for those most distant from human (Supplementary Fig. 16).”
§ Progressive Cactus is a multiple-genome aligner for the thousand-genome era > Methods > Improvements from removing recoverable sequence
plaindirect- Asserted: passes — The authors put it forward as true.
- Checkable: passes — It can be checked against evidence.
- Load-bearing: passes — The paper’s conclusions depend on it.
- Based: passes — The paper gives a reason why it holds.
A result the paper reports from its own data — it cites no other source for it, so there is none to check. The quote shows it is in the paper.
In the paper
“The size and fraction of functional elements reconstructed in ancestors shared between the 600-way and smaller alignments of mammals and, separately, avians were also highly similar (Supplementary Figs. 9, 10).”
§ Progressive Cactus is a multiple-genome aligner for the thousand-genome era > 600-way amniote alignment
plain- Asserted: passes — The authors put it forward as true.
- Checkable: passes — It can be checked against evidence.
- Load-bearing: passes — The paper’s conclusions depend on it.
- Based: passes — The paper gives a reason why it holds.
A result the paper reports from its own data — it cites no other source for it, so there is none to check. The quote shows it is in the paper.
In the paper
“As expected, the alignments more strongly agree in functional regions, such as coding exons, than for the genome as a whole (Supplementary Fig. 8).”
§ Progressive Cactus is a multiple-genome aligner for the thousand-genome era > 600-way amniote alignment
boostedcorrelational- Asserted: passes — The authors put it forward as true.
- Checkable: passes — It can be checked against evidence.
- Load-bearing: unclear — It is unclear whether the paper’s conclusions depend on it.
- Based: passes — The paper gives a reason why it holds.
A claim is checked only against the cited paper’s full text, never its abstract, and none is available for its sources.
In the paper
“As an example, the phylogenetic relationship between the species Cuculus canorus, Chlamydotis macqueenii and Tauraco erythrolophus is different in the guide tree based on Prum et al.28 than that based on Jarvis et al.29 (Supplementary Fig. 3).”
§ Progressive Cactus is a multiple-genome aligner for the thousand-genome era > Effect of the guide tree
What the sources say
- Not checked — no full text of the sourcecites [28] Prum, R. O. et al. A comprehensive phylogeny of birds (Aves) using targeted next-generation DNA sequencing. Nature 526, 569–573 (2015). source
- Not checked — no full text of the sourcecites [29] Jarvis, E. D. et al. Whole-genome analyses resolve early branches in the tree of life of modern birds. Science 346, 1320–1331 (2014). source
plainSingle case- Asserted: passes — The authors put it forward as true.
- Checkable: passes — It can be checked against evidence.
- Load-bearing: unclear — It is unclear whether the paper’s conclusions depend on it.
- Based: passes — The paper gives a reason why it holds.
What the paper did — it cites no source for this, so there is none to check. The quote shows it is in the paper.
In the paper
“However, we reduce any effect of the guide tree by including a great deal of outgroup information, including multiple outgroups when possible.”
§ Progressive Cactus is a multiple-genome aligner for the thousand-genome era > Effect of the guide tree
plaindirect- Asserted: passes — The authors put it forward as true.
- Checkable: passes — It can be checked against evidence.
- Load-bearing: passes — The paper’s conclusions depend on it.
- Based: passes — The paper gives a reason why it holds.
A conclusion the paper draws from its own results — it cites no other source for it, so there is none to check. The quote shows it is in the paper.
In the paper
“indicating that the progressive alignment strategy can tolerate poor assemblies.”
§ Progressive Cactus is a multiple-genome aligner for the thousand-genome era > Effect of assembly quality on alignment
hedgeddirect- Asserted: passes — The authors put it forward as true.
- Checkable: passes — It can be checked against evidence.
- Load-bearing: passes — The paper’s conclusions depend on it.
- Based: passes — The paper gives a reason why it holds.
The paper states this without a source or data behind it here, so there is nothing to check it against. The quote shows it is in the paper.
In the paper
“Because Progressive Cactus uses an input guide tree to decompose the alignment problem, the guide tree can potentially impact the resulting alignment.”
§ Progressive Cactus is a multiple-genome aligner for the thousand-genome era > Effect of the guide tree
hedgedconditional- Asserted: passes — The authors put it forward as true.
- Checkable: passes — It can be checked against evidence.
- Load-bearing: passes — The paper’s conclusions depend on it.
- Based: passes — The paper gives a reason why it holds.
A conclusion the paper draws from its own results — it cites no other source for it, so there is none to check. The quote shows it is in the paper.
In the paper
“making alignment of more than about ten vertebrate genomes completely impractical.”
§ Progressive Cactus is a multiple-genome aligner for the thousand-genome era > Main
plaindirect- Asserted: passes — The authors put it forward as true.
- Checkable: passes — It can be checked against evidence.
- Load-bearing: passes — The paper’s conclusions depend on it.
- Based: passes — The paper gives a reason why it holds.
A conclusion the paper draws from its own results — it cites no other source for it, so there is none to check. The quote shows it is in the paper.
In the paper
“which is to our knowledge the largest multiple vertebrate genome alignment created so far.”
§ Progressive Cactus is a multiple-genome aligner for the thousand-genome era > Abstract
hedged- Asserted: passes — The authors put it forward as true.
- Checkable: passes — It can be checked against evidence.
- Load-bearing: passes — The paper’s conclusions depend on it.
- Based: passes — The paper gives a reason why it holds.
The paper states this without a source or data behind it here, so there is nothing to check it against. The quote shows it is in the paper.
In the paper
“the existing implementation scales poorly with increasing numbers of genomes”
§ Progressive Cactus is a multiple-genome aligner for the thousand-genome era > Abstract
plaindirect- Asserted: passes — The authors put it forward as true.
- Checkable: passes — It can be checked against evidence.
- Load-bearing: passes — The paper’s conclusions depend on it.
- Based: passes — The paper gives a reason why it holds.
What the paper did — it cites no source for this, so there is none to check. The quote shows it is in the paper.
In the paper
“it also means that, occasionally, rare stretches of sequence in a newly added genome would not be properly aligned to distant outgroups because they were deleted or missing in the new genome’s close relatives.”
§ Progressive Cactus is a multiple-genome aligner for the thousand-genome era > Methods > Adding a new genome to an existing alignment
hedgeddirect- Asserted: passes — The authors put it forward as true.
- Checkable: passes — It can be checked against evidence.
- Load-bearing: unclear — It is unclear whether the paper’s conclusions depend on it.
- Based: passes — The paper gives a reason why it holds.
A conclusion the paper draws from its own results — it cites no other source for it, so there is none to check. The quote shows it is in the paper.
In the paper
“This prevents any information from the new genome from propagating to the rest of the tree.”
§ Progressive Cactus is a multiple-genome aligner for the thousand-genome era > Methods > Adding a new genome to an existing alignment
plaindirect- Asserted: passes — The authors put it forward as true.
- Checkable: passes — It can be checked against evidence.
- Load-bearing: passes — The paper’s conclusions depend on it.
- Based: passes — The paper gives a reason why it holds.
The paper states this without a source or data behind it here, so there is nothing to check it against. The quote shows it is in the paper.
In the paper
“However, this heuristic performed poorly in the presence of deletions or missing data: any large deletion in one ingroup could cause huge stretches of the other ingroup(s) to be left unaligned.”
§ Progressive Cactus is a multiple-genome aligner for the thousand-genome era > Methods > Removing recoverable chains
hedgeddirect- Asserted: passes — The authors put it forward as true.
- Checkable: passes — It can be checked against evidence.
- Load-bearing: passes — The paper’s conclusions depend on it.
- Based: passes — The paper gives a reason why it holds.
The paper states this without a source or data behind it here, so there is nothing to check it against. The quote shows it is in the paper.
In the paper
“However, because the input local alignments are insensitive, the original alignment relationships are likely to have missed certain homologies.”
§ Progressive Cactus is a multiple-genome aligner for the thousand-genome era > Methods > Removing recoverable chains
hedgedconditional- Asserted: passes — The authors put it forward as true.
- Checkable: passes — It can be checked against evidence.
- Load-bearing: passes — The paper’s conclusions depend on it.
- Based: passes — The paper gives a reason why it holds.
A conclusion the paper draws from its own results — it cites no other source for it, so there is none to check. The quote shows it is in the paper.
In the paper
“The set of primary alignments represents a conservative set of alignment relationships that should include nearly no alignments to ancient paralogues.”
§ Progressive Cactus is a multiple-genome aligner for the thousand-genome era > Methods > Paralogy resolution
hedged- Asserted: passes — The authors put it forward as true.
- Checkable: passes — It can be checked against evidence.
- Load-bearing: passes — The paper’s conclusions depend on it.
- Based: unclear — It is unclear why the paper says it holds.
A conclusion the paper draws from its own results — it cites no other source for it, so there is none to check. The quote shows it is in the paper.
In the paper
“Owing to the long branch length (approximately 0.7 substitutions-per-site divergence between the two clades), the amniote (human–chicken) ancestral assembly has a much lower proportion of reconstructed sequence than its immediate children, the avian and eutherian mammal ancestors”
§ Progressive Cactus is a multiple-genome aligner for the thousand-genome era > 600-way amniote alignment
plaindirect- Asserted: passes — The authors put it forward as true.
- Checkable: passes — It can be checked against evidence.
- Load-bearing: unclear — It is unclear whether the paper’s conclusions depend on it.
- Based: passes — The paper gives a reason why it holds.
A conclusion the paper draws from its own results — it cites no other source for it, so there is none to check. The quote shows it is in the paper.
In the paper
“We have shown that Progressive Cactus can create reference-free alignments of hundreds of vertebrate genomes efficiently.”
§ Progressive Cactus is a multiple-genome aligner for the thousand-genome era > Discussion
boosteddirect- Asserted: passes — The authors put it forward as true.
- Checkable: passes — It can be checked against evidence.
- Load-bearing: passes — The paper’s conclusions depend on it.
- Based: passes — The paper gives a reason why it holds.
A conclusion the paper draws from its own results — it cites no other source for it, so there is none to check. The quote shows it is in the paper.
In the paper
“If the MRCA species in the HAL tree is a descendant of the MRCA species within the reconciled ML tree, that implies that there are paralogues represented as orthologues within the HAL tree (since a duplication event must have been resolved too early).”
§ Progressive Cactus is a multiple-genome aligner for the thousand-genome era > Methods > Paralogy resolution
plaindirect- Asserted: passes — The authors put it forward as true.
- Checkable: passes — It can be checked against evidence.
- Load-bearing: passes — The paper’s conclusions depend on it.
- Based: passes — The paper gives a reason why it holds.
- Rests on an assumption: The approximately maximum-likelihood trees independently re-estimated by FastTree from the same regions are accurate enough to serve as a reference against which errors in the HAL trees can be detected.
The paper states this without a source or data behind it here, so there is nothing to check it against. The quote shows it is in the paper.
In the paper
“The core of what makes the progressive alignment algorithm possible is the ancestral reconstruction generated in each subproblem.”
§ Progressive Cactus is a multiple-genome aligner for the thousand-genome era > Methods > Ancestral genome reconstruction
plaindirect- Asserted: passes — The authors put it forward as true.
- Checkable: passes — It can be checked against evidence.
- Load-bearing: passes — The paper’s conclusions depend on it.
- Based: passes — The paper gives a reason why it holds.
A conclusion the paper draws from its own results — it cites no other source for it, so there is none to check. The quote shows it is in the paper.
In the paper
“However, in regions that have undergone many rounds of lineage-specific duplications (which should all be aligned together in the restricted duplication-timing problem we described above), the set of primary alignments will often by chance not align all copies together.”
§ Progressive Cactus is a multiple-genome aligner for the thousand-genome era > Methods > Paralogy resolution
hedgedconditional- Asserted: passes — The authors put it forward as true.
- Checkable: passes — It can be checked against evidence.
- Load-bearing: passes — The paper’s conclusions depend on it.
- Based: unclear — It is unclear why the paper says it holds.
A conclusion the paper draws from its own results — it cites no other source for it, so there is none to check. The quote shows it is in the paper.
In the paper
“This is probably because tens of thousands of fewer paralogous transcripts were filtered out in the initial filtering phase of CAT (Supplementary Table 15), reducing confusion about which transcript projection to put into the gene set.”
§ Progressive Cactus is a multiple-genome aligner for the thousand-genome era > Methods > Paralogy resolution
hedgedconditional- Asserted: passes — The authors put it forward as true.
- Checkable: passes — It can be checked against evidence.
- Load-bearing: unclear — It is unclear whether the paper’s conclusions depend on it.
- Based: passes — The paper gives a reason why it holds.
A conclusion the paper draws from its own results — it cites no other source for it, so there is none to check. The quote shows it is in the paper.
In the paper
“Owing to this fact, to determine the recoverability status of all blocks, we only have to examine the blocks at the ends of chains and their immediate neighbours, rather than every block.”
§ Progressive Cactus is a multiple-genome aligner for the thousand-genome era > Methods > Removing recoverable chains
plain- Asserted: passes — The authors put it forward as true.
- Checkable: passes — It can be checked against evidence.
- Load-bearing: passes — The paper’s conclusions depend on it.
- Based: passes — The paper gives a reason why it holds.
What the paper did — it cites no source for this, so there is none to check. The quote shows it is in the paper.
In the paper
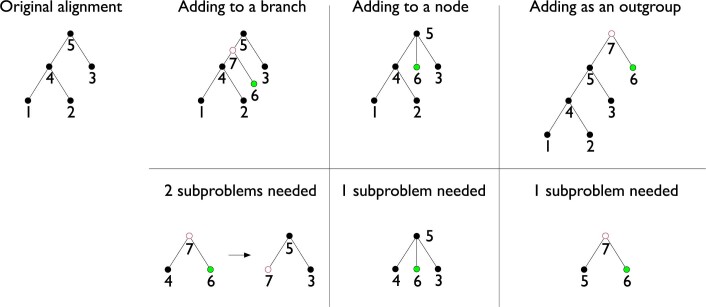
“After the addition of a new genome as an ingroup (by adding it to a node or a branch), at most a single ancestral sequence is re-inferred.”
§ Progressive Cactus is a multiple-genome aligner for the thousand-genome era > Methods > Adding a new genome to an existing alignment
plain- Asserted: passes — The authors put it forward as true.
- Checkable: passes — It can be checked against evidence.
- Load-bearing: passes — The paper’s conclusions depend on it.
- Based: passes — The paper gives a reason why it holds.
A conclusion the paper draws from its own results — it cites no other source for it, so there is none to check. The quote shows it is in the paper.
In the paper
“To our knowledge, this represents the largest whole-genome alignment created so far.”
§ Progressive Cactus is a multiple-genome aligner for the thousand-genome era > 600-way amniote alignment
hedged- Asserted: passes — The authors put it forward as true.
- Checkable: passes — It can be checked against evidence.
- Load-bearing: unclear — It is unclear whether the paper’s conclusions depend on it.
- Based: passes — The paper gives a reason why it holds.
A conclusion the paper draws from its own results — it cites no other source for it, so there is none to check. The quote shows it is in the paper.
In the paper
“We focus on creating a reference-free alignment and ancestral reconstruction, allowing analysis of genome evolution throughout the entire tree rather than in comparison to one anointed reference.”
§ Progressive Cactus is a multiple-genome aligner for the thousand-genome era > Discussion
plaindirect- Asserted: passes — The authors put it forward as true.
- Checkable: passes — It can be checked against evidence.
- Load-bearing: passes — The paper’s conclusions depend on it.
- Based: passes — The paper gives a reason why it holds.
A conclusion the paper draws from its own results — it cites no other source for it, so there is none to check. The quote shows it is in the paper.
In the paper
“We have found outgroup selection to be absolutely crucial in creating an acceptable ancestral reconstruction: any missing data or misassembly in the outgroup that causes a true deletion in one of the ingroups to be misinterpreted as an insertion in others will mean that the ancestor contains less sequence than it ought to.”
§ Progressive Cactus is a multiple-genome aligner for the thousand-genome era > Methods > Local alignment and outgroup selection
boosteddirect- Asserted: passes — The authors put it forward as true.
- Checkable: passes — It can be checked against evidence.
- Load-bearing: passes — The paper’s conclusions depend on it.
- Based: passes — The paper gives a reason why it holds.
A conclusion the paper draws from its own results — it cites no other source for it, so there is none to check. The quote shows it is in the paper.
In the paper
“The relationship is transitive: if block A is recoverable given block B, and B is recoverable given C, then A is recoverable given C.”
§ Progressive Cactus is a multiple-genome aligner for the thousand-genome era > Methods > Removing recoverable chains
plaincorrelational- Asserted: passes — The authors put it forward as true.
- Checkable: passes — It can be checked against evidence.
- Load-bearing: passes — The paper’s conclusions depend on it.
- Based: unclear — It is unclear why the paper says it holds.
A conclusion the paper draws from its own results — it cites no other source for it, so there is none to check. The quote shows it is in the paper.
In the paper
“Although this history is by its nature only a hypothetical reconstruction of the true history of genome evolution along the tree, it is accurate enough to be useful.”
§ Progressive Cactus is a multiple-genome aligner for the thousand-genome era > 600-way amniote alignment
plain- Asserted: passes — The authors put it forward as true.
- Checkable: unclear — It is unclear whether it could be checked against evidence.
- Load-bearing: passes — The paper’s conclusions depend on it.
- Based: passes — The paper gives a reason why it holds.
A conclusion the paper draws from its own results — it cites no other source for it, so there is none to check. The quote shows it is in the paper.
In the paper
“Similarly, if any block in a chain is recoverable given another block above the chain in the chain/net hierarchy, the entire chain is recoverable given that block.”
§ Progressive Cactus is a multiple-genome aligner for the thousand-genome era > Methods > Removing recoverable chains
plaindirect- Asserted: passes — The authors put it forward as true.
- Checkable: passes — It can be checked against evidence.
- Load-bearing: passes — The paper’s conclusions depend on it.
- Based: passes — The paper gives a reason why it holds.
A conclusion the paper draws from its own results — it cites no other source for it, so there is none to check. The quote shows it is in the paper.
In the paper
“All blocks in a chain are recoverable given each other, since all blocks in a chain are collinear with each other, potentially with intervening rearrangements located further down the chain/net hierarchy.”
§ Progressive Cactus is a multiple-genome aligner for the thousand-genome era > Methods > Removing recoverable chains
plaindirect- Asserted: passes — The authors put it forward as true.
- Checkable: passes — It can be checked against evidence.
- Load-bearing: passes — The paper’s conclusions depend on it.
- Based: passes — The paper gives a reason why it holds.
The paper states this without a source or data behind it here, so there is nothing to check it against. The quote shows it is in the paper.
In the paper
“Naively aligning each ingroup against multiple outgroups would significantly increase the computation time”
§ Progressive Cactus is a multiple-genome aligner for the thousand-genome era > Methods > Local alignment and outgroup selection
hedgeddirect- Asserted: passes — The authors put it forward as true.
- Checkable: passes — It can be checked against evidence.
- Load-bearing: passes — The paper’s conclusions depend on it.
- Based: passes — The paper gives a reason why it holds.
A conclusion the paper draws from its own results — it cites no other source for it, so there is none to check. The quote shows it is in the paper.
In the paper
“Similarly, if the MRCA species within the HAL tree is an ancestor of that within the reconciled ML tree, a duplication event must have been resolved too late in the HAL tree, indicating additional false loss or deletion events.”
§ Progressive Cactus is a multiple-genome aligner for the thousand-genome era > Methods > Paralogy resolution
hedgeddirect- Asserted: passes — The authors put it forward as true.
- Checkable: passes — It can be checked against evidence.
- Load-bearing: passes — The paper’s conclusions depend on it.
- Based: passes — The paper gives a reason why it holds.
- Rests on an assumption: The approximately maximum-likelihood trees independently re-estimated by FastTree from the same regions are accurate enough to serve as a reference against which errors in the HAL trees can be detected.
- Probably not a substantial claim. 27
- It may state two separate claims as one. 38
The cited sources support only part of this claim — read each source’s verdict below.
In the paper
“Progressive Cactus has been developed over several years, and has already been successfully used as an integral component of high-profile comparative genomics projects16–20.”
§ Progressive Cactus is a multiple-genome aligner for the thousand-genome era > Main
What the sources say
- Partly supportedcites [16] Green, R. E. et al. Three crocodilian genomes reveal ancestral patterns of evolution among archosaurs. Science 346, 1254449 (2014). sourceExperimental — accuracy not yet measured
The Materials and Methods section (“Genome alignments and ancestral genome reconstruction”; page unavailable) says progressive-cactus computed the 23-taxon whole-genome alignment, supporting its use as an integral component of this comparative genomics project. The paper does not establish that Progressive Cactus had been developed over several years; its References section cites a 2011 paper on Cactus, but gives no development timeline for Progressive Cactus. (LLM, conf=0.85)
- Partly supportedcites [17] Dobrynin, P. et al. Genomic legacy of the African cheetah, Acinonyx jubatus. Genome Biol. 16, 277 (2015). sourceExperimental — accuracy not yet measured
The Results and Materials and methods (pages unavailable) report that Progressive Cactus was used to align the cheetah genome with other mammalian genomes, supporting its use in a comparative genomics project. This paper does not establish that the software was developed over several years or used in multiple projects. (LLM, conf=0.87)
- Could not verifycites [18] Gordon, D. et al. Long-read sequence assembly of the gorilla genome. Science 352, aae0344 (2016). sourceExperimental — accuracy not yet measured
The Abstract and Comparative analyses section describe a gorilla-genome assembly and comparisons with human, but do not identify Progressive Cactus as a component. Searches for “Progressive Cactus” and Cactus genome alignment found no passage addressing its use in this project or its development over several years. Page numbers were not available in our copy. (LLM, conf=0.70)
- Supportedcites [19] Lilue, J. et al. Sixteen diverse laboratory mouse reference genomes define strain-specific haplotypes and novel functional loci. Nat. Genet. 50, 1574–1583 (2018). source
The Online Methods section (‘Gene prediction and annotation’; page unavailable) says progressiveCactus alignments were used to generate orthologs and contribute to the final gene annotations for this sixteen-strain mouse genome project. That confirms this paper as an example of a substantial comparative-genomics project using the tool as an integral component. The paper does not itself establish the broader development timeline, which the citing sentence attributes to a group of references rather than this example alone. (LLM, conf=0.88)
- Could not verifycites [20] Kronenberg, Z. N. et al. High-resolution comparative analysis of great ape genomes. Science 360, eaar6343 (2018). sourceExperimental — accuracy not yet measured
The Results (Comparative sequence analyses; page unavailable) describe a five-way great ape genome alignment, but do not identify Progressive Cactus as a component. Searches for “Progressive Cactus” and “Cactus alignments” found only a reference to an earlier Cactus paper, not evidence that this project used Progressive Cactus or that it had been developed over several years. (LLM, conf=0.76)
plain- Asserted: passes — The authors put it forward as true.
- Checkable: passes — It can be checked against evidence.
- Load-bearing: fails — The paper’s conclusions may not depend on it.
- Based: passes — The paper gives a reason why it holds.
Probably not a substantial claim. The paper’s conclusions may not depend on it. It may state two separate claims as one.
- Partly supported
Every source the paper cites for this claim was checked and supports it.
In the paper
“the number of vertebrate genome assemblies currently in the NCBI (National Center for Biotechnology Information) database4 increased by more than 50% to 1,485 assemblies in the year from July 2018 to July 2019.”
§ Progressive Cactus is a multiple-genome aligner for the thousand-genome era > Abstract
What the sources say
- Supportedcites [4] Kitts, P. A. et al. Assembly: a resource for assembled genomes at NCBI. Nucleic Acids Res. 44 (D1), D73–D80 (2016). source
The citation is attached to the identification of the NCBI database, not to the subsequent July 2018–July 2019 count. The WEB ACCESS section identifies the NCBI Assembly Resource as a way to find genome assemblies; the paper does not provide the later count. (LLM, conf=0.90)
plaindirect- Asserted: passes — The authors put it forward as true.
- Checkable: passes — It can be checked against evidence.
- Load-bearing: fails — The paper’s conclusions may not depend on it.
- Based: passes — The paper gives a reason why it holds.
Probably not a substantial claim. The paper’s conclusions may not depend on it.
- Supported
Every source the paper cites for this claim was checked and supports it.
In the paper
“new human de novo assemblies5 are being produced, which enable the analysis of not only small polymorphisms, but also complex, large-scale structural differences between human individuals and haplotypes.”
§ Progressive Cactus is a multiple-genome aligner for the thousand-genome era > Abstract
What the sources say
- Supportedcites [5] Jain, M. et al. Nanopore sequencing and assembly of a human genome with ultra-long reads. Nat. Biotechnol. 36, 338–345 (2018). source
The Results (De novo assembly of nanopore reads; page unavailable) describe a human de novo assembly and structural differences between GM12878 and the GRCh38 reference. The Results (SNP and SV genotyping; page unavailable) address small variants, while the Results (Ultra-long reads improve phasing and assembly contiguity; page unavailable) describe assembly and phasing of two MHC haplotypes. Together, these support the cited example of assemblies enabling analysis at both scales. (LLM, conf=0.88)
plaindirect- Asserted: passes — The authors put it forward as true.
- Checkable: passes — It can be checked against evidence.
- Load-bearing: fails — The paper’s conclusions may not depend on it.
- Based: passes — The paper gives a reason why it holds.
Probably not a substantial claim. The paper’s conclusions may not depend on it. It may state two separate claims as one.
- Supported
Every source the paper cites for this claim was checked and supports it.
In the paper
“Cactus6, a reference-free multiple genome alignment program, has been shown to be highly accurate”
§ Progressive Cactus is a multiple-genome aligner for the thousand-genome era > Abstract
What the sources say
- Supportedcites [6] Paten, B. et al. Cactus: algorithms for genome multiple sequence alignment. Genome Res. 21, 1512–1528 (2011). source
The Cactus implementation section describes a multiple-genome alignment program whose basic inputs are genomes and a relationship tree, with no designated reference genome. The Discussion reports good precision and recall and says its alignments outperformed the programs compared in the study, supporting the accuracy claim. (LLM, conf=0.88)
plain- Asserted: passes — The authors put it forward as true.
- Checkable: passes — It can be checked against evidence.
- Load-bearing: passes — The paper’s conclusions depend on it.
- Based: passes — The paper gives a reason why it holds.
It may state two separate claims as one.
- Supported
The cited sources support only part of this claim — read each source’s verdict below.
In the paper
“The amniote-wide alignment combines two smaller alignments: one created for the initial release of the Zoonomia project31, which includes 242 placental mammals representing most eutherian mammal families, and one for the Bird 10,000 genomes (B10K) project32, which includes 363 avians, also representing most bird families.”
§ Progressive Cactus is a multiple-genome aligner for the thousand-genome era > 600-way amniote alignment
What the sources say
- Partly supportedcites [31] Zoonomia Consortium. A comparative genomics multitool for scientific discovery and conservation. Nature https://doi.org/10.1038/s41586-020-2876-6 (2020). sourceExperimental — accuracy not yet measured
Split into 2 atoms — 0 confirmed, 2 partially supported, 0 disputed, 0 misattributed, 0 unverifiable. Expand the claim to see per-atom verdicts.
- Supportedcites [32] Feng, S. et al. Dense sampling of bird diversity increases power of comparative genomics. Nature https://doi.org/10.1038/s41586-020-2873-9 (2020). source
Split into 2 atoms — 2 confirmed, 0 partially supported, 0 disputed, 0 misattributed, 0 unverifiable. Expand the claim to see per-atom verdicts.
plain- Asserted: passes — The authors put it forward as true.
- Checkable: passes — It can be checked against evidence.
- Load-bearing: passes — The paper’s conclusions depend on it.
- Based: passes — The paper gives a reason why it holds.
It may state two separate claims as one.
- Partly supported
Every source the paper cites for this claim was checked and supports it.
In the paper
“The version of Cactus available in 2012 performed very well in the Alignathon14, an evaluation of genome aligners.”
§ Progressive Cactus is a multiple-genome aligner for the thousand-genome era > Main
What the sources say
- Supportedcites [14] Earl, D. et al. Alignathon: a competitive assessment of whole-genome alignment methods. Genome Res. 24, 2077–2089 (2014). source
The Results section on competition organization says submissions were due in February 2012 and identifies Cactus among the tools tested. The genome-wide simulation results call Cactus the strongest mammal submission, while the fly results report high relative coverage and pseudo F-scores for Cactus. Together, these support the claim that the Cactus version entered at the time performed very well. (LLM, conf=0.91)
boosted- Asserted: passes — The authors put it forward as true.
- Checkable: passes — It can be checked against evidence.
- Load-bearing: fails — The paper’s conclusions may not depend on it.
- Based: passes — The paper gives a reason why it holds.
Probably not a substantial claim. The paper’s conclusions may not depend on it.
- Supported
Every source the paper cites for this claim was checked and supports it.
In the paper
“Cactus6 is a genome alignment program that has neither of these restrictions; it can generate a reference-free multiple alignment that allows the detection of multiple-orthology relationships.”
§ Progressive Cactus is a multiple-genome aligner for the thousand-genome era > Main
What the sources say
- Supportedcites [6] Paten, B. et al. Cactus: algorithms for genome multiple sequence alignment. Genome Res. 21, 1512–1528 (2011). source
The Cactus implementation section describes a genome multiple-alignment program whose inputs are genomes and a relationship tree, without a designated reference genome. The Discussion says its alignments accommodate duplications, and Primate gene alignments reports that Cactus aligned both copies in tandem-duplication cases. Together, these passages support the claimed reference-free alignment and ability to detect relationships involving multiple copies. (LLM, conf=0.86)
plain- Asserted: passes — The authors put it forward as true.
- Checkable: passes — It can be checked against evidence.
- Load-bearing: passes — The paper’s conclusions depend on it.
- Based: passes — The paper gives a reason why it holds.
It may state two separate claims as one.
- Supported
The cited sources support only part of this claim — read each source’s verdict below.
In the paper
“New genome assemblies have been arriving at a rapidly increasing pace, thanks to decreases in sequencing costs and improvements in third-generation sequencing technologies1–3.”
§ Progressive Cactus is a multiple-genome aligner for the thousand-genome era > Abstract
What the sources say
- Not checked — no full text of the sourcecites [1] Eid, J. et al. Real-time DNA sequencing from single polymerase molecules. Science 323, 133–138 (2009). source
- Partly supportedcites [2] Weisenfeld, N. I., Kumar, V., Shah, P., Church, D. M. & Jaffe, D. B. Direct determination of diploid genome sequences. Genome Res. 27, 757–767 (2017). sourceExperimental — accuracy not yet measured
The Discussion (page unavailable) says the low cost of the authors’ assembly method makes it applicable to large-scale projects. It does not establish that new assemblies were arriving at a rapidly increasing pace, or attribute such a trend to falling sequencing costs and improvements in third-generation sequencing technologies. (LLM, conf=0.78)
- Partly supportedcites [3] Jain, M., Olsen, H. E., Paten, B. & Akeson, M. The Oxford Nanopore MinION: delivery of nanopore sequencing to the genomics community. Genome Biol. 17, 239 (2016). sourceExperimental — accuracy not yet measured
The De novo assembly section (page unavailable) describes how nanopore sequencing has enabled new assembly methods and reports a genome assembled using only MinION data. The Conclusions (page unavailable) say MinION performance improved rapidly. Neither passage establishes that new genome assemblies are arriving at a rapidly increasing pace or attributes that pace to falling sequencing costs. (LLM, conf=0.82)
plaindirect- Asserted: passes — The authors put it forward as true.
- Checkable: passes — It can be checked against evidence.
- Load-bearing: passes — The paper’s conclusions depend on it.
- Based: passes — The paper gives a reason why it holds.
Probably not a substantial claim.
Every source the paper cites for this claim was checked and supports it.
In the paper
“Progressive alignment has been successfully applied to whole-genome alignment before—for example, by progressiveMauve21 and TBA/MULTIZ22.”
§ Progressive Cactus is a multiple-genome aligner for the thousand-genome era > Progressive Cactus
What the sources say
- Supportedcites [21] Darling, A. E., Mau, B. & Perna, N. T. progressiveMauve: multiple genome alignment with gene gain, loss and rearrangement. PLoS One 5, e11147 (2010). source
The Methods section (“Anchoring guide tree construction,” page unavailable) says progressiveMauve computes alignment anchors progressively according to a guide tree. The Results section (“Accuracy in the face of gain, loss, and rearrangement,” page unavailable) reports that it accurately aligns genomes across substantial rearrangement. The citing sentence assigns TBA/MULTIZ a separate citation, so that example is not attributed to this source. (LLM, conf=0.91)
- Supportedcites [22] Blanchette, M. et al. Aligning multiple genomic sequences with the threaded blockset aligner. Genome Res. 14, 708–715 (2004). source
The “How TBA Was Built” section describes TBA combining alignments across the subtrees of a phylogenetic tree using MULTIZ, supporting its identification as a progressive aligner. The “Whole-Genome Alignments on the Santa Cruz Genome Browser” section reports MULTIZ alignments of the human, mouse, and rat genomes. This citation supports the TBA/MULTIZ example; it does not need to substantiate the separately cited progressiveMauve example. (LLM, conf=0.90)
boosted- Asserted: passes — The authors put it forward as true.
- Checkable: passes — It can be checked against evidence.
- Load-bearing: fails — The paper’s conclusions may not depend on it.
- Based: passes — The paper gives a reason why it holds.
Probably not a substantial claim. The paper’s conclusions may not depend on it.
- Supported
The cited sources support only part of this claim — read each source’s verdict below.
In the paper
“The Vertebrate Genomes Project38 led by the Genome 10K39 and the Earth BioGenome Project40, among others, aim to release thousands of new, high-quality genome assemblies over the next decade.”
§ Progressive Cactus is a multiple-genome aligner for the thousand-genome era > Discussion
What the sources say
- Supportedcites [38] Rhie, A. et al. Towards complete and error-free genome assemblies of all vertebrate species. Preprint at https://doi.org/10.1101/2020.05.22.110833 (2020). source
The Main section says Genome 10K initiated the VGP to produce publicly available, high-quality assemblies for 71,657 vertebrate species. The assembly-availability passage states a goal of completing approximately 70,000 species within a 10-year period, conditional on funding and infrastructure. The paper also identifies the Earth BioGenome Project as a related large-scale effort; the VGP citation supports the VGP portion of the citing sentence. (LLM, conf=0.91)
- Partly supportedcites [39] Koepfli, K.-P., Paten, B., the Genome 10K Community of Scientists & O’Brien, S. J. The Genome 10K Project: a way forward. Ann. Rev. Animal Biosci. 3, 57–111 (2015). sourceExperimental — accuracy not yet measured
The Introduction identifies Genome 10K’s goal of sequencing 10,000 vertebrate genomes and says the project facilitates release of genome data and develops assembly standards. But The Genomic Road Ahead says it is difficult to estimate how genome science will change in the next decade; it does not commit to releasing thousands of high-quality assemblies within that period. This verdict concerns the Genome 10K citation, not the separately cited projects. (LLM, conf=0.86)
- Supportedcites [40] Lewin, H. A. et al. Earth BioGenome Project: Sequencing life for the future of life. Proc. Natl Acad. Sci. USA 115, 4325–4333 (2018) source
Citation 40 is attached to the Earth BioGenome Project, so the verdict concerns that project rather than the separately cited Vertebrate Genomes Project and Genome 10K. The 10-Year Road Map calls for approximately 9,000 high-quality, chromosome-scale reference assemblies in its first three years, within a ten-year sequencing plan; the Abstract describes the intended genomic resource as open and freely available. Page numbers are unavailable in our copy. (LLM, conf=0.91)
plain- Asserted: passes — The authors put it forward as true.
- Checkable: passes — It can be checked against evidence.
- Load-bearing: passes — The paper’s conclusions depend on it.
- Based: passes — The paper gives a reason why it holds.
Probably not a substantial claim.
- Supported
Every source the paper cites for this claim was checked and supports it.
In the paper
“As the average assembly becomes ever more complete and accurate38, the value of such a reference-free approach grows.”
§ Progressive Cactus is a multiple-genome aligner for the thousand-genome era > Discussion
What the sources say
- Supportedcites [38] Rhie, A. et al. Towards complete and error-free genome assemblies of all vertebrate species. Preprint at https://doi.org/10.1101/2020.05.22.110833 (2020). source
The citation is attached to the claim that assemblies are becoming more complete and accurate, not to the authors’ conclusion about a reference-free approach. The Main section describes advances that make high-quality reference genomes feasible at scale, and the section on assembly curation reports greater continuity and structural accuracy for long-read assemblies than for earlier short-read assemblies. No page numbers are available in our copy. (LLM, conf=0.85)
plaindirect- Asserted: passes — The authors put it forward as true.
- Checkable: fails — It may be too vague to check against evidence.
- Load-bearing: fails — The paper’s conclusions may not depend on it.
- Based: passes — The paper gives a reason why it holds.
Probably not a substantial claim. It may be too vague to check against evidence. The paper’s conclusions may not depend on it.
- Supported
The cited sources support only part of this claim — read each source’s verdict below.
In the paper
“Similarly driven by technology improvements, sequencing efforts will increasingly produce multiple, phased de novo assemblies from different individuals in a population41.”
§ Progressive Cactus is a multiple-genome aligner for the thousand-genome era > Discussion
What the sources say
- Partly supportedcites [41] Shafin, K. et al. Nanopore sequencing and the Shasta toolkit enable efficient de novo assembly of eleven human genomes. Nat. Biotechnol. 38, 1044–1053 (2020). sourceExperimental — accuracy not yet measured
The Discussion (page unavailable) reports efficient de novo assembly of 11 human genomes and anticipates that the toolkit could help produce phased assemblies. The Methods’ Sample selection section (page unavailable) describes selecting individuals to capture allelic diversity. The paper does not explicitly predict that sequencing efforts will increasingly produce multiple phased assemblies across a population; phasing is presented as a promising next step. (LLM, conf=0.82)
plaindirect- Asserted: passes — The authors put it forward as true.
- Checkable: passes — It can be checked against evidence.
- Load-bearing: fails — The paper’s conclusions may not depend on it.
- Based: passes — The paper gives a reason why it holds.
Probably not a substantial claim. The paper’s conclusions may not depend on it.
- Partly supported
The cited sources that could be checked couldn’t confirm or dispute this claim.
In the paper
“Alignment projection-mapping methods were previously shown53 to align more UTR bases than translated methods.”
§ Progressive Cactus is a multiple-genome aligner for the thousand-genome era > Methods > Transcript and gene alignment subsets and comparison
What the sources say
- Could not verifycites [53] Ondov, B. D. et al. Mash: fast genome and metagenome distance estimation using MinHash. Genome Biol. 17, 132 (2016). sourceExperimental — accuracy not yet measured
The Background section describes Mash’s alignment-free distance estimates and compares them with alignment-based measures, but does not compare projection-mapping with translated methods. Searches for UTR bases, projection mapping, and untranslated regions found no passage addressing which method aligns more UTR bases. (LLM, conf=0.77)
plaindirect- Asserted: passes — The authors put it forward as true.
- Checkable: passes — It can be checked against evidence.
- Load-bearing: fails — The paper’s conclusions may not depend on it.
- Based: passes — The paper gives a reason why it holds.
Probably not a substantial claim. The paper’s conclusions may not depend on it.
- Could not verify
Every source the paper cites for this claim was checked and supports it.
In the paper
“The B10K32 and Zoonomia31 consortia are using this alignment for comparative analysis, for example, analysing patterns of selection in unprecedented detail.”
§ Progressive Cactus is a multiple-genome aligner for the thousand-genome era > Discussion
What the sources say
- Supportedcites [32] Feng, S. et al. Dense sampling of bird diversity increases power of comparative genomics. Nature https://doi.org/10.1038/s41586-020-2873-9 (2020). source
The citation to this paper is attached to B10K, not Zoonomia. In Methods > Selection analysis on whole-genome alignments (page unavailable), the authors report using the B10K Project alignment to calculate conservation and acceleration scores, supporting its use for comparative analysis of selection. (LLM, conf=0.91)
- Supportedcites [31] Zoonomia Consortium. A comparative genomics multitool for scientific discovery and conservation. Nature https://doi.org/10.1038/s41586-020-2876-6 (2020). source
The Whole-genome alignment section says the Zoonomia researchers aligned 240 mammalian genomes as part of a 600-way pan-amniote alignment and used it to detect purifying selection at individual bases. That supports the Zoonomia portion of the sentence; B10K has a separate citation and is not attributed to this source. (LLM, conf=0.92)
plain- Asserted: passes — The authors put it forward as true.
- Checkable: passes — It can be checked against evidence.
- Load-bearing: fails — The paper’s conclusions may not depend on it.
- Based: passes — The paper gives a reason why it holds.
Probably not a substantial claim. The paper’s conclusions may not depend on it.
- Supported
A result the paper reports from its own data — it cites no other source for it, so there is none to check. The quote shows it is in the paper.
In the paper
“The alignments using the progressive strategy finished more quickly, with the speed improvement growing larger with the increasing number of species (for example, a 15% reduction in runtime for 10 species and 48% for 20 species)”
§ Progressive Cactus is a multiple-genome aligner for the thousand-genome era > Evaluation on simulated data
plaindirect- Asserted: passes — The authors put it forward as true.
- Checkable: passes — It can be checked against evidence.
- Load-bearing: passes — The paper’s conclusions depend on it.
- Based: passes — The paper gives a reason why it holds.
It may state two separate claims as one.
A result the paper reports from its own data — it cites no other source for it, so there is none to check. The quote shows it is in the paper.
In the paper
“owing to its linear runtime scaling, as opposed to the quadratic scaling of the star-tree”
§ Progressive Cactus is a multiple-genome aligner for the thousand-genome era > Evaluation on simulated data
plaindirect- Asserted: passes — The authors put it forward as true.
- Checkable: passes — It can be checked against evidence.
- Load-bearing: passes — The paper’s conclusions depend on it.
- Based: passes — The paper gives a reason why it holds.
It may state two separate claims as one.
In the paper
“we present fundamental changes to the Cactus process that incorporate a progressive alignment strategy15, which changes the runtime of the alignment to scale linearly with the number of genomes.”
§ Progressive Cactus is a multiple-genome aligner for the thousand-genome era > Main
What the sources say
- Not checked — no full text of the sourcecites [15] Feng, D. F. & Doolittle, R. F. Progressive sequence alignment as a prerequisite to correct phylogenetic trees. J. Mol. Evol. 25, 351–360 (1987). source
plaindirect- Asserted: passes — The authors put it forward as true.
- Checkable: passes — It can be checked against evidence.
- Load-bearing: passes — The paper’s conclusions depend on it.
- Based: passes — The paper gives a reason why it holds.
It may state two separate claims as one.
A result the paper reports from its own data — it cites no other source for it, so there is none to check. The quote shows it is in the paper.
In the paper
“Progressive Cactus produces alignments with higher accuracy for both simulated primate (F1 score of 0.989) and mammal (F1 score of 0.795) clades than any aligner that participated in the Alignathon (Supplementary Tables 1, 2), including the original version of Cactus.”
§ Progressive Cactus is a multiple-genome aligner for the thousand-genome era > Evaluation on simulated data
plain- Asserted: passes — The authors put it forward as true.
- Checkable: passes — It can be checked against evidence.
- Load-bearing: passes — The paper’s conclusions depend on it.
- Based: passes — The paper gives a reason why it holds.
It may state two separate claims as one.
The paper states this without a source or data behind it here, so there is nothing to check it against. The quote shows it is in the paper.
In the paper
“using Toil, we can break up the problem into small pieces that can work in heterogeneous compute environments”
§ Progressive Cactus is a multiple-genome aligner for the thousand-genome era > Progressive Cactus
plaindirect- Asserted: passes — The authors put it forward as true.
- Checkable: passes — It can be checked against evidence.
- Load-bearing: fails — The paper’s conclusions may not depend on it.
- Based: passes — The paper gives a reason why it holds.
Probably not a substantial claim. The paper’s conclusions may not depend on it.
- Rests on an assumption: Genome alignment is a computationally intensive task.
The paper states this without a source or data behind it here, so there is nothing to check it against. The quote shows it is in the paper.
In the paper
“Progressive Cactus, which enables the reference-free alignment of tens to thousands of large vertebrate genomes while maintaining high alignment quality.”
§ Progressive Cactus is a multiple-genome aligner for the thousand-genome era > Abstract
plaindirect- Asserted: passes — The authors put it forward as true.
- Checkable: passes — It can be checked against evidence.
- Load-bearing: passes — The paper’s conclusions depend on it.
- Based: passes — The paper gives a reason why it holds.
It may state two separate claims as one.
The paper states this without a source or data behind it here, so there is nothing to check it against. The quote shows it is in the paper.
In the paper
“The outgroup genomes serve to answer the question of what sequence from the ingroups is also present in the ancestor (whether an indel among the ingroups is likely to be a deletion rather than an insertion), and in how many copies (whether a duplication predates or postdates the speciation event the node represents).”
§ Progressive Cactus is a multiple-genome aligner for the thousand-genome era > Progressive Cactus
plaindirect- Asserted: passes — The authors put it forward as true.
- Checkable: passes — It can be checked against evidence.
- Load-bearing: passes — The paper’s conclusions depend on it.
- Based: passes — The paper gives a reason why it holds.
Probably not a substantial claim. It may state two separate claims as one.
A result the paper reports from its own data — it cites no other source for it, so there is none to check. The quote shows it is in the paper.
In the paper
“The F1 score for aligned pairs within this clade between the two alignments was 0.972, lower but comparable to the score for a similar clade that had an identical phylogenetic relationship in both trees, 0.982 (for Merops nubicus, Picoides pubescens and Buceros rhinoceros).”
§ Progressive Cactus is a multiple-genome aligner for the thousand-genome era > Effect of the guide tree
plain- Asserted: passes — The authors put it forward as true.
- Checkable: passes — It can be checked against evidence.
- Load-bearing: unclear — It is unclear whether the paper’s conclusions depend on it.
- Based: passes — The paper gives a reason why it holds.
It may state two separate claims as one.
A result the paper reports from its own data — it cites no other source for it, so there is none to check. The quote shows it is in the paper.
In the paper
“To demonstrate Progressive Cactus, we present results from an alignment of 605 amniote genomes, relating in a reference-free manner to more than 1 trillion bases of DNA across hundreds of millions of years of genome evolution (an estimated 35.4 neutral substitutions per site).”
§ Progressive Cactus is a multiple-genome aligner for the thousand-genome era > 600-way amniote alignment
hedged- Asserted: passes — The authors put it forward as true.
- Checkable: passes — It can be checked against evidence.
- Load-bearing: passes — The paper’s conclusions depend on it.
- Based: passes — The paper gives a reason why it holds.
It may state two separate claims as one.
A result the paper reports from its own data — it cites no other source for it, so there is none to check. The quote shows it is in the paper.
In the paper
“Of the aligned pairs in the induced pairwise Progressive Cactus alignments, 82% were found in the chains and nets alignment, and, vice versa, 78% of pairs in the chains and nets alignment were found in each Progressive Cactus alignment.”
§ Progressive Cactus is a multiple-genome aligner for the thousand-genome era > Effect of assembly quality on alignment
plaincorrelational- Asserted: passes — The authors put it forward as true.
- Checkable: passes — It can be checked against evidence.
- Load-bearing: unclear — It is unclear whether the paper’s conclusions depend on it.
- Based: passes — The paper gives a reason why it holds.
It may state two separate claims as one.
A result the paper reports from its own data — it cites no other source for it, so there is none to check. The quote shows it is in the paper.
In the paper
“The progressive strategy is also more accurate than the star strategy (Fig. 2b) and maintains accuracy as the number of species (and therefore nodes in the tree) increases.”
§ Progressive Cactus is a multiple-genome aligner for the thousand-genome era > Evaluation on simulated data
plaindirect- Asserted: passes — The authors put it forward as true.
- Checkable: passes — It can be checked against evidence.
- Load-bearing: passes — The paper’s conclusions depend on it.
- Based: passes — The paper gives a reason why it holds.
It may state two separate claims as one.
The paper states this without a source or data behind it here, so there is nothing to check it against. The quote shows it is in the paper.
In the paper
“Progressive Cactus can be run on many different environments: single machines (for small alignments), conventional clusters, and commercial clouds.”
§ Progressive Cactus is a multiple-genome aligner for the thousand-genome era > Progressive Cactus
plain- Asserted: passes — The authors put it forward as true.
- Checkable: passes — It can be checked against evidence.
- Load-bearing: fails — The paper’s conclusions may not depend on it.
- Based: passes — The paper gives a reason why it holds.
Probably not a substantial claim. The paper’s conclusions may not depend on it.
A result the paper reports from its own data — it cites no other source for it, so there is none to check. The quote shows it is in the paper.
In the paper
“Progressive Cactus aligned more total bases to chicken (covering an average of 69.4% of the chicken genome from the other species) than MULTIZ (64.9%), for an average increase of 47 Mb.”
§ Progressive Cactus is a multiple-genome aligner for the thousand-genome era > 600-way amniote alignment
plaindirect- Asserted: passes — The authors put it forward as true.
- Checkable: passes — It can be checked against evidence.
- Load-bearing: passes — The paper’s conclusions depend on it.
- Based: passes — The paper gives a reason why it holds.
It may state two separate claims as one.
A result the paper reports from its own data — it cites no other source for it, so there is none to check. The quote shows it is in the paper.
In the paper
“Of 84,001 transcripts, BLAT mapped 70%, BLAST mapped 80%, LASTZ mapped 67%, and Progressive Cactus mapped 74%.”
§ Progressive Cactus is a multiple-genome aligner for the thousand-genome era > 600-way amniote alignment
plain- Asserted: passes — The authors put it forward as true.
- Checkable: passes — It can be checked against evidence.
- Load-bearing: passes — The paper’s conclusions depend on it.
- Based: passes — The paper gives a reason why it holds.
It may state two separate claims as one.
The paper states this without a source or data behind it here, so there is nothing to check it against. The quote shows it is in the paper.
In the paper
“the amniote (human–chicken) ancestral assembly has a much lower proportion of reconstructed sequence than its immediate children, the avian and eutherian mammal ancestors, for example, retaining 16.3% of chicken intron bases versus 84.4% in the avian ancestor, and 7.2% of human intron bases versus 56.5% in the eutherian ancestor.”
§ Progressive Cactus is a multiple-genome aligner for the thousand-genome era > 600-way amniote alignment
plain- Asserted: passes — The authors put it forward as true.
- Checkable: passes — It can be checked against evidence.
- Load-bearing: unclear — It is unclear whether the paper’s conclusions depend on it.
- Based: passes — The paper gives a reason why it holds.
It may state two separate claims as one.
A result the paper reports from its own data — it cites no other source for it, so there is none to check. The quote shows it is in the paper.
In the paper
“Coverage within the 600-way alignment closely tracks phylogenetic distance and genome size; for example, a median coverage on human of 2.3 gigabases (Gb) from Euarchonta mammalian species, versus 1.2 Gb and 1.0 Gb from more distant Laurasiatheria and Glires mammalian species, respectively (Fig. 3b, c).”
§ Progressive Cactus is a multiple-genome aligner for the thousand-genome era > 600-way amniote alignment
plaincorrelational- Asserted: passes — The authors put it forward as true.
- Checkable: passes — It can be checked against evidence.
- Load-bearing: unclear — It is unclear whether the paper’s conclusions depend on it.
- Based: passes — The paper gives a reason why it holds.
It may state two separate claims as one.
The paper states this without a source or data behind it here, so there is nothing to check it against. The quote shows it is in the paper.
In the paper
“This forbids the representation of gene-tree-species-tree discordance as would occur in incomplete lineage-sorting or horizontal transfer, as well as the exact ordering of multiple duplication events along a single branch.”
§ Progressive Cactus is a multiple-genome aligner for the thousand-genome era > Methods > Paralogy resolution
plaindirect- Asserted: passes — The authors put it forward as true.
- Checkable: passes — It can be checked against evidence.
- Load-bearing: passes — The paper’s conclusions depend on it.
- Based: passes — The paper gives a reason why it holds.
It may state two separate claims as one.
A result the paper reports from its own data — it cites no other source for it, so there is none to check. The quote shows it is in the paper.
In the paper
“although the relative rates remained lower for insertions (1.2% of the substitution rate for both clades) and for deletions (2.4% and 1.2% of the substitution rate for avians and eutherians, respectively)”
§ Progressive Cactus is a multiple-genome aligner for the thousand-genome era > 600-way amniote alignment
plain- Asserted: passes — The authors put it forward as true.
- Checkable: passes — It can be checked against evidence.
- Load-bearing: unclear — It is unclear whether the paper’s conclusions depend on it.
- Based: passes — The paper gives a reason why it holds.
It may state two separate claims as one.
A result the paper reports from its own data — it cites no other source for it, so there is none to check. The quote shows it is in the paper.
In the paper
“Of the two methods, the newer best-hit filtering removes many more probably paralogous alignments, especially to closely related genomes, while leaving approximately the same amount of sequence covered by at least one alignment.”
§ Progressive Cactus is a multiple-genome aligner for the thousand-genome era > Methods > Paralogy resolution
plaindirect- Asserted: passes — The authors put it forward as true.
- Checkable: passes — It can be checked against evidence.
- Load-bearing: passes — The paper’s conclusions depend on it.
- Based: passes — The paper gives a reason why it holds.
It may state two separate claims as one.
A result the paper reports from its own data — it cites no other source for it, so there is none to check. The quote shows it is in the paper.
In the paper
“but evidence of a slightly increased rate of insertions in avians (Extended Data Fig. 3a)”
§ Progressive Cactus is a multiple-genome aligner for the thousand-genome era > 600-way amniote alignment
plaincorrelational- Asserted: passes — The authors put it forward as true.
- Checkable: passes — It can be checked against evidence.
- Load-bearing: fails — The paper’s conclusions may not depend on it.
- Based: passes — The paper gives a reason why it holds.
Probably not a substantial claim. The paper’s conclusions may not depend on it.
A result the paper reports from its own data — it cites no other source for it, so there is none to check. The quote shows it is in the paper.
In the paper
“Both methods resulted in alignments that had accuracy deviating less than 0.1% from the full alignment that included the macaque from the start: both addition methods, as well as the full alignment, achieved an F1 score of 0.926 (Extended Data Table 1).”
§ Progressive Cactus is a multiple-genome aligner for the thousand-genome era > Methods > Adding a new genome to an existing alignment
plainSingle case- Asserted: passes — The authors put it forward as true.
- Checkable: passes — It can be checked against evidence.
- Load-bearing: passes — The paper’s conclusions depend on it.
- Based: passes — The paper gives a reason why it holds.
It may state two separate claims as one.
The paper states this without a source or data behind it here, so there is nothing to check it against. The quote shows it is in the paper.
In the paper
“The biology of overlapping gene structures and the ambiguities in defining genes cause around 4% of genomic bases to appear in more than one gene in the RNA, and 3% in the CDS gene sets owing to overlap.”
§ Progressive Cactus is a multiple-genome aligner for the thousand-genome era > Methods > Transcript and gene alignment subsets and comparison
hedgeddirect- Asserted: passes — The authors put it forward as true.
- Checkable: passes — It can be checked against evidence.
- Load-bearing: fails — The paper’s conclusions may not depend on it.
- Based: fails — The paper may give no reason why it holds.
Probably not a substantial claim. The paper’s conclusions may not depend on it. The paper may give no reason why it holds. It may state two separate claims as one.
A result the paper reports from its own data — it cites no other source for it, so there is none to check. The quote shows it is in the paper.
In the paper
“All ancestors up to human-rhesus had over 78% of the human complement of L1PA6 elements (Supplementary Fig. 10).”
§ Progressive Cactus is a multiple-genome aligner for the thousand-genome era > Methods > Repetitive elements within ancestral sequences
plain- Asserted: passes — The authors put it forward as true.
- Checkable: passes — It can be checked against evidence.
- Load-bearing: fails — The paper’s conclusions may not depend on it.
- Based: passes — The paper gives a reason why it holds.
Probably not a substantial claim. The paper’s conclusions may not depend on it.
The paper states this without a source or data behind it here, so there is nothing to check it against. The quote shows it is in the paper.
In the paper
“For this reason, Progressive Cactus alignments are capable of representing complex orthology/paralogy relationships, with an ability to display the alignment(s) labelled as orthologous, but also the option for a user to request alignments to paralogues at a customizable divergence-time threshold.”
§ Progressive Cactus is a multiple-genome aligner for the thousand-genome era > Methods > Paralogy resolution
plaindirect- Asserted: passes — The authors put it forward as true.
- Checkable: passes — It can be checked against evidence.
- Load-bearing: passes — The paper’s conclusions depend on it.
- Based: passes — The paper gives a reason why it holds.
It may state two separate claims as one.
A result the paper reports from its own data — it cites no other source for it, so there is none to check. The quote shows it is in the paper.
In the paper
“Comparing the best-hit filtering alignment and the one using the single copy outgroup filtering, the amount of human sequence mapping to two or more places in the chimpanzee genome was reduced from 6.1% to 2.6%, while the total amount of human covered by chimpanzee actually increased owing to the removal of ancient homologues, simplifying the initial alignment relationships (see Extended Data Fig.”
§ Progressive Cactus is a multiple-genome aligner for the thousand-genome era > Methods > Paralogy resolution
plaindirect- Asserted: passes — The authors put it forward as true.
- Checkable: passes — It can be checked against evidence.
- Load-bearing: passes — The paper’s conclusions depend on it.
- Based: passes — The paper gives a reason why it holds.
It may state two separate claims as one.
A result the paper reports from its own data — it cites no other source for it, so there is none to check. The quote shows it is in the paper.
In the paper
“The ancestral reconstructions within the 600-way alignment are highly complete, especially for functional sequence: 86% of human coding bases are represented in our reconstruction of the ancestor of all placental mammals, whereas 95% of chicken coding bases are represented in our reconstruction of the common ancestor of avians (Fig. 3d, e).”
§ Progressive Cactus is a multiple-genome aligner for the thousand-genome era > 600-way amniote alignment
plain- Asserted: passes — The authors put it forward as true.
- Checkable: passes — It can be checked against evidence.
- Load-bearing: passes — The paper’s conclusions depend on it.
- Based: passes — The paper gives a reason why it holds.
It may state two separate claims as one.
The paper states this without a source or data behind it here, so there is nothing to check it against. The quote shows it is in the paper.
In the paper
“Progressive aligners use a ‘guide tree’ to recursively break a multiple alignment problem into many smaller sub-alignments, each of which is solved independently; the resulting sub-alignments are themselves aligned together according to the tree structure to create the final alignment.”
§ Progressive Cactus is a multiple-genome aligner for the thousand-genome era > Progressive Cactus
plaindirect- Asserted: passes — The authors put it forward as true.
- Checkable: passes — It can be checked against evidence.
- Load-bearing: passes — The paper’s conclusions depend on it.
- Based: passes — The paper gives a reason why it holds.
Probably not a substantial claim.
The paper states this without a source or data behind it here, so there is nothing to check it against. The quote shows it is in the paper.
In the paper
“Two of the most common limitations are ‘reference bias’, the result of constraining a multiple alignment to only regions present in a single reference genome, and restricting the alignment to be ‘single-copy’, which allows only a single alignment in any column in any given genome, causing the alignment to miss multiple-orthology relationships created by lineage-specific duplications.”
§ Progressive Cactus is a multiple-genome aligner for the thousand-genome era > Main
plain- Asserted: passes — The authors put it forward as true.
- Checkable: passes — It can be checked against evidence.
- Load-bearing: passes — The paper’s conclusions depend on it.
- Based: passes — The paper gives a reason why it holds.
It may state two separate claims as one.
The paper states this without a source or data behind it here, so there is nothing to check it against. The quote shows it is in the paper.
In the paper
“Our progressive approach means that the alignment between two genomes distant in the guide tree is informed by the reconstructions of the ancestral genomes along the path, which is in turn formed using data from other genomes in the tree.”
§ Progressive Cactus is a multiple-genome aligner for the thousand-genome era > Effect of assembly quality on alignment
plaindirect- Asserted: passes — The authors put it forward as true.
- Checkable: passes — It can be checked against evidence.
- Load-bearing: passes — The paper’s conclusions depend on it.
- Based: passes — The paper gives a reason why it holds.
Probably not a substantial claim. It may state two separate claims as one.
A claim is checked only against the cited paper’s full text, never its abstract, and none is available for its sources.
In the paper
“The avian species tree is still being actively debated28,29 and there are different plausible hypotheses, making birds an excellent test case with no single clearly correct guide tree.”
§ Progressive Cactus is a multiple-genome aligner for the thousand-genome era > Effect of the guide tree
What the sources say
- Not checked — no full text of the sourcecites [28] Prum, R. O. et al. A comprehensive phylogeny of birds (Aves) using targeted next-generation DNA sequencing. Nature 526, 569–573 (2015). source
- Not checked — no full text of the sourcecites [29] Jarvis, E. D. et al. Whole-genome analyses resolve early branches in the tree of life of modern birds. Science 346, 1320–1331 (2014). source
plaindirect- Asserted: passes — The authors put it forward as true.
- Checkable: passes — It can be checked against evidence.
- Load-bearing: passes — The paper’s conclusions depend on it.
- Based: passes — The paper gives a reason why it holds.
It may state two separate claims as one.
The paper states this without a source or data behind it here, so there is nothing to check it against. The quote shows it is in the paper.
In the paper
“many intentionally limit the alignments they produce to simplify the problem.”
§ Progressive Cactus is a multiple-genome aligner for the thousand-genome era > Main
plaindirect- Asserted: passes — The authors put it forward as true.
- Checkable: passes — It can be checked against evidence.
- Load-bearing: passes — The paper’s conclusions depend on it.
- Based: passes — The paper gives a reason why it holds.
Probably not a substantial claim.
The paper states this without a source or data behind it here, so there is nothing to check it against. The quote shows it is in the paper.
In the paper
“Because HAL does not produce a fully binarized history of duplication events, we compared the MRCA of randomly selected pairs of sites from genomes containing a duplication within the column.”
§ Progressive Cactus is a multiple-genome aligner for the thousand-genome era > Methods > Paralogy resolution
plain- Asserted: passes — The authors put it forward as true.
- Checkable: passes — It can be checked against evidence.
- Load-bearing: passes — The paper’s conclusions depend on it.
- Based: passes — The paper gives a reason why it holds.
Probably not a substantial claim.
A conclusion the paper draws from its own results — it cites no other source for it, so there is none to check. The quote shows it is in the paper.
In the paper
“In this way, the computational cost is reduced to be far less than naively aligning against the entire outgroup set, while still retaining nearly all of the benefit.”
§ Progressive Cactus is a multiple-genome aligner for the thousand-genome era > Methods > Local alignment and outgroup selection
plaindirect- Asserted: passes — The authors put it forward as true.
- Checkable: passes — It can be checked against evidence.
- Load-bearing: passes — The paper’s conclusions depend on it.
- Based: passes — The paper gives a reason why it holds.
It may state two separate claims as one.
- Rests on an assumption: Any region already containing an outgroup alignment benefits very little from aligning an additional outgroup.
A conclusion the paper draws from its own results — it cites no other source for it, so there is none to check. The quote shows it is in the paper.
In the paper
“This probably reflects the fact that though the losses caused by not removing recoverable chains in any single subproblem are relatively small, they can compound to be quite considerable in large alignments since many subproblems are involved in creating the alignment between distant species (such as human and mouse, which are separated by seven internal nodes in this tree).”
§ Progressive Cactus is a multiple-genome aligner for the thousand-genome era > Methods > Improvements from removing recoverable sequence
hedgedconditional- Asserted: passes — The authors put it forward as true.
- Checkable: passes — It can be checked against evidence.
- Load-bearing: passes — The paper’s conclusions depend on it.
- Based: passes — The paper gives a reason why it holds.
It may state two separate claims as one.
A conclusion the paper draws from its own results — it cites no other source for it, so there is none to check. The quote shows it is in the paper.
In the paper
“All primary alignments are added to the initial graph unconditionally because they represent the most likely orthologue relationship (or in the case of multiple orthology, probably a random orthologue) (Supplementary Fig. 15).”
§ Progressive Cactus is a multiple-genome aligner for the thousand-genome era > Methods > Paralogy resolution
hedgeddirect- Asserted: passes — The authors put it forward as true.
- Checkable: passes — It can be checked against evidence.
- Load-bearing: passes — The paper’s conclusions depend on it.
- Based: fails — The paper may give no reason why it holds.
Probably not a substantial claim. The paper may give no reason why it holds. It may state two separate claims as one.
A conclusion the paper draws from its own results — it cites no other source for it, so there is none to check. The quote shows it is in the paper.
In the paper
“These problematic incomplete blocks become more prevalent at longer evolutionary distances: the local aligner will miss more true homologies at increasing distances, causing more incomplete blocks and in turn a far worse alignment.”
§ Progressive Cactus is a multiple-genome aligner for the thousand-genome era > Methods > Removing recoverable chains
plaindirect- Asserted: passes — The authors put it forward as true.
- Checkable: passes — It can be checked against evidence.
- Load-bearing: passes — The paper’s conclusions depend on it.
- Based: passes — The paper gives a reason why it holds.
It may state two separate claims as one.
A conclusion the paper draws from its own results — it cites no other source for it, so there is none to check. The quote shows it is in the paper.
In the paper
“these unrecoverable blocks represent a minimal set of anchors that can be extended from to recover the alignment relationships from the original sequence graph as well as potential additional alignment relationships.”
§ Progressive Cactus is a multiple-genome aligner for the thousand-genome era > Methods > Removing recoverable chains
plain- Asserted: passes — The authors put it forward as true.
- Checkable: passes — It can be checked against evidence.
- Load-bearing: fails — The paper’s conclusions may not depend on it.
- Based: fails — The paper may give no reason why it holds.
Probably not a substantial claim. The paper’s conclusions may not depend on it. The paper may give no reason why it holds.
What the paper did — it cites no source for this, so there is none to check. The quote shows it is in the paper.
In the paper
“These base-calls are generated as the alignment is being made, so they necessarily take only a part of the alignment information into account and may be different than the ideal base-calls would be if taking into account information across the entire alignment.”
§ Progressive Cactus is a multiple-genome aligner for the thousand-genome era > Methods > Ancestral genome reconstruction
hedgeddirect- Asserted: passes — The authors put it forward as true.
- Checkable: passes — It can be checked against evidence.
- Load-bearing: unclear — It is unclear whether the paper’s conclusions depend on it.
- Based: passes — The paper gives a reason why it holds.
It may state two separate claims as one.
The paper states this without a source or data behind it here, so there is nothing to check it against. The quote shows it is in the paper.
In the paper
“The original CAF algorithm was focused on removing small rearrangements while retaining as much of the original alignment relationships as possible in the filtered cactus graph.”
§ Progressive Cactus is a multiple-genome aligner for the thousand-genome era > Methods > Removing recoverable chains
plain- Asserted: passes — The authors put it forward as true.
- Checkable: passes — It can be checked against evidence.
- Load-bearing: passes — The paper’s conclusions depend on it.
- Based: passes — The paper gives a reason why it holds.
Probably not a substantial claim.
The paper states this without a source or data behind it here, so there is nothing to check it against. The quote shows it is in the paper.
In the paper
“These projects will give us incredible insight into natural history, but will need massive genome alignments.”
§ Progressive Cactus is a multiple-genome aligner for the thousand-genome era > Discussion
plaindirect- Asserted: passes — The authors put it forward as true.
- Checkable: fails — It may be too vague to check against evidence.
- Load-bearing: passes — The paper’s conclusions depend on it.
- Based: passes — The paper gives a reason why it holds.
Probably not a substantial claim. It may be too vague to check against evidence.
A conclusion the paper draws from its own results — it cites no other source for it, so there is none to check. The quote shows it is in the paper.
In the paper
“this allows lineage-specific duplications of ingroup genomes to correctly land in the same block, while avoiding merging blocks from likely-paralogous alignments.”
§ Progressive Cactus is a multiple-genome aligner for the thousand-genome era > Methods > Paralogy resolution
plaindirect- Asserted: passes — The authors put it forward as true.
- Checkable: passes — It can be checked against evidence.
- Load-bearing: passes — The paper’s conclusions depend on it.
- Based: passes — The paper gives a reason why it holds.
It may state two separate claims as one.
What the paper did — it cites no source for this, so there is none to check. The quote shows it is in the paper.
In the paper
“The experiments were not randomized, and there was no blinding.”
§ Progressive Cactus is a multiple-genome aligner for the thousand-genome era > Methods > Data reporting
plain- Asserted: passes — The authors put it forward as true.
- Checkable: passes — It can be checked against evidence.
- Load-bearing: fails — The paper’s conclusions may not depend on it.
- Based: passes — The paper gives a reason why it holds.
Probably not a substantial claim. The paper’s conclusions may not depend on it. It may state two separate claims as one.
A conclusion the paper draws from its own results — it cites no other source for it, so there is none to check. The quote shows it is in the paper.
In the paper
“As a result, these incomplete blocks will remain incomplete: they prevent the true alignment relationship from being found, even if an adjacent syntenic anchor block is complete and contains all desired alignment relationships.”
§ Progressive Cactus is a multiple-genome aligner for the thousand-genome era > Methods > Removing recoverable chains
plaindirect- Asserted: passes — The authors put it forward as true.
- Checkable: passes — It can be checked against evidence.
- Load-bearing: passes — The paper’s conclusions depend on it.
- Based: passes — The paper gives a reason why it holds.
It may state two separate claims as one.
What the paper did — it cites no source for this, so there is none to check. The quote shows it is in the paper.
In the paper
“Sample selection was made according to the needs of the Zoonomia and B10K projects.”
§ Progressive Cactus is a multiple-genome aligner for the thousand-genome era > Methods > Data reporting
plaindirect- Asserted: passes — The authors put it forward as true.
- Checkable: passes — It can be checked against evidence.
- Load-bearing: fails — The paper’s conclusions may not depend on it.
- Based: passes — The paper gives a reason why it holds.
Probably not a substantial claim. The paper’s conclusions may not depend on it.
The paper relies on this without support.
The existing implementation of Cactus struggles in regions of highly duplicated sequences.
“and struggles in regions of highly duplicated sequences.”
The paper relies on this without support.
Genome alignment is a computationally intensive task.
“Although genome alignment is a computationally intensive task”
The paper relies on this without support.
Any region already containing an outgroup alignment benefits very little from aligning an additional outgroup.
“we note that in general any region already containing an outgroup alignment benefits very little from aligning an additional outgroup.”
The paper relies on this without support.
Unmasked repetitive sequence can negatively affect alignment runtimes and quality.
“often repetitive sequence goes unmasked due to poor masking or incomplete repeat libraries for newly-sequenced species. This can negatively affect alignment runtimes (as alignments need to be enumerated to and from all copies of a repetitive sequence) and impact quality.”
The paper relies on this without support.
The approximately maximum-likelihood trees independently re-estimated by FastTree from the same regions are accurate enough to serve as a reference against which errors in the HAL trees can be detected.
“we compared phylogenetic trees implicit in the columns of HAL alignments to independently re-estimated approximately maximum likelihood (ML) trees produced by FastTree (http://www.microbesonline.org/fasttree/, version 2.1.11)57 for the same regions.”
Claims other papers make about this one
Each is checked against this paper’s own text: does it say what the citing paper says it does?
The cited source doesn’t support the claim as written.
In the citing paper
“It generally has a time complexity of O ( n 2 lg n ) for aligning n genomes.”
From Whole-Genome Alignment: Methods, Challenges, and Future Directions (2024) · cites this paper as [49]
Checked by a reasoning model — may be wrong.
Experimental — accuracy not yet measuredThe source backs part of the claim, not all of it — or backs it for a different population, condition or comparison.
In the citing paper
“The use of a graph-based method allows Progressive Cactus to efficiently manage and process complex genomic alignments through representing sequences and their relationships in a dynamic, scalable structure.”
From Whole-Genome Alignment: Methods, Challenges, and Future Directions (2024) · cites this paper as [49]
Experimental — accuracy not yet measuredThe source backs part of the claim, not all of it — or backs it for a different population, condition or comparison.
In the citing paper
“The existing graph undergoes iterative refinement as new genomes are added, optimizing the graph structure based on sequence homologies and structural constraints;”
From Whole-Genome Alignment: Methods, Challenges, and Future Directions (2024) · cites this paper as [49]
Experimental — accuracy not yet measuredThe source backs part of the claim, not all of it — or backs it for a different population, condition or comparison.
In the citing paper
“Progressive Cactus iterates through the alignment process multiple times, refining the alignment graph at each step;”
From Whole-Genome Alignment: Methods, Challenges, and Future Directions (2024) · cites this paper as [49]
Experimental — accuracy not yet measuredThe cited source says what the claim attributes to it.
In the citing paper
“Cactus is a tool that uses a graph-based approach to combine sets of pairwise alignments obtained from lastz into a multiple genome alignment37.”
From A draft human pangenome reference. (2023) · cites this paper as [37]
The cited source says what the claim attributes to it.
In the citing paper
“This approach systematically aligns multiple genomes by constructing and manipulating a graph structure that represents relationships between different genomic sequences.”
From Whole-Genome Alignment: Methods, Challenges, and Future Directions (2024) · cites this paper as [49]
The cited source says what the claim attributes to it.
In the citing paper
“Progressive Cactus employs a graph-based method for whole-genome alignment, introducing a novel methodology through a progressive alignment strategy [49].”
From Whole-Genome Alignment: Methods, Challenges, and Future Directions (2024) · cites this paper as [49]
The cited source says what the claim attributes to it.
In the citing paper
“These technological advancements also led to a new generation of genome alignment and assembly algorithms leveraging the new data types (84–89).”
From Topological Approaches in Animal Comparative Genomics (2026) · cites this paper as [87]
Self-check
Percentages, sums and reported differences re-computed from the paper’s own numbers.
Each contradiction between two passages listed here was confirmed by an independent check.
Rated minor: it would not touch a result — a value no result rests on, a p-value that stays on the same side of the significance level, or a conflict that is clerical, resolved elsewhere in the paper, or outside its own findings.
In the paper
§ Progressive Cactus is a multiple-genome aligner for the thousand-genome era > 600-way amniote alignment
“small (less than or equal to 20 base pairs (bp)) insertion and deletion events”
§ Progressive Cactus is a multiple-genome aligner for the thousand-genome era > Methods > Micro-indel events within the 600-way
“only calls spanning less than 20 bp (in the child for insertions, and the parent for deletions) were counted”
Citations
Cites
BLAST+: architecture and applications
Camacho, C., Coulouris, G., Avagyan, V., Ma, N., Papadopoulos, J., Bealer, K., & Madden, T. L. (2009) · BMC Bioinformatics · doi:10.1186/1471-2105-10-421 · Cited by 22,074 · cited 5×
“Of 84,001 transcripts, BLAT mapped 70%, BLAST mapped 80%, LASTZ mapped 67%, and Progressive Cactus mapped 74%.”
InfluentialPHYLIP-Phylogeny inference package (Version 3.2)
Felsenstein, J. (1989) · Cladistics · Cited by 17,682
FastTree 2 – Approximately Maximum-Likelihood Trees for Large Alignments
Price, M. N., Dehal, P. S., & Arkin, A. P. (2010) · PLoS ONE · doi:10.1371/journal.pone.0009490 · Cited by 14,894
APE: analyses of phylogenetics and evolution in R language
Paradis, E., Claude, J., & Strimmer, K. (2004) · Bioinformatics · doi:10.1093/bioinformatics/btg412 · Cited by 11,335 · cited 1×
“Finally, the ‘consensus’ tree was produced as a strict consensus of the Jarvis and Prum trees (collapsing all groupings that were not the same in both trees) using the ape::consensus method from the APE R package 44 .”
Evolution of Protein Molecules
JUKES, T. H., & CANTOR, C. R. (1969) · Mammalian Protein Metabolism · doi:10.1016/b978-1-4832-3211-9.50009-7 · Cited by 11,032
phytools: an R package for phylogenetic comparative biology (and other things)
Revell, L. J. (2011) · Methods in Ecology and Evolution · doi:10.1111/j.2041-210x.2011.00169.x · Cited by 9,439
<tt>BLAT</tt> —The <tt>BLAST</tt> -Like Alignment Tool
Kent, W. J. (2002) · Genome Research · doi:10.1101/gr.229202 · Cited by 8,480
progressiveMauve: Multiple Genome Alignment with Gene Gain, Loss and Rearrangement
Darling, A. E., Mau, B., & Perna, N. T. (2010) · PLoS ONE · doi:10.1371/journal.pone.0011147 · Cited by 3,848
Real-Time DNA Sequencing from Single Polymerase Molecules
Eid, J., Fehr, A., Gray, J., Luong, K., Lyle, J., Otto, G., Peluso, P., Rank, D., Baybayan, P., Bettman, B., et al. (2009) · Science · doi:10.1126/science.1162986 · Cited by 3,732
Mash: fast genome and metagenome distance estimation using MinHash
Ondov, B. D., Treangen, T. J., Melsted, P., Mallonee, A. B., Bergman, N. H., Koren, S., & Phillippy, A. M. (2016) · Genome biology · doi:10.1186/s13059-016-0997-x · Cited by 3,373
Cited by
Sorted by citations
Cunningham, F., Allen, J. E., Allen, J., Alvarez-Jarreta, J., Amode, M. R., Armean, I. M., Austine-Orimoloye, O., Azov, A. G., Barnes, I., Bennett, R., et al. (2022) · Nucleic Acids Research · doi:10.1093/nar/gkab1049 · Cited by 1,923
“We have deployed the Cactus (9) multiple genome aligner software, which is able to compute high quality multiple genome alignments with thousands of genomes in linear time.”
Frankish, A., Diekhans, M., Jungreis, I., Lagarde, J., Loveland, J. E., Mudge, J. M., Sisu, C., Wright, J. C., Armstrong, J., Barnes, I., et al. (2021) · Nucleic Acids Research · doi:10.1093/nar/gkaa1087 · Cited by 1,334
“For example, we have used Cactus to create a 600-way vertebrate whole genome alignment incorporating data from the 200 Mammals and Bird 10K projects as the basis of a single base-pair resolution map of evolutionary selection (20).”
MethodSelf-citationA draft human pangenome reference.
Liao, W.-W., Asri, M., Ebler, J., Doerr, D., Haukness, M., Hickey, G., Lu, S., Lucas, J. K., Monlong, J., Abel, H. J., et al. (2023) · Nature · doi:10.1038/s41586-023-05896-x · Cited by 1,129
“MC extends the Minigraph pangenome with a base-level alignment of the homology relationships between the assemblies using the Cactus genome aligner (Armstrong et al., 2020), while retaining the structure of the Minigraph pangenome.”
MethodInfluentialSelf-citationMartin, F. J., Amode, M. R., Aneja, A., Austine-Orimoloye, O., Azov, A. G., Barnes, I., Becker, A., Bennett, R., Berry, A. E., Bhai, J. N. N. T., et al. (2022) · Nucleic Acids Research · doi:10.1093/nar/gkac958 · Cited by 1,041
Comparative host-coronavirus protein interaction networks reveal pan-viral disease mechanisms
Gordon, D. E., Hiatt, J. B., Bouhaddou, M., Rezelj, V. V., Ulferts, S., Braberg, H., Jureka, A. S., Obernier, K., Guo, J. Z., Batra, J., et al. (2020) · Science · doi:10.1126/science.abe9403 · Cited by 747
Metadata
- Authors
- Armstrong, J., Hickey, G., Diekhans, M., Fiddes, I. T., Novak, A. M., Deran, A., Fang, Q., Xie, D., Feng, S., Stiller, J., Genereux, D., Johnson, J., Marinescu, V. D., Alföldi, J., Harris, R. S., Lindblad-Toh, K., Haussler, D., Karlsson, E., Jarvis, E. D., Zhang, G., & Paten, B.
- Affiliations
- University of California, Santa Cruz (US)
- University of Copenhagen (DK)
- University of Chinese Academy of Sciences (CN)
- Kunming Institute of Zoology (CN)
- Broad Institute (US)
- Uppsala University (SE)
- Pennsylvania State University (US)
- Howard Hughes Medical Institute (US)
- Corresponding author
- Zhang, Guojie
- Paten, Benedict
- ORCID
- Venue
- Nature
- Published
- 2020-11-11
- Volume
- 587
- Issue
- 7833
- Pages
- 246-251
- ISSN
- 0028-0836 (ISSN-L)
- 1476-4687
- PMC
- PMC7673649
- OpenAlex
- W3100651612
- Cited by
- 586
- References
- 66
- Citations by year
- 2026: 96 · 2025: 132 · 2024: 128 · 2023: 100 · 2022: 85 · 2021: 27 · 2020: 17
- FWCI
- 19.29
- Type
- journal article
- Language
- en
- Open access
- hybrid
- doi.org
- Locations
- Nature (publishedVersion, cc-by)
- PubMed Central (publishedVersion, cc-by)
- PubMed (publishedVersion)
- Research at the University of Copenhagen (University of Copenhagen) (publishedVersion, cc-by)
- eScholarship@UMassChan (submittedVersion, cc-by)
- KTH Publication Database DiVA (KTH Royal Institute of Technology) (submittedVersion, other-oa)
- RePEc: Research Papers in Economics (submittedVersion)
- eScholarship (California Digital Library) (submittedVersion)
- eScholarship (California Digital Library) (submittedVersion, cc-by)
- Funders
- Villum Fonden (00025900)
- National Institutes of Health
- National Heart, Lung, and Blood Institute (U01HL137183)
- National Human Genome Research Institute (R01HG009737, R01HG010485, R01HG008742, U01HG010971, T32HG008345, U41HG007234, U54HG007990, U01HG010961, U24HG007234, U41HG010972)
- Topics
- Life Sciences › Biochemistry, Genetics and Molecular Biology › Molecular Biology › Genomics and Phylogenetic Studies
- Life Sciences › Biochemistry, Genetics and Molecular Biology › Genetics › Genome Rearrangement Algorithms
- Life Sciences › Biochemistry, Genetics and Molecular Biology › Genetics › Chromosomal and Genetic Variations
- Keywords
- multiple genome alignment, structural variants, genome evolution
- MeSH terms
- Amnion, Animals, Computer Simulation, Haplotypes, Humans, Quality Control, Software, Vertebrates, Sequence Alignment, Genome, Genomics
About these checks
Registry, retraction, Cites and statistics results are computed, not judged, with one exception: a printed reference that no index lists is read once by a model before it counts as a citation error. Claims are extracted by a model and kept only when their quote appears verbatim in the text; each cited source is then checked, with a model’s help, for whether it says what the claim relies on. Those verdicts can be wrong — read the claim’s quote and the cited source before relying on one.
A language model drew the claims from the paper on 2026-11-02, under version 3 of the claim definition (model deepseek-v4.1-flash, prompt extract-v3).
A second model labelled each claim on 2026-11-02 (model jev-1.13-20260917, definition revision gold-guideline-v0.2).
Cited sources are checked with a language model’s help (gpt-6-sol).
Statistics and arithmetic are recomputed, not judged.
Confidence bands are shown only for fields calibrated on our annotated test set. None is calibrated yet, so no band is shown.
What counts as a claim ›How we measure confidence ›How we check this ›
Are you an author, or do you see a problem with this page? Request a review
